Events on November 1, 2017

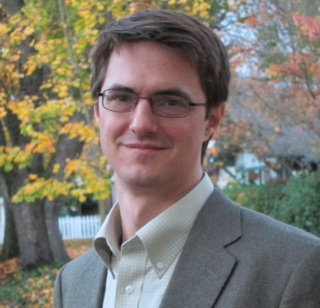
Bill Howe, Associate Professor, the Information School, University of Washington Presents:
Viziometrics: Mining visual information in the scientific literature
November 1, 2017 at 12:00pm for 1hr
Evans Conference Room, WEB 3780
Warnock Engineering Building, 3rd floor.
Bio:
Bill Howe is Associate Professor in the Information School, Adjunct Associate Professor in Computer Science & Engineering, and was the Founding Associate Director of the UW eScience Institute. His research interests are in data management, curation, analytics, and visualization in the sciences. Howe played a leadership role in the Data Science Environment program at UW through a $32.8 million grant awarded jointly to UW, NYU, and UC Berkeley. With support from the MacArthur Foundation and Microsoft, Howe now directs the Urbanalytics group at UW and UW's participation in the Cascadia Urban Analytics Cooperative with the University of British Columbia, where he focuses on data-intensive urban science. He founded the UW Data Science Masters Degree and serves as its inaugural Program Director and Faculty Chair. He has received two Jim Gray Seed Grant awards from Microsoft Research for work on managing environmental data, has had two papers selected for VLDB Journal's "Best of Conference" issues (2004 and 2010), and co-authored what are currently the most-cited papers from both VLDB 2010 and SIGMOD 2012. Howe serves on the program and organizing committees for a number of conferences in the area of databases and scientific data management, developed a first MOOC on data science that attracted over 200,000 students across two offerings, and founded UW's Data Science for Social Good program. He has a Ph.D. in Computer Science from Portland State University and a Bachelor's degree in Industrial & Systems Engineering from Georgia Tech.Abstract:
Visualizations are the currency of scientific communication, but have been largely ignored in bibliometric studies. We classified more than 8 million figures from PubMed into coarse figure types and related the distribution of visualization types to scientific impact, breaking down the results by field of study. Remarkably, we find a significant correlation between scientific impact and the use of visual information, where higher impact papers tend to include more diagrams, and to a lesser extent more plots and photographs. We also find that the effect is modulated by whether citations come from within one's own field or from outside one's field, suggesting new strategies for communicating results across disciplinary boundaries. To explore these results and other ways of extracting this visual information, we developed a "figure first" search engine that quickly identify related figures; we hypothesize that figure-oriented search can improve precision and recall for certain search tasks and present some preliminary results. In ongoing work, we have visualize large collections of related figures as a map that can be used to understand changes in visualization over time and across fields. Finally, we have recently extended our classifier with a new unsupervised approach that can accommodate arbitrary class labels without providing additional training data; this technique allows fine-grained classification for precise searches and test-set generation. We use these results to articulate a new research agenda --- viziometrics --- to study the organization and presentation of visual information in the scientific literature.
Posted by: Deb Zemek


