


 |
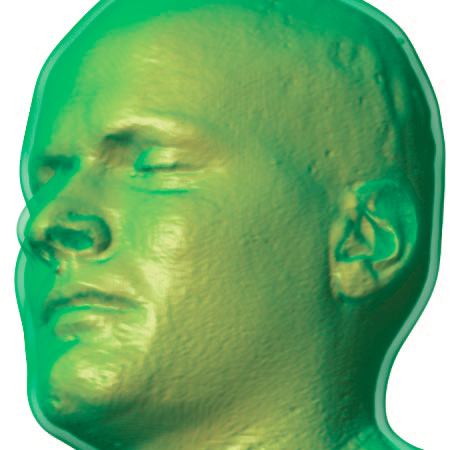
| An Isosurface visualization of a magnetic resonance imaging data set (in orange) surrounded by a volume rendered region of low opacity (in green) to indicate uncertainty in surface position. |
Estimation and Uncertainty
In particular, in our TRD Estimation, we concentrate on treating uncertainty in the fields of biomedical imaging. In turn, our ability to do so is directly tied to another of our main goals, increasing reproducibility of image-based biomedical research. Broadly speaking, achieving the goals we address will improve the ability of biomedical and computational scientists to:- extract quantitative biomedically relevant information from image-based diagnostic tests and therapeutic procedures,
- robustly compare results across common algorithms and even modalities in a repeatable and quantitative manner,
- identify problems that need attention, compare their own results to standard approaches, and test and report on their efforts in a reproducible context, and
- place such results in the context of population statistics or other contextual information.
In the following section we review here some examples of the diverse sources of uncertainty relevant to CIBC:
- biological variability, as for example in population ensemble models of the shape of an organ.
- the need for each stage in the model-building simulation pipeline to assume some level of accuracy for the output from the preceding stage, for instance when a mesh is built from label maps resulting from (necessarily noisy) segmentations, or when an FEM simulation is built from a mesh designed by means of compromises among number, aspect ratio, volume, size, etc., of the finite elements themselves.
- the reduction of complexity requisite in any modeling effort, for example in the representation of an organ as having a single-valued conductivity,
- the loss of information, and consequent sensitivity to noise and model error, due to the physical separation of measurement sensor from a quantity of interest and the superposition or mixing of distinct features and attenuation of signals in the separating medium, for example in EEG recordings on the scalp during epilepsy-related neurological events.
The research at CIBC is expected to significantly increase the ability of biomedical researchers in the areas affected by our DBPs and collaborators to extract meaningful quantitative results from solutions to a variety of imaging problems.
Recent Progress: Uncertainty Analysis and Visualization in Diffusion Imaging
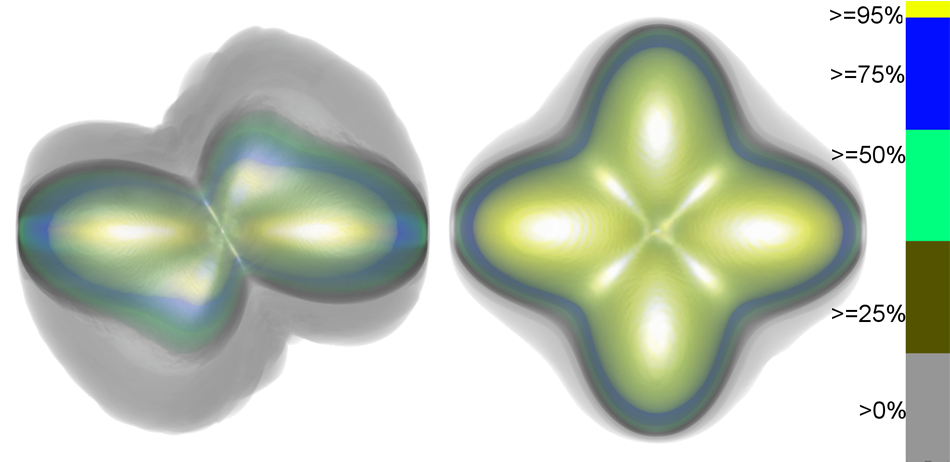 |
| Above: Visualization of the uncertainty in two diffusion shapes of two fibers crossing with a signal to noise ratio of 10. (left) Two fibers crossing at 60 degrees with the weight of 0.6 for first fiber and 0.4 for second fiber. (right) Two fibers crossing at 90 degrees with equal weight. |
In diffusion-tensor imaging (DTI), the diffusivity function is represented by a symmetric positive-definite tensor known as the diffusion tensor (DT). However, diffusion tensors can only describe one dominant diffusion direction per voxel, and thus, are incapable of describing complex fiber structures. On the other hand, in high angular resolution diffusion imaging (HARDI), each voxel is described by a mixture of Gaussians of the form, each describing a different fiber and each with its own weight (referred to as the fiber weight). This leads to different reconstruction techniques where, generally, the diffusion profile is described by an orientational distribution function (ODF) . An ODF has more degrees of freedom than a diffusion tensor, and thus, it can capture complex fiber structures such as crossing fibers. There are various parameters that influence the estimation accuracy of the coefficients that describe the DTs or the ODFs. Also, the choice of acquisition parameters has an impact on the signal-to-noise (SNR) ratio which, in turn, effects the estimation accuracy. Thus, these different parameters bring a level of uncertainty to the resulting diffusion profiles, and hence, uncertainty analysis and visualization become crucial to obtaining a better description of the fiber structure.
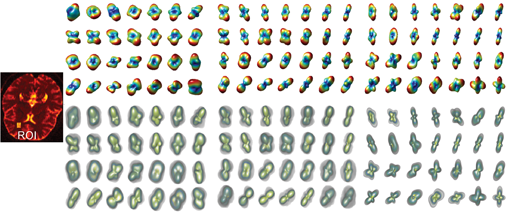 |
| Figure shows the diffusion shape visualization on human brain data, in particular on a subregion. Each diffusion shape is shown as both a single triangular mesh and as quantized function. The extent of the uncertainty in each diffusion shape is much more clear in the latter. |
Diffusion-weighted magnetic resonance (DW-MR) is an imaging technique that enables one to measure diffusion priorities of water molecules in a fibrous tissue. It is primarily used to reveal the white-matter fibers structure of the brain, as well as structures of muscle fibers. An ODF in DW-MR is described by a symmetric spherical glyph that provides information on the three-dimensional diffusion profile within a brain voxel. However, they do not provide any information on diffusion profile variabilities due to uncertainty caused by the different acquisition parameters. Our main contributions is uncertainty analysis and visualization tool based on these ODF glyphs, designated as diffusion shapes.
Awards
CIBC Center Director Dr. Chris Johnson has been honored with the IEEE VGTC Visualization Career Award. This accolade was established in 2004 and is awarded annually to honor an individualʼs lifetime contribution to visualization. Dr. Johnson was selected for this award to recognize his unique technical achievements and field leadership in scientific visualization. Coverage of the award appeared in "News from NCRR, People, Awards, Grants, and New Developments".Dr. Chris Johnson also received the 2010 Rosenblatt Prize for Excellence. This is the University of Utah's highest honor, a gift presented annually to a faculty member who displays excellence in teaching, research, and administrative efforts.
References
F.Jiao, Y. Guv, S. Joshi, C.R. Johnson. "Detection of crossing white matter fibers with high-order tensors and rank-k decompositions," In Information Processing in Medical Imaging, 2011.F. Jiao, J.M. Phillips, J. Stinstra, J. Kueger, R. Varma, E. Hsu, J. Korenberg, C.R. Johnson. "Metrics for Uncertainty Analysis and Visualization of Diffusion Tensor Images," In Proceedings of the 5th international conference on Medical imaging and augmented reality (MIAR), Beijing, China, Springer-Verlag, Berlin, Heidelberg pp. 179--190. September, 2010
K. Potter, J. Krueger, C.R. Johnson. "Towards the Visualization of Multi-Dimentional Stochastic Distribution Data," In Proceedings of The International Conference on Computer Graphics and Visualization (IADIS) 2008, pp. 191--196. 2008.
C.R. Johnson. "Top Scientific Visualization Research Problems," In IEEE Computer Graphics and Applications: Visualization Viewpoints, Vol. 24, No. 4, pp. 13--17. July/August, 2004.