Uncertainty Quantification and Visualization
The graphical depiction of uncertainty information is emerging as a problem of great importance in the field of visualization. Scientific data sets are not considered complete without indications of error, accuracy, or levels of confidence, and this information is often presented as charts and tables alongside visual representations of the data. Uncertainty measures are often excluded from explicit representation within data visualizations because the increased visual complexity incurred can cause clutter, obscure the data display, and may lead to erroneous conclusions or false predictions. However, uncertainty is an essential component of the data, and its display must be integrated in order for a visualization to be considered a true representation of the data. The growing need for the addition of qualitative information into the visual representation of data, and the challenges associated with that need, command fundamental research on the visualization of uncertainty.Projects
 |
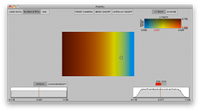
ProbVis: Interactive visualization of probability distribution functions. The ProbVis software tool allows for the interactive display and exploration of a spatial collection of data distributions. A global display shows the value of a difference measure across the spatial domain. The user can change the measure from the L1 Norm to the Hellinger distance. The user is also given a pointer to explore the individual distributions which are diplayed as a PDF or CDF in the lower corner. |
| Interactive Visualization of Probability and Cumulative Density Functions Kristin Potter, Robert M. Kirby, Dongbin Xiu, & Chris R. Johnson International Journal for Uncertainty Quantification, to appear. 2011. |
People
| Faculty | Research Staff | Graduate Students |
| Chris R. Johnson | Yarden Livnant | |
| Valerio Pascucci | JeffPhillips | |
| Mike Kirby | ||
| Paul Rosen |
Links
Uncertainty Visualization Reference LibraryPublications
H. Bhatia, S. Jadhav, P.-T. Bremer, G. Chen, J.A. Levine, L.G. Nonato, V. Pascucci. “Edge Maps: Representing Flow with Bounded Error,” InProceedings of IEEE Pacific Visualization Symposium 2011, Hong Kong, China, pp. (accepted). March, 2011.K. Potter, J.M. Kniss, R. Riesenfeld, C.R. Johnson. “Visualizing Summary Statistics and Uncertainty,” In Computer Graphics Forum (Proceedings of Eurovis 2010), Vol. 29, No. 3, pp. 823--831. 2010.
K. Potter, A. Wilson, P.-T. Bremer, D. Williams, C. Doutriaux, V. Pascucci, C.R. Johhson. “Visualization of Uncertainty and Ensemble Data: Exploration of Climate Modeling and Weather Forecast Data with Integrated ViSUS-CDAT Systems,” In Proceedings of SciDAC 2009, Journal of Physics: Conference Series, Vol. 180, No. 012089, pp. (published online). 2009.
K. Potter, A. Wilson, P.-T. Bremer, D. Williams, C. Doutriaux, V. Pascucci, C.R. Johnson. “Ensemble-Vis: A Framework for the Statistical Visualization of Ensemble Data,” In Proceedings of the 2009 IEEE International Conference on Data Mining Workshops, pp. 233--240. 2009.
K. Potter, J. Krueger, C.R. Johnson. “Towards the Visualization of Multi-Dimentional Stochastic Distribution Data,” In Proceedings of The International Conference on Computer Graphics and Visualization (IADIS) 2008, pp. 191--196. 2008.
J.M. Kniss, R. Van Uitert, A.J. Stephens, G. Li, T. Tasdizen. “Statistically Quantitative Volume Visualization,” In IEEE Visualization 2005, 2005.
C.R. Johnson. “Top Scientific Visualization Research Problems,” In IEEE Computer Graphics and Applications: Visualization Viewpoints, Vol. 24, No. 4, pp. 13--17. July/August, 2004.
G. Kindlmann, R.T. Whitaker, T. Tasdizen, T. Möller. “Curvature-Based Transfer Functions for Direct Volume Rendering: Methods and Applications,” In Proceedings Visualization 2003, pp. 67. October, 2003.
C.R. Johnson, A.R. Sanderson. “A Next Step: Visualizing Errors and Uncertainty,” In IEEE Computer Graphics and Applications, Vol. 23, No. 5, Edited by Theresa-Marie Rhyne, pp. 6--10. September/October, 2003.


