BE6000 Lab 5: Blood Pressure and Exercise Lab
Dafang Wang, April 17th,2009
1. Introduction
This lab explores features of venous circulation and investigates how exercise influences cardiac parameters such as blood pressure, heart rate and ECG signals. The lab basically comprises two components. One major component is to measure the blood pressure in the artery by means of the palpatory method and the auscultatory method. The mechanisms involved in blood pressure evaluation are largely mechanical. The other component is to explore the cardiac output in response to physical exercises. Cardiac outputs such as the heart rate and the blood pressure are directly related and proportional to the demand of human bodies. By applying different levels of exercise intensity, we were able to quantitatively evaluate the response of the cardiovascular system to the demand of the body.
2. Methods
2.1 Arterial blood Pressure Measurement
The sphygmomanometer cuff was wrapped on the upper arm of the subject, approximately at the level of the heart. The cuff was rapidly inflated to approximately 200mm Hg pressure so that the artery was completely blocked. The pressure was then gradually lowered as the air in the rubber bag was released slowly. When the pressure dropped below a certain threshold, the blood flow was resumed. The turbulent flow during the resumption allows two methods to measure the blood pressure.
The first method is named the palpatory method, which records the pressure at which the subject feels the first pulse in the artery. The detected pressure is systolic pressure.
The second method is the auscultatory method, in which the researcher detects the pulse by listening via a stethoscope placed in the antecubital fossa over the brachial artery. When the cuff pressure is higher than the systolic pressure, no sound is to be heard. The pressure at which the first sound is heard is the systolic pressure, at which the blood flow resumes and is turbulent. As the cuff pressure continues to drop, the sound becomes muffler and finally disappears. The pressure at which the sound disappears was the considered the diastolic pressure in this experiment. (Strictly speaking, this is the second diastolic pressure.)
In this lab, systolic/diastolic pressures were detected and compared by both methods.
2.2 Measuring Venous Blood Pressure
With the subject lying on his back, his left arm was lifted passively and the veins at the back of his hand were observed. When the veins barely collapse , the vertical distance between the positions of the veins and the heart was recorded. This distance, along with the known gravities of blood and mercury, was then used to calculate the venous blood pressure in the unit of mmHg.
2.3 Effect of Mechanical Stimulation of Blood Vessels from the Skin
With the subjecting lying on his back, draw the blunt end of a pen with a moderate pressure across the skin of his forearm Wait 2-3 minutes and observe the effects of such pressing.
2.4 Response to Exercise
2.4.1 Constant Load Test
The subject cycled for 8 minutes and then stayed at rest for 6 minutes. Blood pressures, heart rate and ECG signals were recorded at the end of every two minutes. The intensity of the exercise was kept constant and considered to be 1.0, as will be compared with the exercise intensity taken in other two graded load tests.
2.4.2 Graded Load Test
After sufficient rest from the previous test, the subject cycled 8 minutes, followed by 6 minutes of rest. The intensity of cycling was increased every other minute, with the first 2 minutes being in the level 1.0, the second 2 minutes being 1.16, the third 2 minutes being 1.32 and the last 2 minutes being 1.5. Blood pressures, heart rate and ECG signals were recorded at the end of every two minutes.
2.4.3 Graded Load/Unload Test
After sufficient rest from the previous test, the subject cycled 8 minutes with the intensity being increased every two minutes. The exercise started at the level of 1.0 and increased by 0.16 every two minutes. At the end of the 8th minutes the exercise intensity was 1.5. Then the subject continued exercise with the intensity decreasing by 0.16 every two minutes. After 6 minutes of such reduced exercise (i.e., 14 minutes after the test started), the subject turned to rest for 4 minutes. Throughout the entire test, blood pressures, heart rate and ECG signals were recorded at the end of every two minutes.
3. Results
3.1 Arterial blood Pressure Measurement
The systolic pressure was detected to be 138 mmHg by the palpatory method and 140 mmHg by the auscultatory method. The diastolic pressure measured by the auscultatory method was 80 mmHg.
3.2 Measuring Venous Blood Pressure
The measured venous pressure was equal to 220 mm of blood. With the gravity of blood being 1.056 and the gravity of mercury being 13.6, the venous pressure in mmHg was calculated to be 17 mmHg, according to the following formula:
mm of blood * gravity of blood = mm of mercury * gravity of mercury
3.3 Effect of Mechanical Stimulation of Blood Vessels from the Skin
About 2-3 minutes after the forearm was pressed by a pen, the skin became red.
3.5 Response to Exercise
3.5.1 Constant Load
Figure 1 shows the heart rate and the blood pressures (both systolic and diastolic) recorded in the constant load test. Figure 2 illustrates the ECG signals recorded at each step of the test. The signals are ordered from top to bottom. These signals have been timely aligned and they are displayed within a 2200 millisecond interval.

Figure 1.Heart rate and blood pressure in the constant load test.
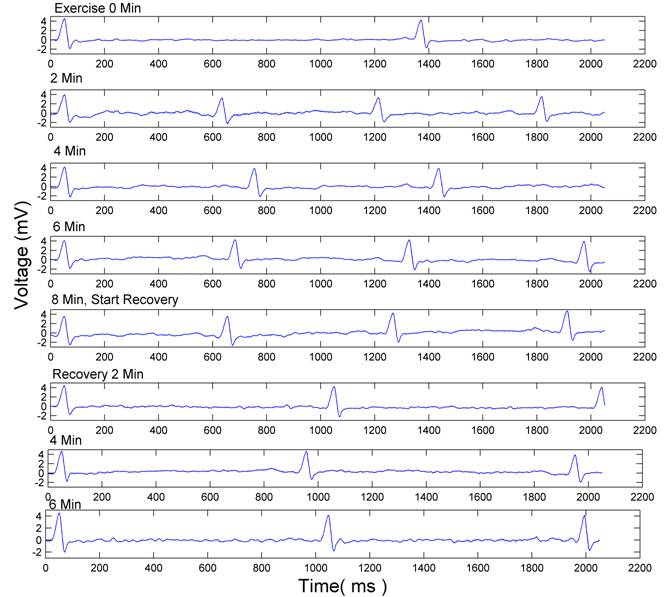
Figure 2. ECG time signals recorded in the constant load test. Signals are arranged from top to bottom according to their recording sequence.
3.5.2 Graded Load Test
The heart rate and blood pressures (both systolic and diastolic) recorded in the graded load test are displayed in Figure 3. Figure 4Figure 2 illustrates the ECG signals recorded at each step of the test. The signals are ordered from top to bottom according to the time they were recorded. These signals have been timely aligned and they are displayed within a 2200 millisecond interval.

Figure 3. Blood pressure and heart rate in the graded load test.
3.5.3 Graded Load and Unload
The heart rate and blood pressures (both systolic and diastolic) recorded in the graded load test are displayed in Figure 5. Figure 6Figure 2 illustrates the ECG signals recorded at each step of the test. The signals are ordered from top to bottom according to the time they were recorded. The signals have been timely aligned and they are displayed within a 2200 millisecond interval.
4. Discussion
4.1 Arterial blood Pressure Measurement
The systolic pressure measured by the palpatory method was slightly less than that measured by the stethoscope (138mmHg vs 140 mmHg). The difference can be attributed to the different mechanisms of both protocols. We believe the auscultatory method is more accurate than the palpatory method, because the latter one is more dependent on the subjective feeling of the experiment subject. In fact, the subject reported nervous feelings and stronger heart beats when the artery was blocked. Such psychological impact may inhibit the subject from making objective judgments about his condition.
The Korotkow’s sounds became more tense as the pressure was further reduced after reaching the systolic pressure (when the first sound was heard). This phenomenon can be explained by the increase of turbulent flow through the still-compressed artery. However, as the artery was released further, turbulent flows turn to laminar flows and the sound disappears.
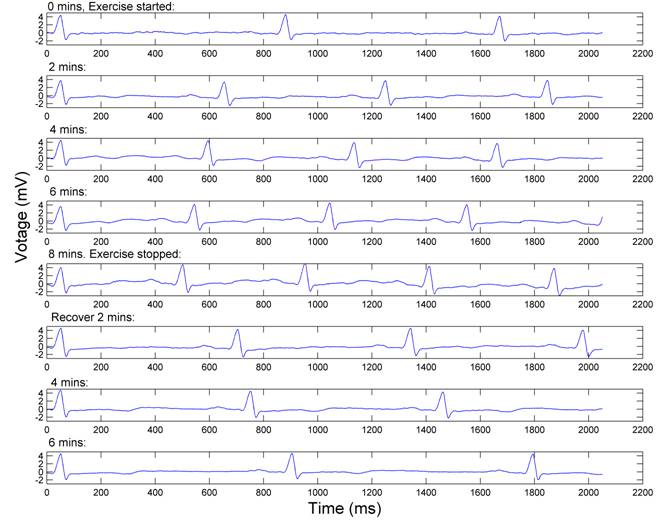
Figure 4. ECG time signals recorded in the constant load test. Signals are arranged from top to bottom according to their recording sequence. The exercise reached the peak at the end of the 8th minutes, followed by 6 minutes of recovery.
4.2 Measuring Venous Blood Pressure
With the elevation of arms, the veins on the back of the hand became vaguer and vaguer until they can be barely seen. The collapse of a vein is caused by the decreased pressure in it. The hardly seen veins indicate zero pressure. This zero pressure resulted from the venous pressure subtracted by counteracted by the pressure of blood accumulated in the arm. Hence the venous pressure was obtained by measuring the height of blood in the arm.
4.3 Effect of Mechanical Stimulation of Blood Vessels from the Skin
Mechanical stimulation on the skins, such as pressing a pen across the forearm, results in red flares on the skin. One possible reason is that the fragile capillaries on the skin broke under pressure. The leak of blood flow into interstitial environments made the skin appear red.

Figure 5. Heart rate and blood pressure in the test of graded load and unload.
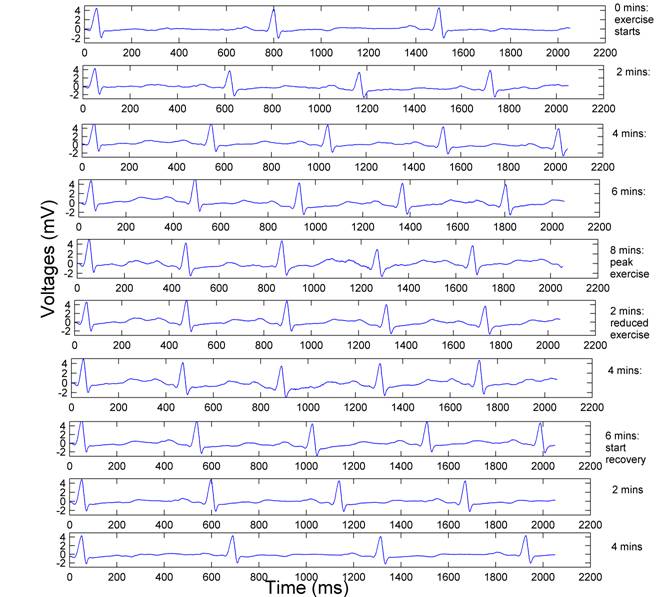
Figure 6. ECG signals recorded in the graded load/unload test. From top to bottom, these signals are ordered by the time they were recorded. The signal at 0 minute is the state of the subject before exercising. The 8th minute is the time right after the peak exercise, after then the exercise was reduced. Then the reduced exercise lasted 6 minutes, followed by 4 minutes of recovery.
4.4 Response to Exercises
4.4.1 Constant Load Test
Overall, the heart rate increased with the exercise and decreased during the recovery. The heart rate increased sharply in the first two minutes of exercise, rising from 54 beat per minute (BPM) to 84 BPM. It then rose gradually to 90 BPM after 6 minutes of exercise and stayed at that level until the exercise ended. Once the subject turned to rest, the heart rate immediately dropped from 90 BPM to 65 BPM. The heart rate then stayed approximately at that level during the entire recovery period. Based on the observation of this test, the heart rate, after becoming stable after exercise, was still 10 BPM higher than its level before the exercise. This phenomenon indicated that the heart output was stably maintained at a higher level than its rest state for a relatively long period.
The systolic blood pressure increased during the exercise, but not as responsive as the heart rate did. The systolic pressure stayed at 120 mmHg for 4 minutes after the exercise started before rising to 140 mmHg. The pressure gradually dropped from the peak level back to original level during the recovery period. The drop was slower than the drop of the heart rate.
The diastolic pressure was stable throughout the test, indicating that the exercise did not affect the diastolic pressure much. On the other hand, this observation implied that the diastolic pressure was not related to the heart output, which ought to vary significantly during exercise.
As illustrated by Figure 2, exercise increased the frequency of ECG signals, but the ECG amplitude did not change. The QRS wave was clear and its shape remained largely constant throughout the test, whereas the P wave and T wave were not notable. The heart rate judged by ECG signals was consistent with the heart rate recorded by specialized electronic devices (the data presented in Figure 1).
4.4.2 Graded Load Test
As shown by Figure 3, the heart rate increased progressively, with the peak being reached at the end of the exercise. The heart rate was initially 71 BPM, higher than the heart rate before the subject taking the constant load test (54 BPM). Given that the subject had rested for 5 minutes after the previous test, it can be inferred that the heart output stayed in a higher level long after physical exercises. The heart rate reached its peak of 120 BPM when the exercise was in its maximum intensity: 1.5. As compared to the peak heart rate of 90 BPM in the constant load test, the graded load test resulted in 33% higher heart output.
The systolic blood pressure in arteries continuously increased from 120 mmHg to 150 mmHg, and then decreased to the original level. The peak pressure was 10 mmHg higher than the peak pressure in the constant load test (140 mmHg). This difference was attributed to the higher exercise intensity in the graded load test.
The diastolic blood pressure stayed at the level of 80 mmHg throughout this test, nearly identical to the diastolic blood pressure observed in the constant load test. This similarity further confirmed our hypothesis that physical exercise (and hence cardiac output) is not directly related to the diastolic pressure.
Figure 4 shows the ECG signals recorded in this test. The amplitude of ECG signals did not change. The QRS wave was clear and its shape remained largely constant throughout the test, whereas the P wave and T wave were not notable. The heart rate judged by ECG signals was consistent with the heart rate presented in Figure 3, which was recorded by specialized electronic devices.
4.4.3 Graded Load and Unload Test
The initial heart rate at the beginning of the test was 79 BPM, higher than the initial heart rate in the previous two tests (54 BPM in the first test and 71 BPM in the second test). Continuous exercise had a enduring effect on the heart output. The heart rate continued to rise even after the peak intensity of exercise had been reached. The peak heart rate was achieved when exercise had been completely stopped. Because the subject performed 14 minutes of exercise, 6 minutes longer than the previous two tests, the peak heart rate reached 140 BPM, 40% higher than in the constant test and 16% higher than in the graded load test. The heart rate rose sharply in the first 2 minutes of exercise, from 79 BPM to 114 BPM; then it gradually rose to the peak of 140 BPM. The heart rate dropped from the peak to its initial level within 4 minutes of recovery.
The diastolic pressure increased with the increase of exercise intensity. The pressure reached its peak value (145 mmHg) at the time of maximum exercise intensity (the 8th minute), then began to drop even though the heart rate was still rising in the case of reduced exercise. In light of the difference between the peak time of heart rate and the peak time of blood pressure, the blood pressure may reflect the instant state of the human body, whereas the heart rate takes a longer to time to adapt to the body’s physical need.
The systolic pressure largely stays around 80 mmHg throughout the test. It was not affected by the change of physical demand of the body.
4.4.4 Conclusion
In summary, the heart rate and the systolic pressure is proportional to the intensity of exercises. The systolic pressure is closely associated with the instant exercise intensity, whereas the heart rate takes 1-2 minutes to respond to the change in exercise intensity. After exercise, the systolic pressure returns to its original level within a few minutes, whereas the heart rate drops to a level slightly higher than its original level, in a slower rate (approximately 6 minutes). The diastolic pressure appears to be independent of the physical demand of the body.