


SCI Publications
2022


Y. Livnat, D. Maljovec, A. Gyulassy, B. Mouginot, V. Pascucci.
“A Novel Tree Visualization to Guide Interactive Exploration of Multi-dimensional Topological Hierarchies,” Subtitled “arXiv preprint arXiv:2208.06952,” 2022.
Understanding the response of an output variable to multi-dimensional inputs lies at the heart of many data exploration endeavours. Topology-based methods, in particular Morse theory and persistent homology, provide a useful framework for studying this relationship, as phenomena of interest often appear naturally as fundamental features. The Morse-Smale complex captures a wide range of features by partitioning the domain of a scalar function into piecewise monotonic regions, while persistent homology provides a means to study these features at different scales of simplification. Previous works demonstrated how to compute such a representation and its usefulness to gain insight into multi-dimensional data. However, exploration of the multi-scale nature of the data was limited to selecting a single simplification threshold from a plot of region count. In this paper, we present a novel tree visualization that provides a concise overview of the entire hierarchy of topological features. The structure of the tree provides initial insights in terms of the distribution, size, and stability of all partitions. We use regression analysis to fit linear models in each partition, and develop local and relative measures to further assess uniqueness and the importance of each partition, especially with respect parents/children in the feature hierarchy. The expressiveness of the tree visualization becomes apparent when we encode such measures using colors, and the layout allows an unprecedented level of control over feature selection during exploration. For instance, selecting features from multiple scales of the hierarchy enables a more nuanced exploration. Finally, we …
2018
S. Liu, P.T. Bremer, J.J. Thiagarajan, V. Srikumar, B. Wang, Y. Livnat, V. Pascucci.
“Visual Exploration of Semantic Relationships in Neural Word Embeddings,” In IEEE Transactions on Visualization and Computer Graphics, Vol. 24, No. 1, IEEE, pp. 553--562. Jan, 2018.
DOI: 10.1109/tvcg.2017.2745141
Constructing distributed representations for words through neural language models and using the resulting vector spaces for analysis has become a crucial component of natural language processing (NLP). However, despite their widespread application, little is known about the structure and properties of these spaces. To gain insights into the relationship between words, the NLP community has begun to adapt high-dimensional visualization techniques. In particular, researchers commonly use t-distributed stochastic neighbor embeddings (t-SNE) and principal component analysis (PCA) to create two-dimensional embeddings for assessing the overall structure and exploring linear relationships (e.g., word analogies), respectively. Unfortunately, these techniques often produce mediocre or even misleading results and cannot address domain-specific visualization challenges that are crucial for understanding semantic relationships in word embeddings. Here, we introduce new embedding techniques for visualizing semantic and syntactic analogies, and the corresponding tests to determine whether the resulting views capture salient structures. Additionally, we introduce two novel views for a comprehensive study of analogy relationships. Finally, we augment t-SNE embeddings to convey uncertainty information in order to allow a reliable interpretation. Combined, the different views address a number of domain-specific tasks difficult to solve with existing tools.
2017
A. Bhatele, J. Yeom, N. Jain, C. J. Kuhlman, Y. Livnat, K. R. Bisset, L. V. Kale, M. V. Marathe.
“Massively Parallel Simulations of Spread of Infectious Diseases over Realistic Social Networks,” In 2017 17th IEEE/ACM International Symposium on Cluster, Cloud and Grid Computing (CCGRID), May, 2017.
DOI: 10.1109/ccgrid.2017.141
Controlling the spread of infectious diseases in large populations is an important societal challenge. Mathematically, the problem is best captured as a certain class of reaction-diffusion processes (referred to as contagion processes) over appropriate synthesized interaction networks. Agent-based models have been successfully used in the recent past to study such contagion processes. We describe EpiSimdemics, a highly scalable, parallel code written in Charm++ that uses agent-based modeling to simulate disease spreads over large, realistic, co-evolving interaction networks. We present a new parallel implementation of EpiSimdemics that achieves unprecedented strong and weak scaling on different architectures — Blue Waters, Cori and Mira. EpiSimdemics achieves five times greater speedup than the second fastest parallel code in this field. This unprecedented scaling is an important step to support the long term vision of real-time epidemic science. Finally, we demonstrate the capabilities of EpiSimdemics by simulating the spread of influenza over a realistic synthetic social contact network spanning the continental United States (∼280 million nodes and 5.8 billion social contacts).
2013
Y. Livnat, E. Jurrus, A.V. Gundlapalli, P. Gestland.
“The CommonGround visual paradigm for biosurveillance,” In Proceedings of the 2013 IEEE International Conference on Intelligence and Security Informatics (ISI), pp. 352--357. 2013.
ISBN: 978-1-4673-6214-6
DOI: 10.1109/ISI.2013.6578857
Keywords: biosurveillance, visualization, interactive exploration, situational awareness
2012
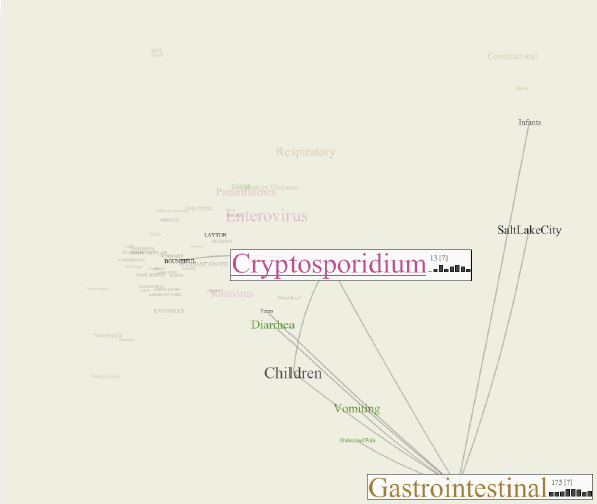
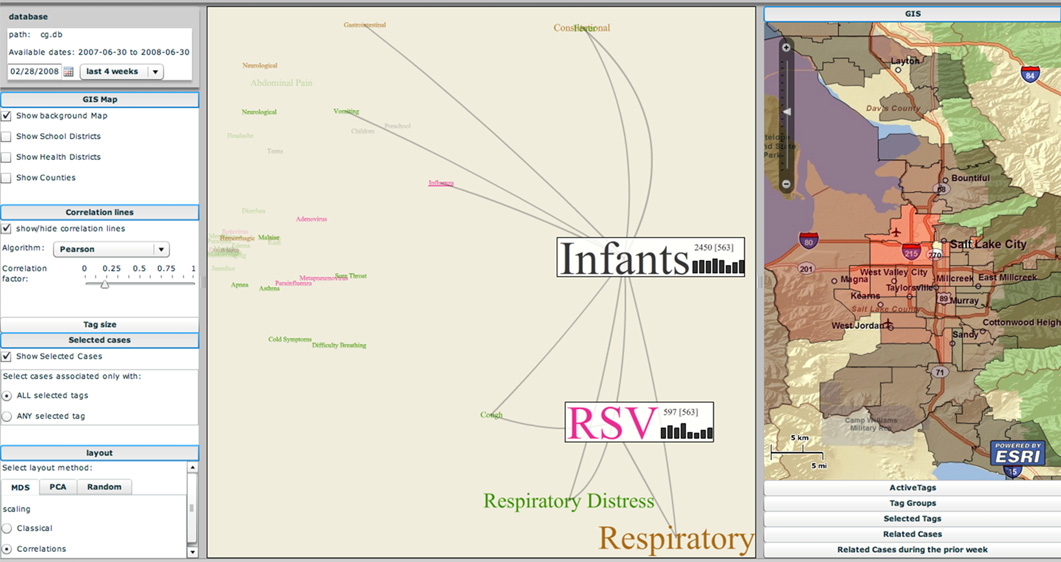
P.H. Gesteland, Y. Livnat, N. Galli, M.H. Samore, A.V. Gundlapalli.
“The EpiCanvas infectious disease weather map: an interactive visual exploration of temporal and spatial correlations,” In J. Amer. Med. Inform. Assoc., Vol. 19, Note: Awarded 1st place for Outstanding Research Article at ISDS 2012 and the Homer R. Warner Award at the AMIA Annual Symposium 2012, pp. 954--959. 2012.
DOI: 10.1136/amiajnl-2011-000486
Y. Livnat, T.-M. Rhyne, M. Samore.
“Epinome: A Visual-Analytics Workbench for Epidemiology Data,” In IEEE Computer Graphics and Applications, Vol. 32, No. 2, pp. 89--95. 2012.
ISSN: 0272-1716
DOI: 10.1109/MCG.2012.31
Effective detection of and response to infectious disease outbreaks depend on the ability to capture and analyze information and on how public health officials respond to this information. Researchers have developed various surveillance systems to automate data collection, analysis, and alert generation, yet the massive amount of collected data often leads to information overload. To improve decision-making in outbreak detection and response, it's important to understand how outbreak investigators seek relevant information. Studying their information-search strategies can provide insight into their cognitive biases and heuristics. Identifying the presence of such biases will enable the development of tools that counter balance them and help users develop alternative scenarios.
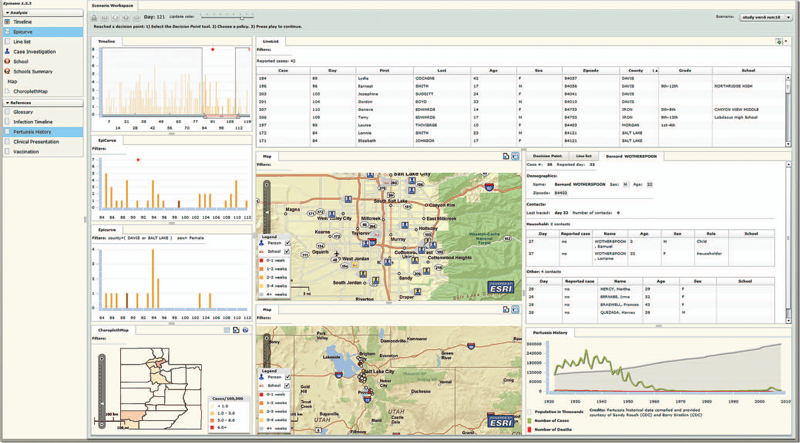
We implemented a large-scale high-fidelity simulation of scripted infectious-disease outbreaks to help us study public health practitioners' information- search strategies. We also developed Epinome, an integrated visual-analytics investigation system. Epinome caters to users' needs by providing a variety of investigation tools. It facilitates user studies by recording which tools they used, when, and how. (See the video demonstration of Epinome at www.sci.utah.edu/gallery2/v/ software/epinome.) Epinome provides a dynamic environment that seamlessly evolves and adapts to user tasks and needs. It introduces four userinteraction paradigms in public health:
• an evolving visual display,
• seamless integration between disparate views,
• loosely coordinated multiple views, and
• direct interaction with data items.
Using Epinome, users can replay simulation scenarios, investigate an unfolding outbreak using a variety of visualization tools, and steer the simulation by implementing different public health policies at predefined decision points. Epinome records user actions, such as tool selection, interactions with each tool, and policy changes, and stores them in a database for postanalysis. A psychology team can then use that information to study users' search strategies.
2010
Y. Livnat, P. Gesteland, J. Benuzillo, W. Pettey, D. Bolton, F. Drews, H. Kramer, M. Samare.
“A Novel Workbench for Epidemic investigation and Analysis of Search Strategies in public health practice,” In Proceedings of AMIA 2010 Annual Symposium, pp. 647--651. 2010.
2008
G. Draper, Y. Livnat, R. Riesenfeld.
“A Visual Query Language for Correlation Discovery and Management,” In Proceedings of Visual and Iconic Language Conference (VaIL 2008), pp. 14--23. 2008.
Y. Livnat, S.G. Parker, C.R. Johnson.
“Fast Isosurface Extraction Methods for Large Image Data Sets,” In Handbook of Medical Image Processing and Analysis, 2nd edition, Ch. 47, Note: (to appear), Edited by Isaac N. Bankman, Elsevier, pp. 801--816. 2008.
2007
Y. Livnat, S.G. Parker, C.R. Johnson.
“Fast Isosurface Extraction Methods for Large Image Data Sets,” In Handbook of Medical Imaging: Processing and Analysis, 2nd Edition, Ch. 44, Edited by Isaac Bankman, Academic Press, 2007.
2005
Y. Livnat.
“Accelerated Isosurface Extraction Approaches,” In The Visualization Handbook, Edited by C.D. Hansen and C.R. Johnson, Elsevier, pp. 39--55. 2005.
ISBN: 0-12-387582-X
Y. Livnat, J. Agutter, S. Moon, R.F. Erbacher, S. Foresti.
“A Visualization Paradigm for Network Intrusion Detection,” In IEEE Workshop on Information Assurance and Security 2005, pp. 30--37. June, 2005.
Y. Livnat, J. Agutter, S. Moon, S. Foresti.
“Visual Correlation for Situational Awareness,” In Proceedings of The 2005 IEEE Symposium on Information Visualization, pp. 13. October, 2005.
Y. Livnat, X. Tricoche.
“Shadows for Incomplete Point-based Isosurfaces,” SCI Institute Technical Report, No. UUSCI-2005-001, University of Utah, 2005.
2004
Y. Livnat, X. Tricoche.
“Interactive Point Based Isosurface Extraction,” In Proceeding of IEEE Visualization 2004, pp. 457--464. 2004.
2003
Y. Livnat, C.D. Hansen.
“Dynamic View Dependent Isosurface Extraction,” SCI Institute Technical Report, No. UUSCI-2003-004, University of Utah, 2003.
2002
Y. Livnat, X. Cavin, C.D. Hansen.
“PHASE: Progressive Hardware Assisted IsoSurface Extraction Framework,” SCI Institute Technical Report, No. UUSCI-2002-001, University of Utah, 2002.
2001
C.R. Johnson, D. Brederson, C.D. Hansen, M. Ikits, G. Kindlmann, Y. Livnat, S.G. Parker, D.M. Weinstein, R.T. Whitaker.
“Computational Field Visualization,” In Computer Graphics, Vol. 35, No. 4, pp. 5--9. 2001.


C.R. Johnson, Y. Livnat, L. Zhukov, D. Hart, G. Kindlmann.
“Computational Field Visualization,” In Mathematics Unlimited -- 2001 and Beyond, Vol. 2, Edited by B. Engquist and W. Schmid, Springer-Verlag, pp. 605--630. 2001.
Y. Livnat, C.D. Hansen, S.G. Parker, C.R. Johnson.
“Isosurface extraction for large-scale datasets,” In Proceedings of Scientific Visualization -Dagstuhl`2000, Edited by F. Post, 2001.