New! Data Challenge: Visualizing the Cosmic Web
Data challenge introduction and motivation
The standard model of cosmology posits that the Universe is dominated by unknown forms of dark matter and dark energy. In order to test this extraordinary scenario, we require precise, theoretical predictions for how such a Universe would appear when observed. One of our most powerful tools to do so are cosmological, hydrodynamical simulations. These are "Universes in a box" -- large numerical calculations which seek to simulate a large volume of a synthetic Universe. Starting from initial conditions shortly after the Big Bang, they solve mathematical models for the coupled evolution of dark matter, gas, stars, and black holes within an expanding space-time, for the 14 billion years of time until the present day. Within these virtual Universes, astrophysical processes lead to the formation and evolution of galaxies as well as the "cosmic web" of large-scale structure.
IllustrisTNG is a suite of several cosmological simulations. It provides catalogs of simulated galaxies: their positions in 3D space, together with dozens of additional properties, such as their mass, shape, size, gas contents, star formation activity, and so on. The positions of galaxies (or, of matter itself) can be used to construct a model for the cosmic web, made up of different structures: voids, sheets, and filaments. Many properties of galaxies are thought to be intricately linked to their position and relationship to this cosmic web, but these links are not well understood.
Our data challenge to visualize this cosmic web and its relationship to the embedded galaxies.
Novel visualizations of the relationship between galaxies and the cosmic web they are embedded within can lead to new insights on the physical processes which shape galaxies across cosmic time. For inspiration, specific concrete examples could include: do galaxies "know" about their place in the cosmic web? Does the "color" of a galaxy depend on its distance to the nearest sheet, void, or node of the web? For spiral, disk-shaped galaxies, is the direction of their rotation aligned with the direction(s) of nearby filaments?
Data
All the data is available at https://www.tng-project.org/data/ (requires making an account).
Use snapshot 99 under TNG100-1 which is redshift zero (present day).
One can follow the short “Example Scripts” tutorial on that same webpage to get familiar with how the catalog is structured, how to load it, etc.
For questions regarding the dataset itself, please contact Dylan Nelson (dnelson AT mpa-garching.mpg.de).
For questions regarding the data challenge, please contact Lauren Anderson (landerson AT carnegiescience.edu)
Submission Guidelines
Your submission should include:
- A PDF report (up to 4 pages, not counting references) describing your visualization and analysis techniques. Please focus on your techniques and results.
- Addition images which accompany and enhance the report (optional). The images should be appended to the report.
- Supplementary videos (MPEG, AVI, or Quicktime; at most 10 minutes) that demonstrate the visualization process and/or the effectiveness of your visualization results (optional).
Submissions of solution to the Data Challenge can be done by sharing the solution with Lauren Anderson (landerson AT carnegiescience.edu) via Google Drive (or similar file storage service). Submission that is less than 20 MB may be emailed directly.
The submission deadline is Oct 19, 2020
The submissions will be reviewed by the organizers and discussed during the workshop. The organizers might contact the authors for additional information and feedbacks.
Results
Congratulations to Joseph N. Burchett, David Abramov, Oskar Elek, and Angus G. Forbes for winning the data challenge!
Award Certificate: Visualization in Astrophysics: Data Challenge Certificate
Winning submission:
Overview
The Workshop: Goals, Scope, and Focus
Astrophysics has been a primary beneficiary of Moore’s law. Advances in computational infrastruc- ture have enabled both our capacity to record increasing amounts of information for an increasingly large number of objects in the universe, and our ability to numerically predict the full evolutionary history of the universe.
Although we have benefited from these advances, we have not fully utilized these rich data sources, and we observe an even greater disparity in our future. Certainly, we have made major discoveries with these datasets, and our theoretical predictions are the most sophisticated the field has ever seen. However, with the next generation of advanced computations and surveys, we find ourselves face-to-face with a “digital tsunami” of both simulated and observed data. It is clear that our 20th century interrogation techniques will be insufficient for the task at hand. The data is too large and rich to be simplified to basic equations and summary statistics – the classical way we test our predictions, or to be visualized naively without careful consideration of its scale.
Generously, the same revolution that gave us this great wealth of data can also provide the solution. Far from a fantasy of the future, modern computational power is enabling us to visualize and analyze the complex data sets we are predicting and observing. We just need to bring these modern visual and analysis techniques to these rich datasets; we need to bring together experts from both visualization and astronomy.
Why Now?
Until relatively recently, we have been using traditional analytic and statistical methods to analyze the astronomy datasets. Typically the data were sufficiently simple that these techniques were adequate; this is no longer the case. For example, we now have very large quantities of high- dimensionality data, and by applying the same, old techniques to this data we are, necessarily, losing information. This information is hard-earned, either from years of surveying the sky or millions of hours of CPU computation time. In order to make the best use of this data, we must focus on novel methods of analysis and visualization.
Goals and Scope
With this workshop, we aim to bring together members of the astronomical community and members of the visualization community with the goals of discussing:
- Datasets in astronomy in need of new approaches and methodologies – an opportunity for data-hungry visualization experts to apply visualization techniques to new datasets;
- Visualization techniques that have not been applied to astronomical datasets – an opportunity for astronomers to revolutionize their scientific work flow;
- Visualization techniques that can enhance the educational value of scientific datasets, making astronomical research results readily transferable to large public audiences, in partnership with Hayden Planetarium and California Academy of Sciences experts.
Focus
The focus of this workshop is to build connections and collaborations between these two communities: data-rich, but technique-starved astronomers, and data-hungry and technique-rich visualization experts. These connections are ripe with low hanging fruits, which can be discussed and worked on during a single day workshop. To facilitate a common language and collaborations, we will present visualization min-challenges with a well-curated astronomy dataset on the workshop website 6 months prior to the workshop. For more challenging problems/datasets, the workshop serves as a forum to establish the initial collaborations. It helps visualization researchers to understand astronomy datasets, and it offers astronomers an opportunity to understand existing visualization techniques and tools.
Co-organizer L. Anderson has precisely a dataset and visualization mini-challenge appropriate to this goal. We will also solicit other data challenges from throughout the astronomical community for interested individuals. We anticipate that the solution to these data challenges will be published in the astronomical and perhaps visualization literature but will be publicly accessible through arXiv. We are confident that the very specific mini-challenge will serve to rapidly focus both groups on existing problems (rather than purely esoteric and/or theoretical grounds) and thus begin a larger cross-community dialog.
Confirmed Keynote Speakers
Alyssa Goodman, Department of Astronomy, Harvard University
Alexander Bock, Linköping University and University of Utah, Development Lead for the OpenSpace project
Confirmed Invited Speakers
Jackie Faherty, American Museum of Natural History
Matthew J Turk, Department of Astronomy, University of Illinois at Urbana-Champaign
Michelle Borkin, Khoury College of Computer Sciences, Northeastern University
Angus Forbes, Computational Media Department, University of California, Santa Cruz
Joseph N. Burchett, Department of Astronomy, New Mexico State University
Format
The workshop will be a half-day event.
Participants and Intended Audience
The workshop targets both visualization researchers and astronomers.
We welcome participation from both the astronomy and visualization communities. We expect a reasonable presence of astronomers at the workshop given the large presence of astronomers at local universities. And given the dearth of visualization techniques currently available to the astronomical community, we also think this workshop, and it’s hands-on approach, will peak the interest of many non-local astronomers as well. The VIS 2020 conference ensures a quorum of visualization experts.
Abstracts
The Past, Present and Future of Visualization in Astronomy
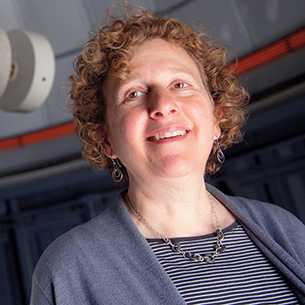
Alyssa Goodman
Abstract:
Astronomers have been visually representing their ideas and observations throughout human history. Today, astronomers' visualization challenges extend to some of the largest, most diverse, and high-dimensional data sets in science, and their largely open-source tools are being optimized to accelerate the pace of discovery. In this talk, I will begin with a very short history of astronomy visualization, highlighting the work of Ptolemy and Galileo. Then, I’ll focus on how tools and libraries used by today’s astronomers (including astropy, WorldWide Telescope, yt, glue, OpenSpace, the Jupyter ecosystem, and more) are evolving into a flexible, modular, system of systems that allows experts and novices alike to carry out exploratory and explanatory data visualization. I will conclude with thoughts on the future, with particular focus on how new generations of astronomers may be trained to think about data science, visualization, astrophysics, education, and outreach simultaneously, using systems flexible enough to facilitate a seamless spectrum connecting basic education to cutting-edge research.
Speaker Bio:
Alyssa Goodman is the Robert Wheeler Willson Professor of Applied Astronomy at Harvard University, co-Director for Science at the Radcliffe Institute for Advanced Study, and a Research Associate of the Smithsonian Institution. Goodman's research and teaching interests span astronomy, data visualization, and online systems for research and education. Goodman received her undergraduate degree in Physics from MIT in 1984 and a Ph.D. in Physics from Harvard in 1989. Goodman was awarded the Newton Lacy Pierce Prize from the American Astronomical Society in 1997, became full professor at Harvard in 1999, was named a Fellow of the American Association for the Advancement of Science in 2009, and chosen as Scientist of the Year by the Harvard Foundation in 2015. Goodman has served as Chair of the Astronomy Section of the American Association for the Advancement of Science and on the National Academy's Board on Research Data and Information, and she currently serves on the both the IAU and AAS Working Groups on Astroinformatics and Astrostatistics.
Goodman's personal research presently focuses primarily on new ways to visualize and analyze the tremendous data volumes created by large and/or diverse astronomical surveys, and on improving our understanding of the structure of the Milky Way Galaxy. She is the PI of the NSF and NASA-sponsored glue software effort, which creates new tools for high-dimensional data visualization across science and education. She also works closely with colleagues at the American Astronomical Society and Harvard to expand the use of the WorldWide Telescope Universe Information System, in both research and education. Goodman leads the Prediction project at Harvard University, focused on tracing back the roots of modern computer simulation, as prediction, through history, all the way back to the sheep entrail divination practiced in Mesopotamia.
Bridging the Gap: Bringing Expert Tools into Planetariums and Living Rooms
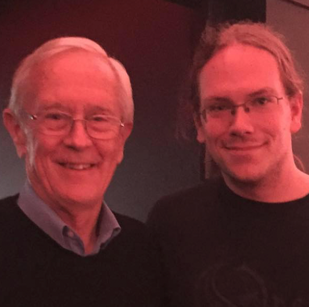
Alexander Bock
Abstract:
We are living in a world in which our understanding of the cosmos is driven primarily by data, both acquired through telescopes as well as simulations. The bottleneck for disseminating this wealth of information is usually the ability for the interested general public to start exploring the data by themselves in a guided fashion. Thus far, there have been gaps between tools that the public can use to explore the universe and the tools used by scientists to discovery new phenomena. In this talk, I will present our ongoing work on the software platform OpenSpace, which is an open-source software that aims to close this gap by enabling the use of the same software platform for scientists, presenters in a planetarium, and the general public on their home computer. Using the same software in these diverse usage cases makes it possible to shorten the distance between scientific discoveries and the dissemination of it.
Speaker Bio:
Alexander Bock has received his PhD in Visualization and Interaction from Linköping University, Sweden for his work on designing visualization applications tailored for both scientific discoveries and use for the general public. He is currently a Research Fellow at Linköping University and the University of Utah. Prior to this, he has been a Moore-Sloan Data Science Fellow at New York University and a visiting Research Scholar with the Community Coordinated Modeling Center at NASA's Goddard Space Flight Center, USA in 2015. Aside from conducing scientific visualization research, he is also the Development Lead on the open-source Astrovisualization software OpenSpace, developed in collaboration between Linköping University, the American Museum of Natural History, NASA, New York University, and the University of Utah. Bock was awarded 2014 and 2015 with the Best Scientific Visualization poster and 2017 with the Best Scientific Visualization paper awards at the IEEE Visualization conference for his work in the field of Astrovisualization.
Visualizing the Dynamic Milky Way for Science and Education
Jacqueline Faherty

Abstract:
The European space agency's second catalog of the Gaia mission is revolutionizing astronomy. Arguably all scientific questions can benefit from the nearly 1.4 billion parallaxes and proper motions, over 7 million radial velocities, photometric data in Gaia’s three bands (G, R, and B), variability information, and effective temperatures for a subset of objects. The Gaia results provide a unique opportunity for astronomers, data visualizers, and educators. Stellar positions and velocities enable us to map the Milky Way and examine the dynamics of stellar streams, co-moving companions, hypervelocity stars, nearby moving groups, and solar system encounters. From a visualization perspective, real time rendering of Gaia data is a challenge. In this presentation, I will show the results of our visualization efforts with the Gaia catalog at the American Museum of Natural History. The visuals generated for this talk isolate scientifically rich data and stories, which can lead to scientific discovery and will illuminate Gaia data for students, teachers and the general public.
Speaker Bio:
Dr. Jackie Faherty received her bachelors degree in Physics from the University of Notre Dame and her PhD in Physics
from Stony Brook University. Post PhD, she spent two years at the Universidad de Chile on a National Science Foundation International Research Fellowship (NSF-IRFP) and three years at the Carnegie Institution for Science on a NASA Hubble Fellowship. She
is now a permanent scientific staff member jointly in the department of Astrophysics and the department of Education at the American Museum of Natural History (AMNH). Dr. Faherty co-runs a dynamic research group at AMNH entitled Brown Dwarfs in New York City
(BDNYC). Her team has won multiple grants from NASA, NSF, and the Heising Simons foundation to support projects focused on characterizing planet-like objects. She has also co-founded the popular citizen science project entitled Backyard Worlds: Planet 9
which invites the general public to help scan the solar neighborhood for previously missed cold worlds. Faherty has over 90 peer reviewed articles in Astrophysical journals, has been an invited speaker at University’s and conferences across the globe and is
a major advocate for utilizing visualization tools for both science and education advancements. Aside from a love of scientific research, Dr. Faherty is a passionate educator and can often be found giving public lectures in the Hayden Planetarium. She holds
a unique position at the American Museum of Natural History that allows her to pursue scientific research at the forefront of exoplanet characterization studies while mentoring and advising education programs for students and general public alike.
A Grammar of Analysis for Volumetric Astrophysical Data
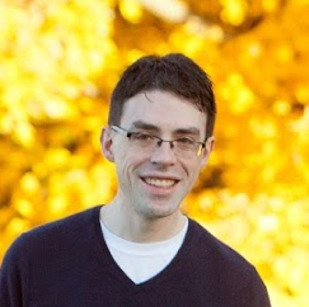
Matthew Turk
Abstract:
Analyzing complex, multi-source, multi-format and multi-modal data from astrophysical simulations, observations and theory requires methods for transforming raw numbers into manipulable quantities, and the application of high-level semantic models on top of those quantities. In this talk I will present methods for defining and applying a grammar of analysis to volumetric astrophysical data, and describe the implications this has for visualization, analysis and inference in astrophysics.
Speaker Bio:
Matthew Turk is an assistant professor in the School of Information Sciences at the University of Illinois Urbana-Champaign and also holds an appointment with the Department of Astronomy in the College of Liberal Arts and Sciences. His research is focused on how individuals interact with data and how that data is processed and understood. He received his doctoral degree in physics from Stanford University in 2009. He completed postdoctoral work at the University of California at San Diego and an NSF Fellowship in Transformative Computational Science at Columbia University. He came to Illinois in 2014 to work as a research scientist at the National Center for Supercomputing Applications and as a research assistant professor in the Department of Astronomy.
Bridging Domains and Dimensions with glue
Michelle Borkin

Abstract:
In this talk I will share personal experiences and reflections on opportunities for visualization in astrophysics and beyond through the lens of my personal journey from the fields of astrophysics to visualization and back. As part of my talk I will feature my current astrophysics visualization work and collaborations, in particular the glue multi-dimensional linked-data exploration software (https://glueviz.org/). Glue is an open-source Python library to explore relationships within and between related datasets and was originally developed for astronomy to facilitate data analysis and visualization for NASA's James Webb Space Telescope. Glue continues to grow to bridge domains and data dimensions in support of effective data analysis and visualization.
Speaker Bio:
Michelle Borkin is an Assistant Professor in the Khoury College of Computer Sciences, Northeastern University. Her research focuses on the development of novel visualization techniques and tools to enable new insights and discoveries in data. Her research spans visualization and human-computer interaction with interests across disciplines including medical imaging, network visualization, perception and cognition, accessibility, and astronomy and physics. She is the visualization research lead and an original project member of the NSF and NASA-sponsored glue multi-dimensional linked-data exploration software.
Michelle received a Ph.D. in 2014 and an M.S. in 2011, both in Applied Physics, and a B.A. in Astronomy and Astrophysics & Physics from Harvard University. Prior to joining Northeastern, Borkin was a postdoctoral research fellow in computer science at the University of British Columbia and a research fellow at Brigham & Women’s Hospital. She was previously a National Science Foundation graduate research fellow, a National Defense Science and Engineering graduate fellow, and a TED fellow.
Visualizing Extragalactic Ecosystems
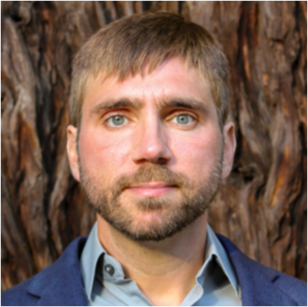
Joseph N. Burchett and Angus G. Forbes

Abstract:
We present results from a series of projects developed collaboratively over the last two years by a team of interdisciplinary researchers at University of California, Santa Cruz, which includes experts in visual analytics, simulation, data sonification, and astrophysics. These projects investigate the intergalactic medium (IGM) and circumgalactic medium (CGM) in context with the galaxies residing within, representing the inherently multi-dimensional datasets using novel interactive visualization techniques: IGM-Vis is a web-based spectroscopic analysis tool for the intergalactic medium; Polyphorm is an interactive visualization tool that enables inferring Cosmic Web structure using a novel method based on the foraging behavior of slime mold; CosmoVis is a web-based tool for analyzing large cosmological simulations. In addition to presenting details about these projects and describing the scientific results they have produced, we discuss effective collaboration strategies and outline future research tasks enabled by our visualization approaches.
Speaker Bio for Joseph N. Burchett:
Dr. Joseph N. Burchett is an Assistant Professor of Astronomy at New Mexico State University. An observational astronomer, Joe studies the evolution of galaxies and the most massive structures in the Universe with an emphasis on the gas in and around these objects. In addition to using traditional astronomical techniques, he embraces novel interdisciplinary approaches such as creative data visualization and sonification. He earned his Ph.D. in Astronomy at the University of Massachusetts Amherst and then went on to University of California, Santa Cruz as a postdoctoral fellow before joining NMSU this Fall.
http://www.joeburchett.com/
Speaker Bio for Angus G. Forbes:
Dr. Angus G. Forbes is an Associate Professor at University of California, Santa Cruz, where he directs the Creative Coding Lab within the Department of Computational Media. Angus’ research investigates novel techniques for visualizing and interacting with complex scientific information. He was the Arts Papers chair for ACM SIGGRAPH in 2018 and will serve as the ACM SIGGRAPH Art Gallery chair in 2021. He currently serves on the IEEE VIS InfoVis Program Committee and he chaired the IEEE VIS Arts Program (VISAP) from 2013 to 2017. https://creativecoding.soe.ucsc.edu/


