
Students, faculty and staff from the Scientific Computing and Imaging (SCI) Institute at the University of Utah have long played a vital role in shaping IEEE VIS, the top conference for visualization and visual analytics, and their contributions continue to stand out this year. SCI’s VIS 2025 presence includes seven main program papers—among them a best paper award and an honorable mention—as well as a prestigious Test of Time award. SCI researchers are also leading various sessions and presenting eleven workshop papers, two of which won awards.
SCI’s delegation will travel to Vienna, Austria, during the first week of November to share their work and collaborate with other experts from around the world.
Best Paper Award for the reVISit Team
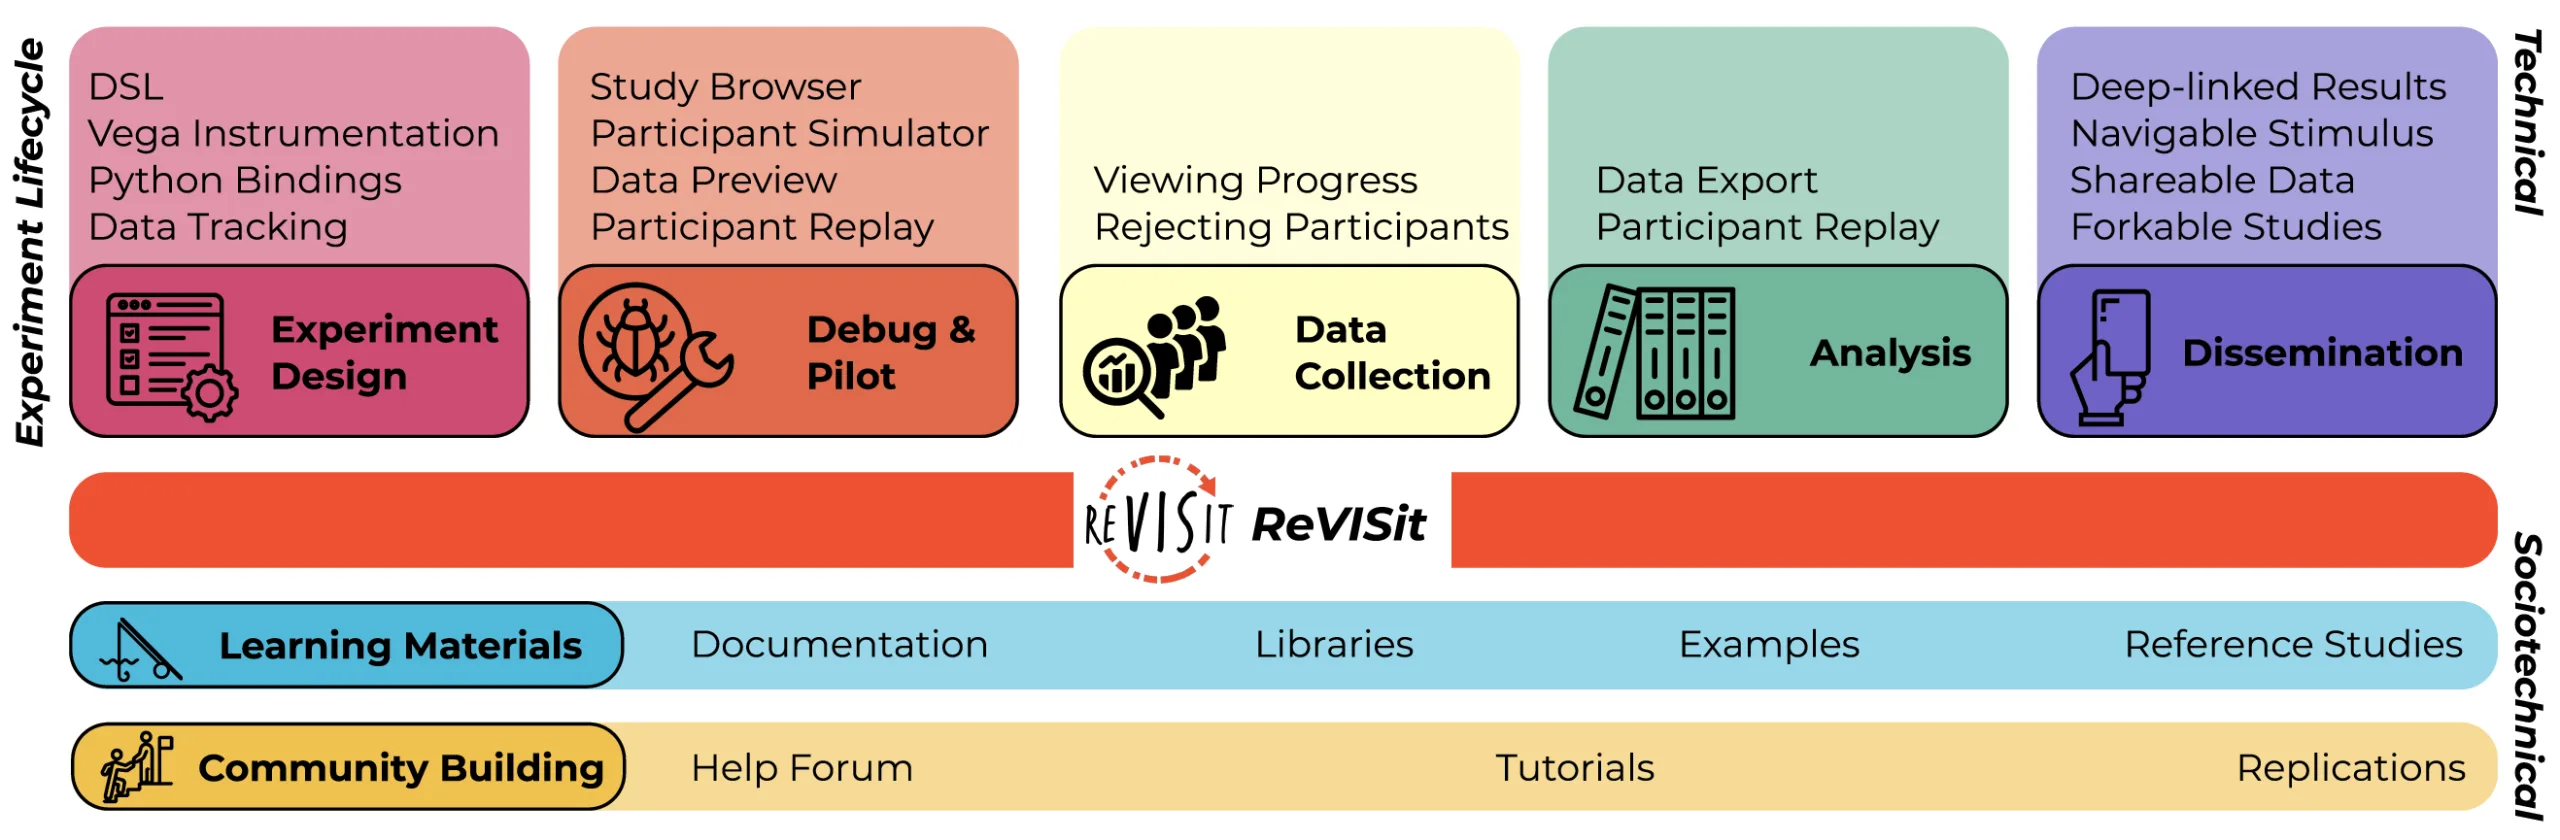
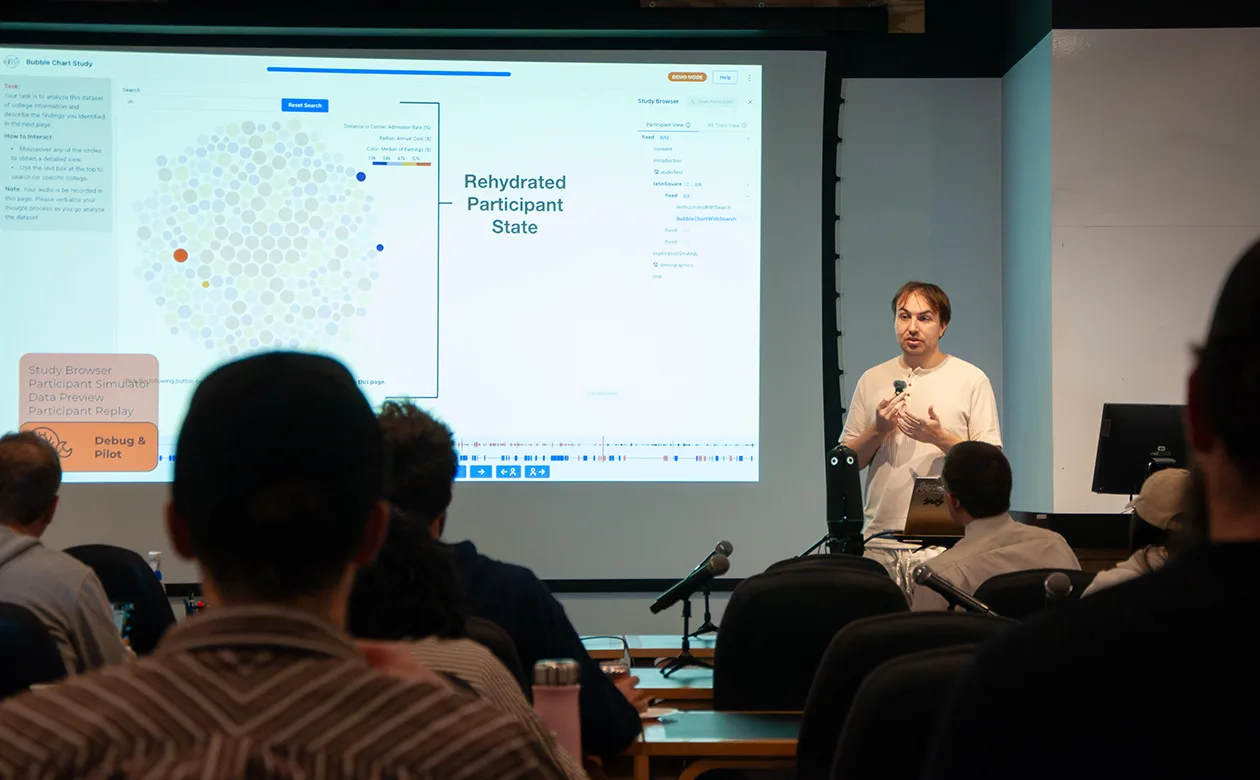
Immediately above: A look at how reVISit 2 supports each stage of the online user study lifecycle. Banner image: Lead author Zachary Cutler presents the paper during a VIS practice talk at SCI on October 22.
The team behind reVISit—a 2024-launched open-source platform that allows researchers to observe how users engage with online visualizations—won a best paper award for “ReVISit 2: A Full Experiment Life Cycle User Study Framework.” This year, VIS received 537 paper submissions for full papers and conditionally accepted 131 of them, amounting to an acceptance rate of 24.4%. From that pool, only five earned best paper awards—a top-1% honor.
Lead author Zachary Cutler, a third-year PhD student at SCI, called the award an “incredible honor” and credited the greater reVISit team for their many contributions. Co-authors include Cutler’s two advisors: SCI faculty member Andrew McNutt and SCI adjunct faculty member Alexander Lex, co–principal investigator for reVISit. (After 10 years at SCI, Lex recently returned to Austria as a faculty member at his alma mater, Graz University of Technology but remains affiliated with the SCI institute.)
Cutler started working on reVISit’s predecessor around 2020 as a Kahlert School of Computing BS/MS student advised by Lex. “Seeing it grow and become something we are proud of using and sharing with the community has been awesome,” Cutler said of reVISit.
“Although reVISit has been available for a while now, this paper really announces that this is a usable, proven tool capable of carrying out complex studies,” he explained. “We have seen some adoption in the community, which is super exciting, including two other papers at VIS that used reVISit in their work. But still, we hope this paper helps us get more adoption and feedback from the vis community.”
Cutler looks forward to spreading the word in Austria, where he lived and worked for two years after earning his MS/BS and before pursuing his PhD. “For me personally, VIS in Vienna is also a mini-homecoming,” he said. “I’m very excited about presenting this work in Austria.”
Read the award committee’s evaluation of the paper:
“This paper presents the latest incarnation of the reVisit tool, a tool for making user studies more approachable and scientifically sound. It includes many components valuable to the community that can be expected to be widely used, essentially providing a service to the visualization community. It may lead to user studies that are easier to access, more streamlined, and better reproducible. The authors provide an elegant framework, a nice implementation, and comprehensive documentation, as well as a website and open-source repositories with interactive demos. This research will give visualization user studies more visibility by reducing the burden of open-source study design, materials, and results.”
Test of Time Award
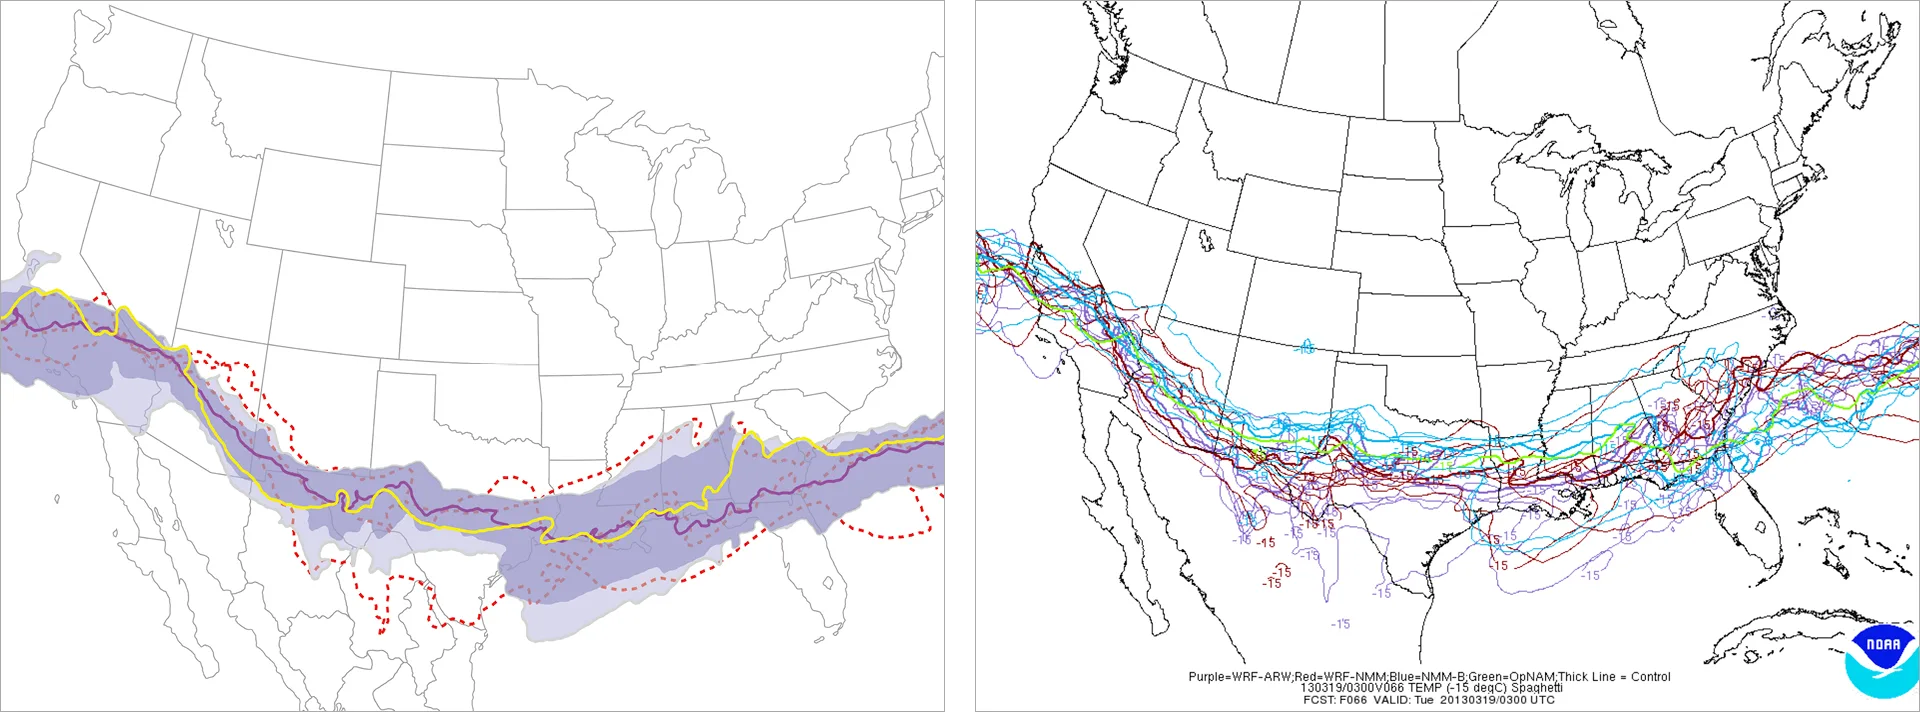
The award-winning paper documents a set of experiments that used weather forecast data publicly available from the National Oceanic and Atmospheric Administration (NOAA). From left to right, contour boxplots of areas with -15°C temperatures at mid-atmosphere level, and spaghetti plots provided by NOAA for the same forecast hour. From the paper: “Currently, one of the main tools available to domain experts to interpret weather forecast ensembles is the spaghetti plots of isocontours provided by NOAA…. Using spaghetti plots, the variability is usually inferred as the extent to which the set of lines is spread out and how the patterns change through time. Using contour boxplots, one can quantitatively show the variability of the ensemble members.”
SCI emeritus faculty member Ross Whitaker, faculty member Mike Kirby, and former postdoctoral fellow Mahsa Mirzargar earned a prestigious 12-Year SciVis Test of Time Award for “Contour Boxplots: A Method for Characterizing Uncertainty in Feature Sets from Simulation Ensembles.”
Test of Time Awards recognize previously published VIS articles that “are still vibrant and useful today and have had a major impact and influence within and beyond the visualization community.”
Read the award committee’s impact statement on the 2013 paper:
“The paper introduced a groundbreaking statistical and visualization framework for analyzing ensembles of contours—generalizing functional boxplots to non-scalar, shape-based data. By extending the concept of data depth to sets, the authors enabled robust statistical aggregation and uncertainty quantification for complex features beyond simple scalar fields. This work bridged uncertainty visualization and statistical shape analysis, influencing diverse domains from fluid dynamics to weather forecasting. Its impact endures, inspiring numerous follow-up techniques, including Curve Boxplots, and shaping how the community approaches statistical analysis and visualization of geometric and topological features in simulation science. The paper has since been widely cited, underscoring its lasting relevance and influence.”
Honorable Mention Award
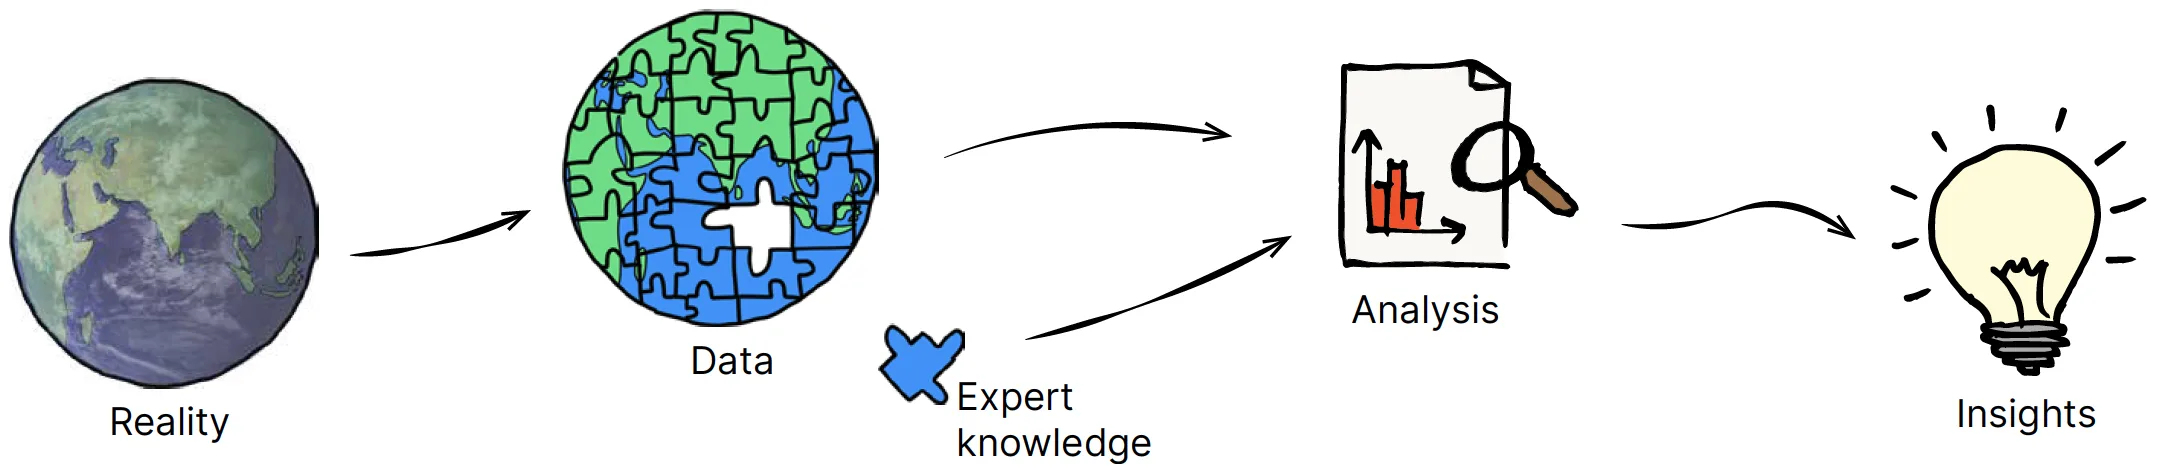
The paper’s visual overview of the role of expert knowledge in data analysis workflows.
A team led by SCI alumna Haihan Lin PhD ’23 secured one of 12 honorable mention awards for “Here’s What You Need to Know About My Data: Exploring Expert Knowledge’s Role in Data.” The research team consists of SCI alumni, former faculty, or both. Of the 537 full papers submitted to VIS, only about 3% received an honorable mention or best paper award.
Lin—who was advised by paper co-author Alexander Lex, now a SCI adjunct faculty member—explained the team interviewed 14 data analysts from diverse domains to explore how they incorporate expert knowledge into their analytical work. “Our findings show that data alone is not sufficient for sound decision-making—analysts also rely on contextual understanding, awareness of data limitations, and the story behind the numbers to form accurate insights,” Lin said. “These insights highlight the need for tools that better support the capture and integration of expert knowledge within analysts’ existing workflows.”
Lin, currently a software engineer at Lucid Software, said the award was a nice surprise and a great way to round out her academic career. “This paper went through several review cycles and we iterated it each time to improve it,” she said. “It feels like we achieved a good end result.”
SCI’s Vis 2025 Contributions
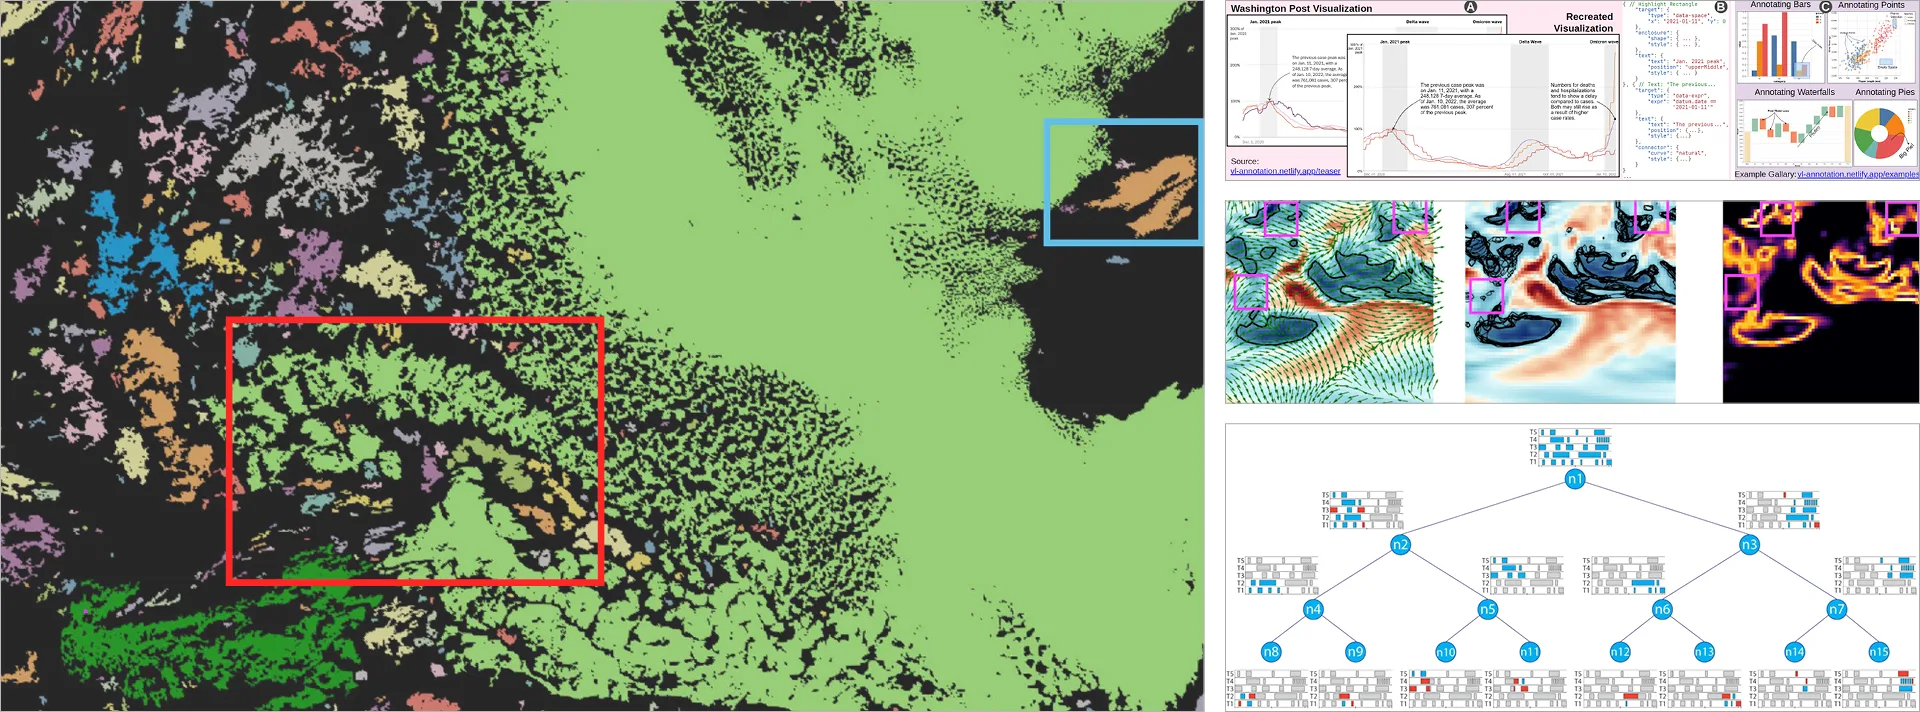
Clockwise from left, images from papers 5.c.i., 1.c., 5.d.i., 5.b.iii.
- Main Program Papers
- BEST PAPER—ReVISit 2: A Full Experiment Life Cycle User Study Framework, by Zach Cutler, Jack Wilburn, Hilson Shrestha, Yiren Ding, Brian Bollen, Khandaker Abrar Nadib, Tingying He, Andrew McNutt, Lane Harrison, & Alexander Lex
- HONORABLE MENTION—Here’s What You Need to Know About My Data: Exploring Expert Knowledge’s Role in Data Analysis, by Haihan Lin, Maxim Lisnic, Derya Akbaba, Miriah Meyer, & Alexander Lex
- AnnoGram: An Annotative Grammar of Graphics Extension, by Md Dilshadur Rahman, Md Rahat-uz- Zaman, Andrew M McNutt, & Paul Rosen
- Bridging Network Science and Vision Science: Mapping Perceptual Mechanisms to Network Visualization Tasks, by S. Sandra Bae, Kyle Cave, Carsten Görg, Paul Rosen, Danielle Albers Szafir, & Cindy Xiong Bearfield
- Flexible and Probabilistic Topology Tracking with Partial Optimal Transport, by Mingzhe Li, Xinyuan Yan, Lin Yan, Tom Needham, & Bei Wang
- TFZ: Topology-Preserving Compression of 2D Symmetric and Asymmetric Second-Order Tensor Fields, by Nathaniel Gorski, Xin Liang, Hanqi Guo, & Bei Wang
- Using Tactile Charts to Support Comprehension and Learning of Complex Visualizations for Blind and Low-Vision Individuals, by Tingying He, Maggie McCracken, Daniel Hajas, Sarah Creem-Regehr, & Alexander Lex
- Panel
- IEEE VIS Reviewing—On a Path to Self-Destruction? by Petra Isenberg, Gunther H. Weber, Niklas Elmqvist, and Narges Mahyar. Panelists: Han-Wei Shen, Michael Sedlmair, Melanie Tory, Helwig Hauser, Bei Wang, Tamara Munzner.
- Tutorial
- Running Online User Studies with the reVISit Framework, by Jack Wilburn, Hilson Shrestha, Zach Cutler, Yiren Ding, Tingying He, Andrew M McNutt, Lane Harrison, Alexander Lex
- Workshops
- alt.VIS 2025, Andrew M. McNutt, Søren Knudsen, Alyxander Burns, Connor Scully-Allison, Sara Di Bartolomeo, Victor Schetinger
- Uncertainty Visualization: Unraveling Relationships of Uncertainty, AI, and Decision-Making, Tushar M. Athawale, Chris R. Johnson, Kristi Potter, Paul Rosen, David Pugmire, Antigoni Georgiadou, Tim Gerrits, Nadia Boukhelifa
- VisComm 2025, Alvitta Ottley, Jonathan Schwabish, Paul Parsons, Ali Baigelenov, Md Dilshadur Rahman, Prakash Shukla, Saugat Pandey
- Workshop Papers
- Alt.vis
- Charts and Measures, by Andrew McNutt
- The Feng Shui of Visualization: Design the Path to SUCCESS and GOOD FORTUNE, by Chang Han, Andrew M McNutt
- Large Data Analysis and Visualization (LDAV)
- Extracting Complex Topology from Multivariate Functional Approximation: Contours, Jacobi Sets, and Ridge-Valley Graphs, by Guanqun Ma, David Lenz, Hanqi Guo, Tom Peterka, Bei Wang
- Extremely Scalable Distributed Computation of Contour Trees via Pre-Simplification, by Mingzhe Li, Hamish Carr, Oliver Rübel, Bei Wang, Gunther H. Weber
- HONORABLE MENTION—Managing Data for Scalable and Interactive Event Sequence Visualization, by Sayef Azad Sakin, Katherine E. Isaacs
- Topological Data Analysis and Visualization (TopoInVis)
- Tracking Low-Level Cloud Systems with Topology, by Mingzhe Li, Dwaipayan Chatterjee, Franziska Glassmeier, Fabian Senf, Bei Wang
- Structural Uncertainty Visualization of Morse Complexes for Time-Varying Data Prediction, by Weiran Lyu, Saumya Gupta, Chao Chen, Bei Wang
- GASP: Gradient-Aware Shortest Path Algorithm for Boundary-Confined 3D Reeb Graph Visualization, by Sefat E Rahman, Tushar M. Athawale, Paul Rosen
- Uncertainty Visualization
- BEST SHORT PAPER—Efficient Probabilistic Visualization of Local Divergence of 2D Vector Fields with Independent Gaussian Uncertainty, by Timbwaoga A. J. Ouermi, Eric Li, Kenneth Moreland, David Pugmire, Chris R. Johnson, and Tushar M. Athawale
- Uncertainty Tube Visualization of Particle Trajectories, by Jixian Li, Timbwaoga A. J. Ouermi, Mengjiao Han, and Chris R. Johnson
- Visualization Education, Literacy, and Activities (EduVis)
- Teaching Critical Visualization: A Field Report, by Andrew M McNutt, Shiyi He, Sujit Kumar, Purbid Bambroo, Nastaran Jadidi, John Bovard, Chang Han
- Alt.vis
Related story: SCI’s Strong Showing at IEEE VIS 2024 Includes Top Awards and Organizers


