The purpose of the lab is to learn about measuring the ECG and blood
pressures and observing the effects of exercise on blood pressure, heart
rate, and electrocardiogram (ECG).
This lab will build on the class material we have covered on blood flow and
pressure, cardiac contraction, regulation of heart rate and function, and
the ECG.
To prepare, please review the notes and text on the ECG, the cardiac cycle,
and blood pressure measurements and also read the section in your text (or
any other good physiology book) on exercise.
See the web site
www.ktl.fi/publications/ehrm/product2/part_iii3.htm
for a
description of this measurement.
Arterial blood pressure is measured by a sphygmomanometer. This consists of:
- A rubber bag surrounded by a cuff.
- A manometer (usually a mechanical gauge, sometime electronic,
rarely a mercury column).
- An inflating bulb to elevate the pressure.
- A deflating valve.
Figure 1 below shows how blood pressure is measured.
After the cuff is placed snugly over the arm, the radial artery is palpated
while the pressure is increased until the pulse can no longer be felt, then
30 mm Hg. more. As the pressure is released the artery is palpated until
the pulse is felt again. This palpatory method will detect systolic
pressure only.
Figure 1:
Schematic diagram of arterial blood
pressure measurement by Korotkow sounds.
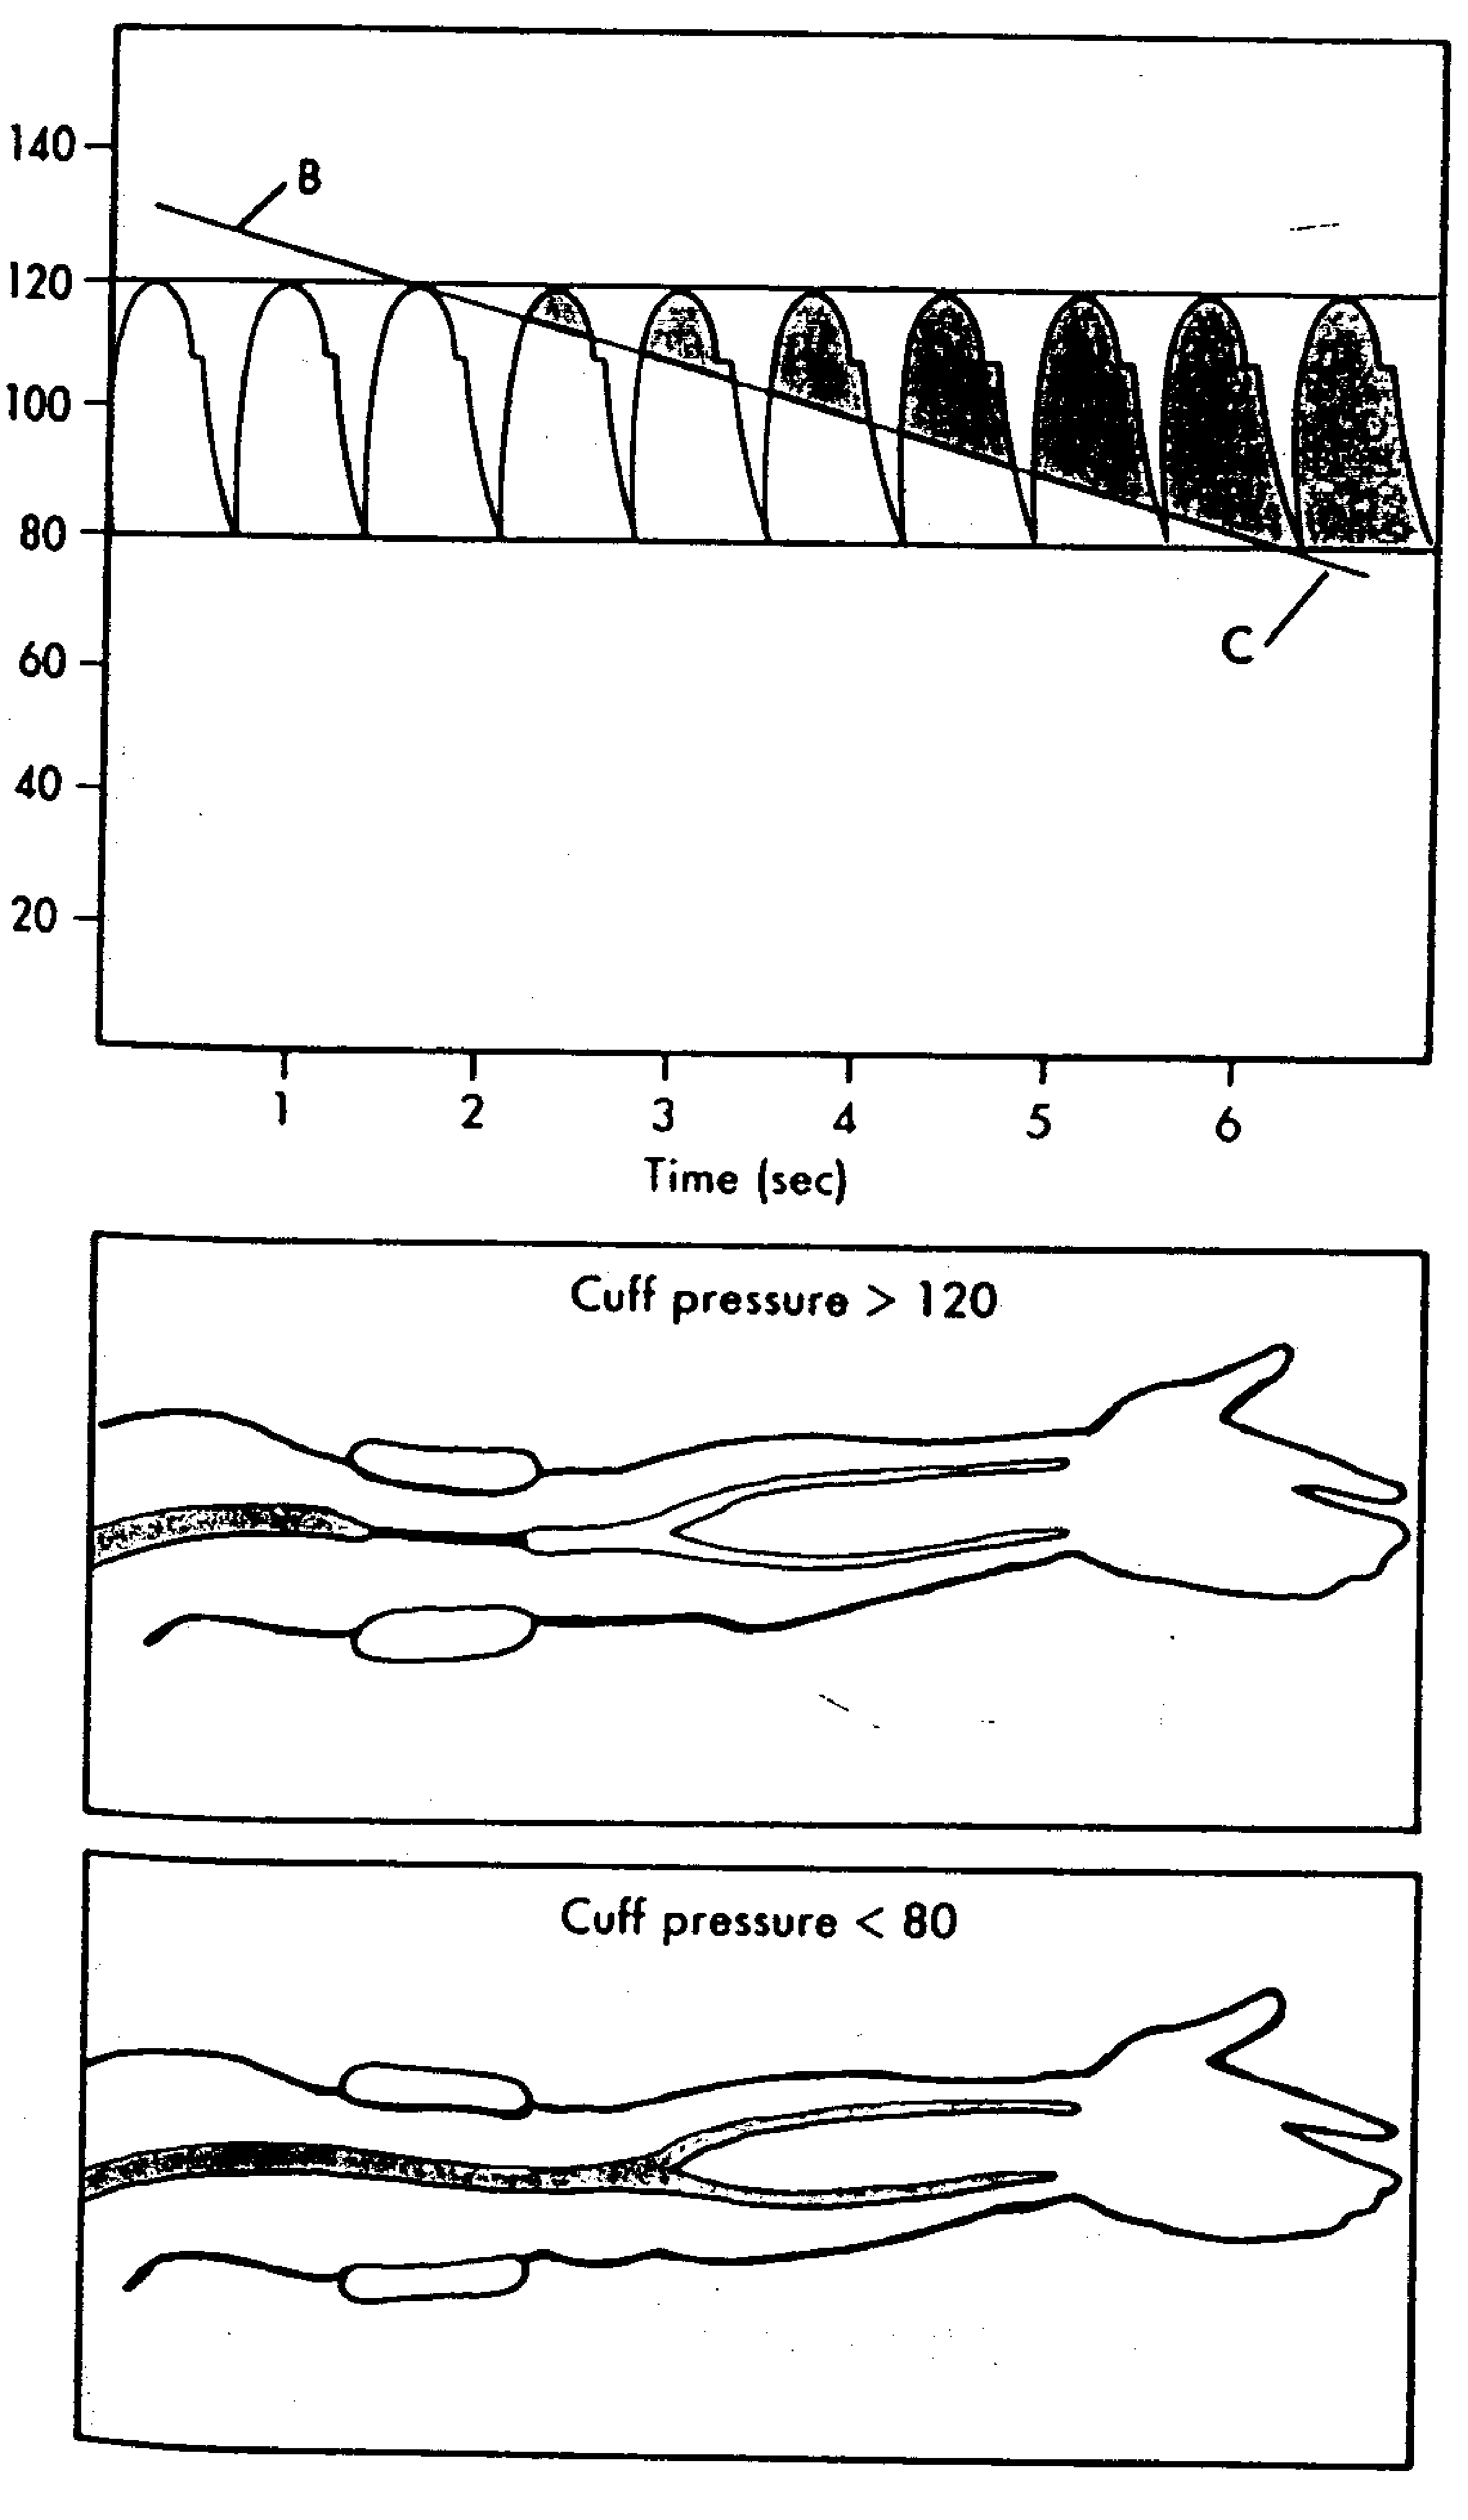 |
The auscultatory method detects diastolic as well as systolic pressure.
The sound heard when a stethoscope bell (or diaphragm) is applied to the
region below the cuff were described by Korotkow in 1905 and are called
Korotkow's sounds.
The artery is compressed by pressure and as the pressure is released the
first sound heard is a sharp thud which becomes first softer and then
louder again. It suddenly becomes muffled and later disappears. Most
people register the first sound as Systolic, the muffled sound as the first
diastolic and the place where it disappears as the second diastolic. It
requires practice to distinguish the first diastolic, so, for our
laboratory, we will record only the first sound (systolic) and the
disappearance of the sound (second diastolic). These will not be difficult
to elicit, and a little practice will enable you to get the same reading on
a fellow student three times in succession.
- Improper positioning of the extremity. Whether the subject is
sitting, standing, or supine, the position of the artery in which
the blood pressure is measured must be at the level of the heart.
However, it is not necessary that the sphygmomanometer be at the
level of the heart.
- Improper deflation of the compression cuff. The pressure in the
cuff should be lowered at about 2 mm Hg per heartbeat. At rates
slower than this venous congestion will develop and the diastolic
reading will be erroneously high. If the cuff is deflated too
quickly the manometer may fall 5 or 10 mm Hg between
successive Korotkow sounds, resulting in erroneously low readings.
- Recording the first Blood Pressure. Spasm of the artery upon
initial compression and the anxiety and apprehension of the subject
can cause the first blood pressure reading to be erroneously high.
After the cuff has been applied, wait a few minutes before
recording the blood pressure. Make several measurements.
Generally the third value recorded is the most basal.
- Improper application of the cuff. If the rubber bladder bulges
beyond its covering, the pressure will have to be excessively high
to compress the arm effectively. If the cuff is applied too
loosely, central ballooning of the rubber bladder will reduce the
effective width, thus creating a narrow cuff. Both bulging and
ballooning result in excessively high readings.
A defective air release valve or porous rubber tubing connections make it
difficult to control the inflation and deflation of the cuff. The
aneroid manometer gauge tube should be clean.
If an aneroid manometer is used, its accuracy must be checked regularly
against a standard manometer. The needle should indicate zero when the
cuff is fully deflated.
The lab is divided into 4 sections, the first 3 of which you should do in
parallel in the usual paired groups. Half the class should start with the
blood pressure measurements while the other half starts with the ECG
measurements. For the final section, please form groups of 4-7 as this
exercise needs more people to carry out.
The subject lies down with both arms resting comfortably at his sides or
sits quietly with arm hanging down, elbow slightly bent-the goal is to
have the arm at the same level as the heart. Wrap the sphygmomanometer
cuff about the arm so that it is at heart level. The air bag inside the
cuff should overlay the anterior portion of the arm about an inch above the
antecubital fossa--the depression on the inside of the elbow joint. Note
the ``Artery'' label and the arrow that should sit over the center of the
inside of the elbow. The cuff should be wrapped snugly about the arm.
Palpate the radial pulse with the index and middle fingers near the base of
the thumb on the anterior surface of the wrist. While palpating the radial
pulse, rapidly inflate the cuff until the blood pressure manometer reads
200 mm Hg pressure. Set the valve on the rubber bulb so that the pressure
leaks out slowly (about 5 mm per second). Continue palpating the radial
pulse, and watch the manometer while air leaks out of the cuff. Note the
pressure at which the pulse reappears.
Record the pressure: mm Hg.
This is Systolic pressure
as detected by palpation. Allow the pressure to continue to decrease,
noticing the changes in the strength of the radial pulse.
Elevate the pressure in the cuff 20 mm Hg higher than the pressure at which
the radial pulse reappeared in A. Apply the stethoscope bell lightly
against the skin in the antecubital fossa over the brachial artery. There
will be no sounds heard if the cuff pressure is higher than the systolic
blood pressure because no blood will flow through the artery beyond the
cuff. As the cuff is slowly deflated, blood flow is turbulent beneath the
stethoscope. It is this turbulent flow that produces Korotkow's sounds.
Laminar flow is silent. Thus when the cuff is deflated completely, no
sounds are heard at the antecubital fossa. Deflate the cuff completely and
allow the subject to rest for a few minutes. DO NOT REMOVE THE CUFF
Palpate the radial artery, and elevate the pressure in the cuff to 20
mm Hg. Higher than that at which the radial pulse reappeared. Apply the
stethoscope to the skin over the brachial artery, and allow pressure to
leak slowly from the cuff. Note the pressures:
(1) At which the radial pulse is first felt: mm Hg.
(2) At which the sound is first heard with the stethoscope:
mm Hg.
The pressure at which the sound was first heard is recorded as systolic
blood pressure. Allow the pressure to continue to fall. The Korotkow's
sounds grow more and more intense as the pressure is reduced. Then they
suddenly acquire a muffled tone and finally disappear.
The pressure observed at the first muffled tone is the first Diastolic
pressure.
The pressure observed when the sound disappears is the second diastolic
pressure. Record this pressure as the diastolic pressure for this
laboratory. (Note: In practice you should record both diastolic
pressures.)
Repeat the blood pressure determination at least three times, or until
sufficient proficiency is acquired that agreement is obtained between
consecutive readings. Blood pressure is recorded with the systolic
pressure reading first,
e.g., 120/80 means Systolic 120 mm Hg; Diastolic 80 mm Hg.
Pulse Pressure is the difference between Systolic and Diastolic blood
pressure.
How do the measurements from these two methods compare? Which do
you think was more accurate and why? Try and explain any differences in
results.
One can measure the approximate venous pressure by noting how much above
the level of the heart an extremity must be so that hydrostatic and venous
pressures are equal. At that point, there is barely enough venous pressure
to lift blood against the hydrostatic pressure of the elevate limb.
With the subject sitting quietly next to a bench, with one arm lying on the
bench-top, observe the veins on the back of the relaxed hand1. While the subject is reclining, passively raise
and lower the subject's arm and observe for filling and collapsing of the
veins of the back of the hand. Measure the distance in millimeters from
the position where the veins are just barely collapsed to the level of the
heart (in the sitting subject approximately at mid-thorax. This will give
the venous pressure in mm of blood.
Venous pressure in mm of blood =
The specific gravity of blood is 1.056.
The specific gravity of mercury is 13.6.
Compute the venous pressure in mm Hg using the equation
mm of blood *
Sp.Gr. of blood = mm of mercury *
Sp.Gr. of mercury
Venous pressure in mm Hg. =
Figure 2:
Electrocardiographic lead field.
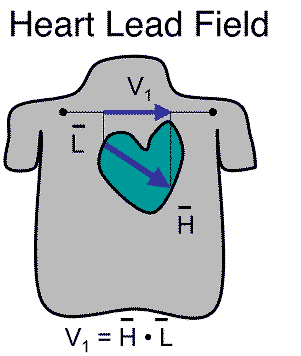 |
The ``limb leads'' are part of the legacy of Wilhems Einthoven, developer
of the string galvanometer and winner of the 1926 Nobel Prize for his
advances in electrocardiography. The idea was to capture the projection of
the cardiac dipole in the frontal plane based on an equilateral triangle
coordinate system. The underlying formalism of the limb lead (and the
Frank lead) system is the lead field, a function that projects a current
dipole source to any point on the body surface as shown in
Figure 2. The lead field vector  is specific to
a set of electrode locations and when multiplied by the current dipole
vector
is specific to
a set of electrode locations and when multiplied by the current dipole
vector  , the result is a scalar value equal to the potential
difference between the electrodes of the lead.
, the result is a scalar value equal to the potential
difference between the electrodes of the lead.
Figure 3:
Limb system of the ECG.
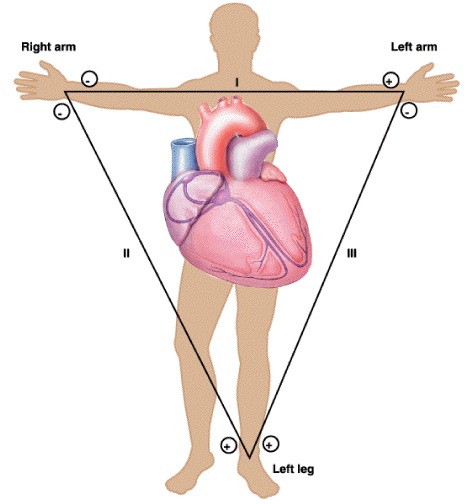 |
The goal of this part of the lab is just to learn the basics of measuring
an ECG. Figure 3 illustrates the limb lead ECG, with
three electrodes forming three difference measurements or ``leads''. We
will use the remaining electrode as the reference in each case and record
the lead from the other two electrodes. Note the polarity of each of the
limb leads and try to mimic them in your measurements.
Figure 4:
Circuit diagram for the limb lead
measurements
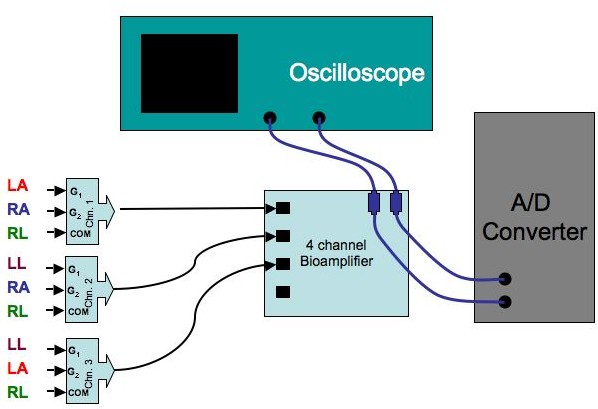 |
The steps in setting up this basic ECG measurement are as follows:
- Identify the following four sites on the torso of the subject and
use an alcohol swab to thoroughly clean the skin beforehand:
- Right anterior shoulder, just below the clavicle
- Left anterior shoulder, just below the clavicle
- Left lower ribs, near the mid-axillary line (equivalent to left
leg) Note: the mid-axillary line runs along the side of the thorax
mid way between front and back of the chest; the axilla are the
armpits.
- Right lower ribs, near the mid-axillary line (equivalent to
right leg)
- At each site, apply one of the disposable, pre-gelled ECG
electrodes. Find locations as free of subcutaneous fat and muscle as
possible.
- Using the bundled ECG connector wires and short splitter cables,
connect the lead wires in set of three to into the connectors that run
to the inputs of the 4-channel bioamplifier so that you can record all
three leads at once. Take careful note of the polarity of the
leads and make connections accordingly. For example, to record Lead
I, this would require:
- Right anterior shoulder: -, G2 input, blue dot on the connector
- Left anterior shoulder: +, G1 input, yellow dot
- Right leg (or lower torso): reference, COM, green dot
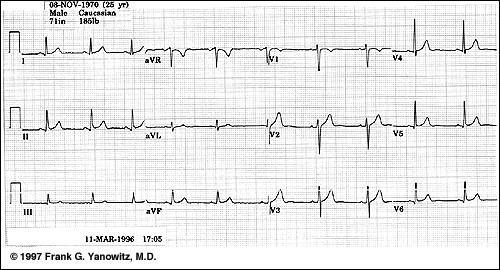
You can check that you have proper polarity by comparing the measured
signals to the sample in Figure 5 below.
- For the bioamplifier start with the following settings:
- Switch calibrator switch to ``USE''
- Set the LO FREQ. setting to 0.1.
- Set Amplification to 5 (and turn the ``ADJ. CAL'' screw all the
way to the left; the resulting gain is approximately 1700.
- Set HI FREQ. to 1 kHz
- Make sure to use the same settings for all channels.
- Put a T-connector on any two of the outputs of the bioamplifier,
with two BNC cables, one to a channel on the oscilloscope (both ends of
the cable should be BNC) and the other to the A/D input box connected
to the computer. Connect the A/D ground input (``Ain Grnd'') to the
ground of the oscilloscope (near the power switch).
- On the oscilloscope:
- On the oscilloscope, push the Menu button and for each channel,
first set the tracing position with the small knob and then select
DC coupling with one of the screen buttons.
- Vertical scaling control knob so that it is the same on both
channels and start with a setting of 2 or 5 V/division.
- Adjust the horizontal control knob to .2 SEC/DIV.
- Trigger should be set to AUTO.
Now ensure that you have a good signal on the oscilloscope, make
adjustments as necessary, and then:
- Note the sensitivity of the ECG to motion of the subject and
experiment to create the best conditions.
- Save an image of the ECG on the oscilloscope using the memory
function-you will have to use the memory function once for each
channels and save each one in a different reference location on the
oscilloscope.
- From the saved signals, compute the period and heart rate for
your subject.
- Using the acquisition program, record a baseline ECG; perform the
same measurements of heart rate.
- Try swapping electrode connections around so that you measure and
record all
three limb leads. Also try using another lead, e.g., the right
leg, as the reference and repeat the measurements. Do
the signals change noticeably when the reference changes?
Figure 5:
An example of a normal 12-lead ECG
 |
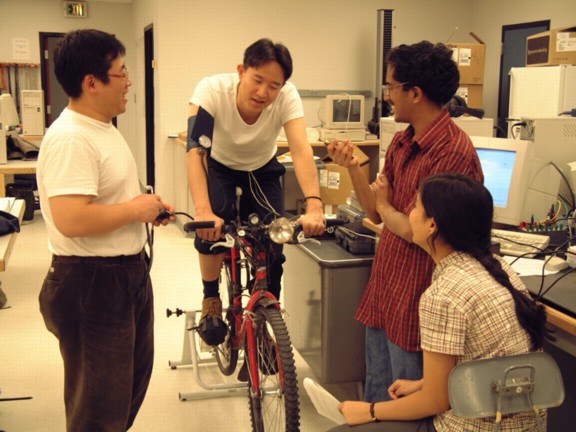
The goal of this part of the lab is to record the response of a test
subject to moderate exercise. For this, each team needs 4-6 people
organized as follows (See Figure 6):
- 1) Subject:
- in comfortable clothes with ECG electrodes applied and
blood pressure cuff applied loosely around an upper arm.
- 2) Blood pressure monitor:
- stationed at the side of the subject
with stethoscope and blood pressure manometer and bulb in hand.
This person will carry out the BP measurements during the breaks in
the exercise.
- 3) Pulse monitor:
- stationed on the other side of the subject, this
person's job is to measure heart rate during the breaks in the
exercise.
- 4) ECG/Computer operator:
- sitting at the bench, this person's task
is to make ECG measurements and record all other measurements from
the blood pressure and pulse monitors. This person is also
responsible for tracking the time and setting the pedal frequency.
Use the ECG lead combination that produced the largest amplitude
signals of the three possibilities.
Figure 6:
The minimal exercise lab team.
 |
There are two protocols for these experiments, but before beginning, let
the subject warm up and make sure he/she is comfortable on the bike and has
selected a comfortable gear and resistance setting to be able to complete
8-10 minutes of pedaling with moderate exertion.
For this part of the protocol, use the same ECG setup as above, recording
all 3 limb leads simultaneously on the computer and monitoring at least 1
of them on the oscilloscope.
To ensure a constant or controlled load, we will use a metronome to
determine the pedaling cadence (rate) of the subject. Make the
own metronome from a signal generator, as follows:
- Set the Agilent (for Hewlett-Packard) 33120A function generator to
the following settings:
- Function: square wave
- Amplitude: about 1 VPP (volts peak-to-peak)
- Duty cycle: 20%
- DC offset: 0.0
- Connect a T-connector from the output of the function generator and
connect one side of it to the Channel 2 input of the oscilloscope.
use the oscilloscope to monitor the output of the function generator,
especially its frequency.
- Connect a cable from the other end of the T-connector to
the BNC/Banana converted and then to the adapter cable to a
1/8'' female plug for the headphones. Adjust volume with the headphone
controls and the amplitude control of the function generator.
- Adjust the frequency of the signal generator to a level that the
subjects find comfortable. Sample the signal with the oscilloscope and
note the period and associated frequency.
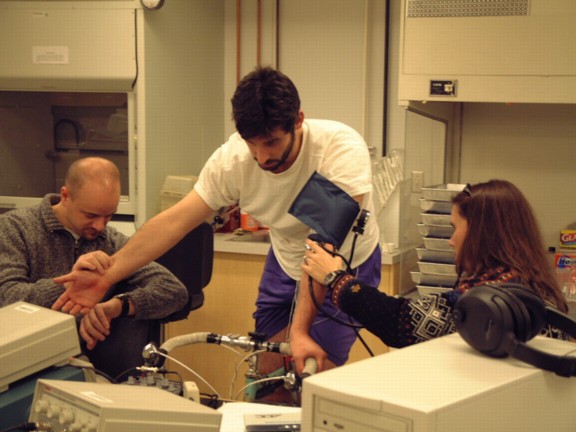
Some additional technical aspects to note:
- Carry out measurements during the breaks at the end of each
2-minute interval as quickly as possible!
Figure 7 shows such a measurement taking place. The
subject will recover during these breaks and this will reduce the
accuracy of the study; the breaks should be no longer than 30 seconds.
- Measure pulse rate using the count during 15 s as soon as the subject
stops pedaling.
- Subjects should try and be as still as possible during the breaks
and the ECG operator is responsible for measuring during an
interval when the signals are as quiet and stable as possible.
- Adjust the A/D converter range for the acquisition program so as to
capture the signal with the best possible resolution. Try and
reduce baseline drift as much as possible; if the problem persists,
try turning the Bioamplifier to AC coupling. Note that turning the
oscilloscope to AC will appear to improve the baseline instability
but that this effect does not pass to the A/D converter, which
measures DC amplitudes.
Figure 7:
Simultaneous measurements of heart rate and
blood pressure during a break in the exercise.
 |
- Give the subject a 5-minute recovery period after the warmup and
take resting measurements of BP, pulse, and ECG. Set the metronome
to the cadence you worked out beforehand with the subject.
- Exercise 2 minutes: Let the subject pedal at the set rate
for 2 minutes and then stop and as quickly as possible, measure
blood pressure and pulse, and take a sample of the ECG on the
computer. Keep the breaks below 30 s.
- Exercise 4 minutes: Let the subject pedal another 2
minutes and repeat measurements.
- Exercise 6 minutes: Let the subject pedal another 2
minutes and repeat measurements.
- Exercise 8 minutes: Exercise for another two minutes and
then measure again. Stop the exercise at this point but keep
subject sitting on bicycle.
- Recover 2 minutes: no pedaling, repeat measurements.
- Recover 4 minutes: no pedaling, repeat measurements.
- Recover 6 minutes: no pedaling, repeat measurements.
- Let subject relax and cool down.
The goal for this protocol is to apply a graded stress to the subject and
observe the response. For this, have the subject select a gear that he/she
can maintain over a cadence range of about 60-90 rpm. The subject will
spend 2 minutes at each cadence, then stop for measurements, then continue
at an increased cadence for 2 minutes, and so on.
Work out beforehand a sequence of cadences and associated periods that will
span at least 60-90 rpm in 4 steps.
- Give the subject a 5-minute recovery period and take resting
measurements of BP, pulse, and ECG. Set the metronome to produce
a cadence rate of 60 bpm.
- Exercise 2 minutes: Let the subject pedal at the set rate
for 2 minutes and then stop and as quickly as possible, measure
blood pressure and pulse, and take a sample of the ECG on the
computer. During the measurement break, set the new cadence on the
metronome.
- Exercise 4 minutes: Let the subject pedal another 2
minutes at the new cadence and repeat measurements. Increase the
cadence again.
- Exercise 6 minutes: Let the subject pedal another 2
minutes at the new cadence and repeat measurements. Increase the
cadence again.
- Exercise 8 minutes: Let the subject pedal another 2
minutes at the new cadence and repeat measurements. Stop the
exercise at this point but keep subject on bicycle.
- Recover 2 minutes: no pedaling, repeat measurements.
- Recover 4 minutes: no pedaling, repeat measurements.
- Recover 6 minutes: no pedaling, repeat measurements.
- Let subject relax and cool down; feed water but hold off on the
cake until the end of the next protocol.
As with the previous report, concentrate on presenting the results and
discussion of them rather than the methods and background sections. You
may choose to include the discussion with the results or have separate
results and discussion sessions. It is up to you.
Include results and discussion for the following parts of the lab:
- Blood pressure:
- include all the pressure measurements and answer
all the questions in the lab description. Be sure to include all
three results of the measurements and explain reasons for the
variation you might see.
- ECG:
- include tracing of 1-3 beats from each of the electrode
arrangements you measured; describe any differences in signal
morphology you see. For at least one tracing, add arrows to mark
each of the major features of the ECG: P, Q, R, S, and T waves,
ST segment, PQ segment, and TQ segment.
- Exercise:
- create a table and graphs for both systolic and
diastolic blood pressures, heart rate using palpation, and heart
using the measured ECGs for each of the exercise protocols; these
should all be graphs of the measured value, e.g., heart rate, as a
function of time through your the protocol. Discuss
the results of these graphs--did they go as you expected? What
do they suggest about the body's response to exercise? Did you see
any changes in ECG shape with exercise? Specifically, what changes
did you see in blood pressure with exercise--provide a model of
what happens during exercise and discuss how the data you measured
support that model.
- Mechanisms:
- Describe briefly the physiological mechanisms of
as many as possible of the responses to exercise that you
observed. Specifically, make sure to explain the different factors
that will alter blood pressure and decide which ones might be
dominant from your data.
- Experimental problems:
- Describe any experimental challenges you
had to face in the lab and how you dealt with them or how you would
plan to deal with them were you to repeat these experiments in the
future.
- Miscellaneous:
-
- When displaying the results of the ECG recordings, try and
use the same scaling on the axes so that it is possible to
compare results between different recordings.
- You can, in principle, do all the graphs with Excel but
please try and use MATLAB if possible. This suggestions is
especially important if you wish to do any signal
processing such as filtering of the ECG signals. If you
have questions, simply ask the TA or me for explanations or
suggestions.
ECG, Blood Pressure, and Exercise Lab
This document was generated using the
LaTeX2HTML translator Version 2002-2-1 (1.71)
Copyright © 1993, 1994, 1995, 1996,
Nikos Drakos,
Computer Based Learning Unit, University of Leeds.
Copyright © 1997, 1998, 1999,
Ross Moore,
Mathematics Department, Macquarie University, Sydney.
The command line arguments were:
latex2html -split 3 -no_white -link 3 -no_navigation -no_math -html_version 3.2,math -show_section_numbers -local_icons descrip
The translation was initiated by Rob Macleod on 2006-03-31
Rob Macleod
2006-03-31