2014
![]()
Y. Gur, C.R. Johnson.
“Generalized HARDI Invariants by Method of Tensor Contraction,” In Proceedings of the 2014 IEEE International Symposium on Biomedical Imaging (ISBI), pp. 718--721. April, 2014.
We propose a 3D object recognition technique to construct rotation invariant feature vectors for high angular resolution diffusion imaging (HARDI). This method uses the spherical harmonics (SH) expansion and is based on generating rank-1 contravariant tensors using the SH coefficients, and contracting them with covariant tensors to obtain invariants. The proposed technique enables the systematic construction of invariants for SH expansions of any order using simple mathematical operations. In addition, it allows construction of a large set of invariants, even for low order expansions, thus providing rich feature vectors for image analysis tasks such as classification and segmentation. In this paper, we use this technique to construct feature vectors for eighth-order fiber orientation distributions (FODs) reconstructed using constrained spherical deconvolution (CSD). Using simulated and in vivo brain data, we show that these invariants are robust to noise, enable voxel-wise classification, and capture meaningful information on the underlying white matter structure.
Keywords: Diffusion MRI, HARDI, invariants
C.D. Hansen, M. Chen, C.R. Johnson, A.E. Kaufman, H. Hagen (Eds.).
“Scientific Visualization: Uncertainty, Multifield, Biomedical, and Scalable Visualization,” Mathematics and Visualization, Springer, 2014.
ISBN: 978-1-4471-6496-8
![]()
S. Kurugol, K. Kose, B. Park, J.G. Dy, D.H. Brooks, M. Rajadhyaksha.
“Automated Delineation of Dermal-Epidermal Junction In Reflectance Confocal Microscopy Image Stacks Of Human Skin,” In Journal of Investigative Dermatology, September, 2014.
DOI: 10.1038/jid.2014.379
PubMed ID: 25184959
Reflectance confocal microscopy (RCM) images skin non-invasively, with optical sectioning and nuclear-level resolution comparable to that of pathology. Based on assessment of the dermal-epidermal junction (DEJ) and morphologic features in its vicinity, skin cancer can be diagnosed in vivo with high sensitivity and specificity. However, the current visual, qualitative approach for reading images leads to subjective variability in diagnosis. We hypothesize that machine learning-based algorithms may enable a more quantitative, objective approach. Testing and validation was performed with two algorithms that can automatically delineate the DEJ in RCM stacks of normal human skin. The test set was composed of 15 fair and 15 dark skin stacks (30 subjects) with expert labellings. In dark skin, in which the contrast is high due to melanin, the algorithm produced an average error of 7.9±6.4 μm. In fair skin, the algorithm delineated the DEJ as a transition zone, with average error of 8.3±5.8 μm for the epidermis-to-transition zone boundary and 7.6±5.6 μm for the transition zone-to-dermis. Our results suggest that automated algorithms may quantitatively guide the delineation of the DEJ, to assist in objective reading of RCM images. Further development of such algorithms may guide assessment of abnormal morphological features at the DEJ.
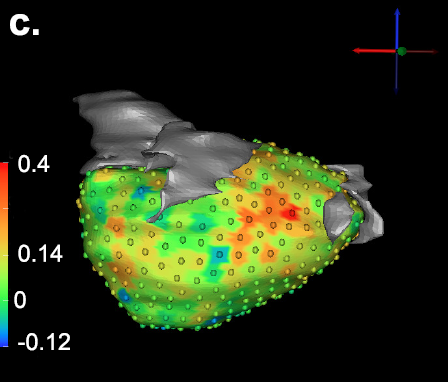
C. McGann, N. Akoum, A. Patel, E. Kholmovski, P. Revelo, K. Damal, B. Wilson, J. Cates, A. Harrison, R. Ranjan, N.S. Burgon, T. Greene, D. Kim, E.V. Dibella, D. Parker, R.S. MacLeod, N.F. Marrouche.
“Atrial fibrillation ablation outcome is predicted by left atrial remodeling on MRI,” In Circ Arrhythm Electrophysiol, Vol. 7, No. 1, pp. 23--30. 2014.
DOI: 10.1161/CIRCEP.113.000689
PubMed ID: 24363354
BACKGROUND:
Although catheter ablation therapy for atrial fibrillation (AF) is becoming more common, results vary widely, and patient selection criteria remain poorly defined. We hypothesized that late gadolinium enhancement MRI (LGE-MRI) can identify left atrial (LA) wall structural remodeling (SRM) and stratify patients who are likely or not to benefit from ablation therapy.
![]()
M. Milanič, V. Jazbinšek, R.S. MacLeod, D.H. Brooks, R. Hren.
“Assessment of regularization techniques for electrocardiographic imaging,” In Journal of electrocardiology, Vol. 47, No. 1, pp. 20--28. 2014.
DOI: 10.1016/j.jelectrocard.2013.10.004
A widely used approach to solving the inverse problem in electrocardiography involves computing potentials on the epicardium from measured electrocardiograms (ECGs) on the torso surface. The main challenge of solving this electrocardiographic imaging (ECGI) problem lies in its intrinsic ill-posedness. While many regularization techniques have been developed to control wild oscillations of the solution, the choice of proper regularization methods for obtaining clinically acceptable solutions is still a subject of ongoing research. However there has been little rigorous comparison across methods proposed by different groups. This study systematically compared various regularization techniques for solving the ECGI problem under a unified simulation framework, consisting of both 1) progressively more complex idealized source models (from single dipole to triplet of dipoles), and 2) an electrolytic human torso tank containing a live canine heart, with the cardiac source being modeled by potentials measured on a cylindrical cage placed around the heart. We tested 13 different regularization techniques to solve the inverse problem of recovering epicardial potentials, and found that non-quadratic methods (total variation algorithms) and first-order and second-order Tikhonov regularizations outperformed other methodologies and resulted in similar average reconstruction errors.
![]()
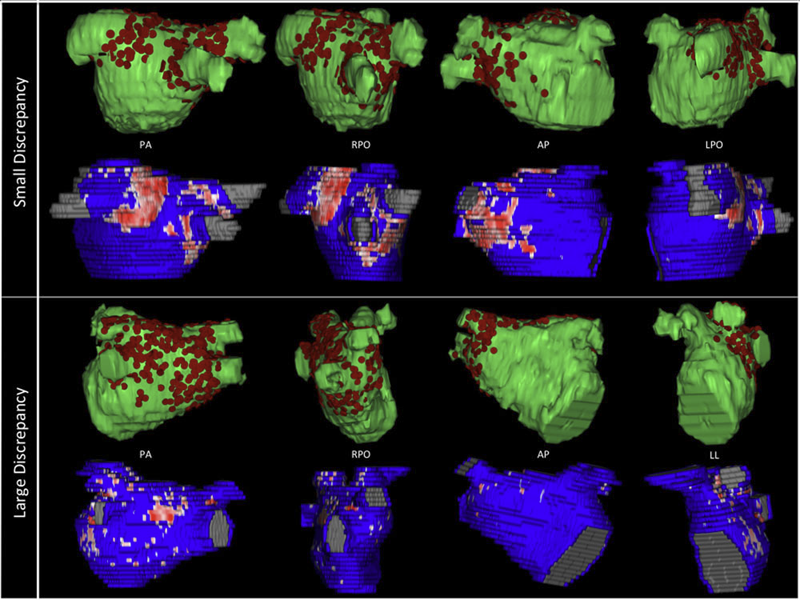
B.R. Parmar, T.R. Jarrett, N.S. Burgon, E.G. Kholmovski, N.W. Akoum, N. Hu, R.S. Macleod, N.F. Marrouche, R. Ranjan.
“Comparison of Left Atrial Area Marked Ablated in Electroanatomical Maps with Scar in MRI,” In Journal of Cardiovascular Electrophysiology, 2014.
DOI: 10.1111/jce.12357
Background
Three-dimensional electroanatomic mapping (EAM) is routinely used to mark ablated areas during radiofrequency ablation. We hypothesized that, in atrial fibrillation (AF) ablation, EAM overestimates scar formation in the left atrium (LA) when compared to the scar seen on late-gadolinium enhancement magnetic resonance imaging (LGE-MRI).
Methods and Results
Of the 235 patients who underwent initial ablation for AF at our institution between August 2011 and December 2012, we retrospectively identified 70 patients who had preprocedural magnetic resonance angiography merged with LA anatomy in EAM software and had a 3-month postablation LGE-MRI for assessment of scar. Ablated area was marked intraprocedurally using EAM software and quantified retrospectively. Scarred area was quantified in 3-month postablation LGE-MRI. The mean ablated area in EAM was 30.5 ± 7.5% of the LA endocardial surface and the mean scarred area in LGE-MRI was 13.9 ± 5.9% (P < 0.001). This significant difference in the ablated area marked in the EAM and scar area in the LGE-MRI was present for each of the 3 independent operators. Complete pulmonary vein (PV) encirclement representing electrical isolation was observed in 87.8% of the PVs in EAM as compared to only 37.4% in LGE-MRI (P < 0.001).
Conclusions
In AF ablation, EAM significantly overestimates the resultant scar as assessed with a follow-up LGE-MRI.
Keywords: atrial fibrillation, magnetic resonance imaging, radiofrequency ablation
![]()
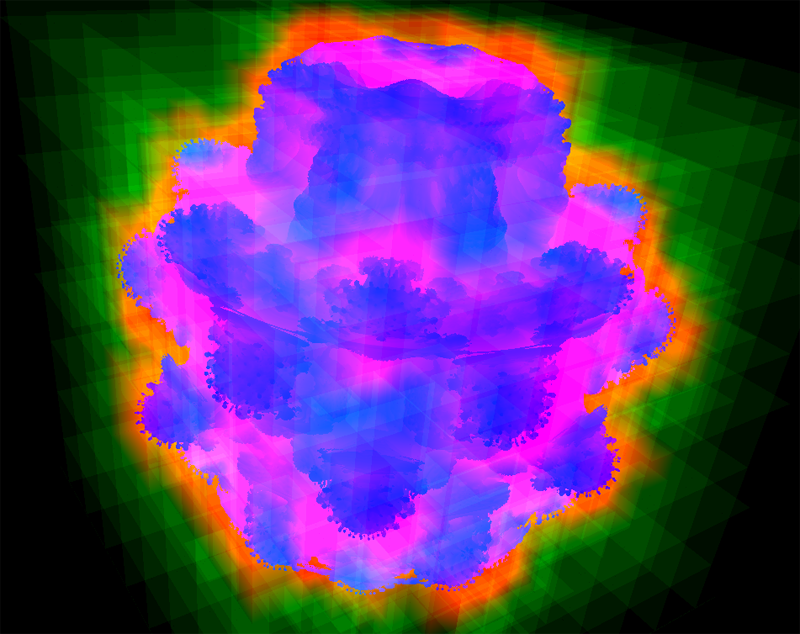
R. Sicat, J. Krüger, T. Möller, M. Hadwiger.
“Sparse PDF Volumes for Consistent Multi-Resolution Volume Rendering,” In IEEE Transactions on Visualization and Computer Graphics (TVCG), Vol. PP, No. 99, pp. 1--1. 2014.
ISBN: 1077-2626
DOI: 10.1109/TVCG.2014.2346324
This paper presents a new multi-resolution volume representation called sparse pdf volumes, which enables consistent multi-resolution volume rendering based on probability density functions (pdfs) of voxel neighborhoods. These pdfs are defined in the 4D domain jointly comprising the 3D volume and its 1D intensity range. Crucially, the computation of sparse pdf volumes exploits data coherence in 4D, resulting in a sparse representation with surprisingly low storage requirements. At run time, we dynamically apply transfer functions to the pdfs using simple and fast convolutions. Whereas standard low-pass filtering and down-sampling incur visible differences between resolution levels, the use of pdfs facilitates consistent results independent of the resolution level used. We describe the efficient out-of-core computation of large-scale sparse pdf volumes, using a novel iterative simplification procedure of a mixture of 4D Gaussians. Finally, our data structure is optimized to facilitate interactive multi-resolution volume rendering on GPUs.
![]()
J. Sourati, D. Erdogmus, J.G. Dy, D.H. Brooks.
“Accelerated learning-based interactive image segmentation using pairwise constraints,” In IEEE Transactions on Medical Image Processing, Vol. 23, No. 7, pp. 3057-3070. July, 2014.
DOI: 10.1109/TIP.2014.2325783
PubMed ID: 24860031
PubMed Central ID: PMC4096329
Algorithms for fully automatic segmentation of images are often not sufficiently generic with suitable accuracy, and fully manual segmentation is not practical in many settings. There is a need for semiautomatic algorithms, which are capable of interacting with the user and taking into account the collected feedback. Typically, such methods have simply incorporated user feedback directly. Here, we employ active learning of optimal queries to guide user interaction. Our work in this paper is based on constrained spectral clustering that iteratively incorporates user feedback by propagating it through the calculated affinities. The original framework does not scale well to large data sets, and hence is not straightforward to apply to interactive image segmentation. In order to address this issue, we adopt advanced numerical methods for eigen-decomposition implemented over a subsampling scheme. Our key innovation, however, is an active learning strategy that chooses pairwise queries to present to the user in order to increase the rate of learning from the feedback. Performance evaluation is carried out on the Berkeley segmentation and Graz-02 image data sets, confirming that convergence to high accuracy levels is realizable in relatively few iterations.
2013
![]()
B. Burton, B. Erem, K. Potter, P. Rosen, C.R. Johnson, D. Brooks, R.S. Macleod.
“Uncertainty Visualization in Forward and Inverse Cardiac Models,” In Computing in Cardiology CinC, pp. 57--60. 2013.
ISSN: 2325-8861
![]()
C. Butson, G. Tamm, S. Jain, T. Fogal, J. Krüger.
“Evaluation of Interactive Visualization on Mobile Computing Platforms for Selection of Deep Brain Stimulation Parameters,” In IEEE Transactions on Visualization and Computer Graphics, Vol. 19, No. 1, pp. 108--117. January, 2013.
DOI: 10.1109/TVCG.2012.92
PubMed ID: 22450824
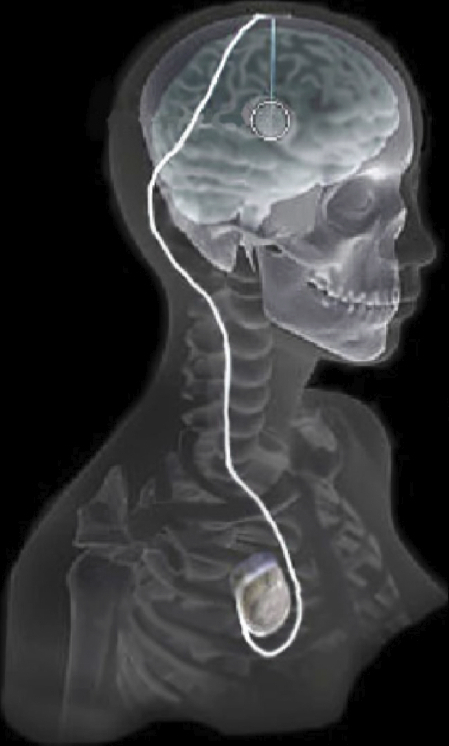
Keywords: Biomedical and Medical Visualization, Mobile and Ubiquitous Visualization, Computational Model, Clinical Decision Making, Parkinson’s Disease, SciDAC, ImageVis3D
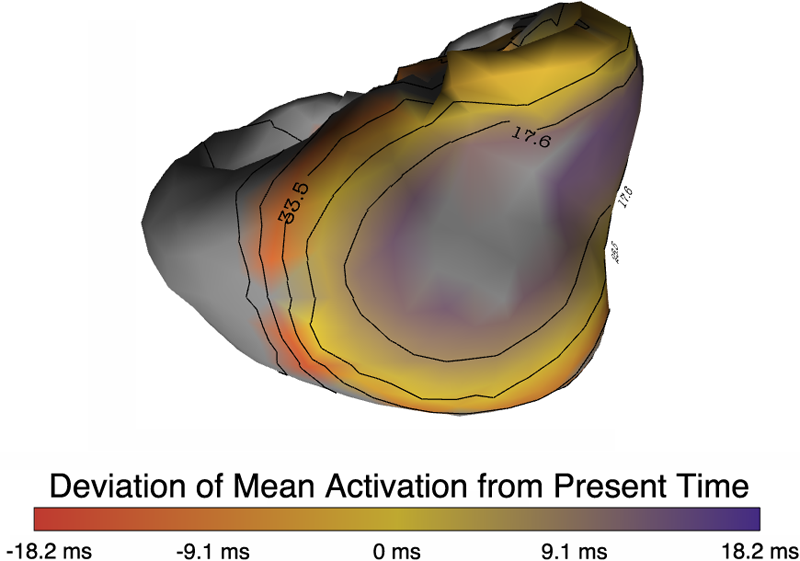
J. Coll-Font, B. Erem, A. Karma, D.H. Brooks.
“An inverse spectral method to localize discordant alternans regions on the heart from body surface measurements,” In Functional Imaging and Modeling of the Heart, pp. 241--248. 2013.
DOI: 10.1007/978-3-642-38899-6_29
Spatially discordant T-wave alternans (TWA) has been shown to be linked to the genesis of ventricular fibrillation. Identification of discordant TWA through spatial characterization of TWA patterns in the heart has the potential to improve sudden cardiac death risk stratification. In this paper we present a method to solve a new variant of the inverse problem in electrocardiography that is tailored to estimate the TWA regions on the heart from non-invasive measurements on the body surface. We evaluate our method using both body surface potentials synthesized from heart surface potentials generated with ECGSIM and from potentials measured on a canine heart, and we show that this method detects the main regions in the heart undergoing TWA.
![]()
A. Daducci, E.J. Canales-Rodriguez, M. Descoteaux, E. Garyfallidis, Y. Gur, Y.-C Lin, M. Mani, S. Merlet, M. Paquette, A. Ramirez-Manzanares, M. Reisert, P.R. Rodrigues, F. Sepehrband, E. Caruyer, J. Choupan, R. Deriche, M. Jacob, G. Menegaz, V. Prckovska, M. Rivera, Y. Wiaux, J.-P. Thiran.
“Quantitative comparison of reconstruction methods for intra-voxel fiber recovery from diffusion MRI,” In IEEE Transactions on Medical Imaging, Vol. 33, No. 2, pp. 384--399. 2013.
ISSN: 0278-0062
DOI: 10.1109/TMI.2013.2285500
Validation is arguably the bottleneck in the diffusion MRI community. This paper evaluates and compares 20 algorithms for recovering the local intra-voxel fiber structure from diffusion MRI data and is based on the results of the "HARDI reconstruction challenge" organized in the context of the "ISBI 2012" conference. Evaluated methods encompass a mixture of classical techniques well-known in the literature such as Diffusion Tensor, Q-Ball and Diffusion Spectrum imaging, algorithms inspired by the recent theory of compressed sensing and also brand new approaches proposed for the first time at this contest. To quantitatively compare the methods under controlled conditions, two datasets with known ground-truth were synthetically generated and two main criteria were used to evaluate the quality of the reconstructions in every voxel: correct assessment of the number of fiber populations and angular accuracy in their orientation. This comparative study investigates the behavior of every algorithm with varying experimental conditions and highlights strengths and weaknesses of each approach.
M. Datar, I. Lyu, S. Kim, J. Cates, M.A. Styner, R.T. Whitaker.
“Geodesic distances to landmarks for dense correspondence on ensembles of complex shapes,” In Proceedings of Medical Image Computing and Computer-Assisted Intervention (MICCAI 2011), Vol. 16(Pt. 2), pp. 19--26. 2013.
PubMed ID: 24579119
Establishing correspondence points across a set of biomedical shapes is an important technology for a variety of applications that rely on statistical analysis of individual subjects and populations. The inherent complexity (e.g. cortical surface shapes) and variability (e.g. cardiac chambers) evident in many biomedical shapes introduce significant challenges in finding a useful set of dense correspondences. Application specific strategies, such as registration of simplified (e.g. inflated or smoothed) surfaces or relying on manually placed landmarks, provide some improvement but suffer from limitations including increased computational complexity and ambiguity in landmark placement. This paper proposes a method for dense point correspondence on shape ensembles using geodesic distances to a priori landmarks as features. A novel set of numerical techniques for fast computation of geodesic distances to point sets is used to extract these features. The proposed method minimizes the ensemble entropy based on these features, resulting in isometry invariant correspondences in a very general, flexible framework.
![]()
D.J. Dosdall, R. Ranjan, K. Higuchi, E. Kholmovski, N. Angel, L. Li, R.S. Macleod, L. Norlund, A. Olsen, C.J. Davies, N.F. Marrouche.
“Chronic atrial fibrillation causes left ventricular dysfunction in dogs but not goats: experience with dogs, goats, and pigs,” In American Journal of Physiology: Heart and Circulatory Physiology, Vol. 305, No. 5, pp. H725--H731. September, 2013.
DOI: 10.1152/ajpheart.00440.2013
PubMed ID: 23812387
PubMed Central ID: PMC4116536
Structural remodeling in chronic atrial fibrillation (AF) occurs over weeks to months. To study the electrophysiological, structural, and functional changes that occur in chronic AF, the selection of the best animal model is critical. AF was induced by rapid atrial pacing (50-Hz stimulation every other second) in pigs (n = 4), dogs (n = 8), and goats (n = 9). Animals underwent MRIs at baseline and 6 mo to evaluate left ventricular (LV) ejection fraction (EF). Dogs were given metoprolol (50-100 mg po bid) and digoxin (0.0625-0.125 mg po bid) to limit the ventricular response rate to ot appropriate for chronic rapid atrial pacing-induced AF studies. Rate-controlled chronic AF in the dog model developed HF and LV fibrosis, whereas the goat model developed only atrial fibrosis without ventricular dysfunction and fibrosis. Both the dog and goat models are representative of segments of the patient population with chronic AF.
Keywords: animal models, chronic atrial fibrillation, fibrosis, heart failure, rapid atrial pacing
B. Erem, J. Coll-Font, R.M. Orellana, P. Stovicek, D.H. Brooks, R.S. MacLeod.
“Noninvasive reconstruction of potentials on endocardial surface from body surface potentials and CT imaging of partial torso,” In Journal of Electrocardiology, Vol. 46, No. 4, pp. e28. 2013.
DOI: 10.1016/j.jelectrocard.2013.05.104
B. Erem, R.M. Orellana, P. Stovicek, D.H. Brooks, R.S. MacLeod.
“Improved averaging of multi-lead ECGs and electrograms,” In Journal of Electrocardiology, Vol. 46, No. 4, Elsevier, pp. e28. July, 2013.
DOI: 10.1016/j.jelectrocard.2013.05.103
![]()
T. Fogal, A. Schiewe, J. Krüger.
“An Analysis of Scalable GPU-Based Ray-Guided Volume Rendering,” In 2013 IEEE Symposium on Large Data Analysis and Visualization (LDAV), 2013.
Volume rendering continues to be a critical method for analyzing large-scale scalar fields, in disciplines as diverse as biomedical engineering and computational fluid dynamics. Commodity desktop hardware has struggled to keep pace with data size increases, challenging modern visualization software to deliver responsive interactions for O(N3) algorithms such as volume rendering. We target the data type common in these domains: regularly-structured data.
In this work, we demonstrate that the major limitation of most volume rendering approaches is their inability to switch the data sampling rate (and thus data size) quickly. Using a volume renderer inspired by recent work, we demonstrate that the actual amount of visualizable data for a scene is typically bound considerably lower than the memory available on a commodity GPU. Our instrumented renderer is used to investigate design decisions typically swept under the rug in volume rendering literature. The renderer is freely available, with binaries for all major platforms as well as full source code, to encourage reproduction and comparison with future research.
![]()
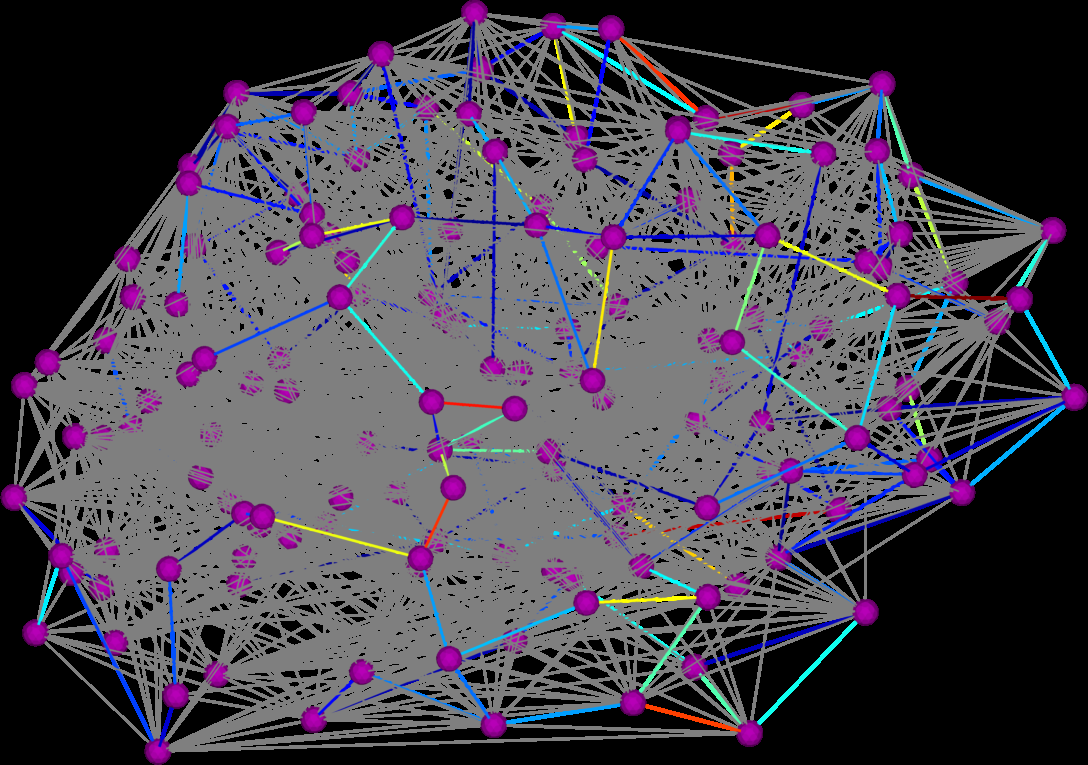
G. Gardner, A. Morris, K. Higuchi, R.S. MacLeod, J. Cates.
“A Point-Correspondence Approach to Describing the Distribution of Image Features on Anatomical Surfaces, with Application to Atrial Fibrillation,” In Proceedings of the 2013 IEEE 10th International Symposium on Biomedical Imaging (ISBI), pp. 226--229. 2013.
DOI: 10.1109/ISBI.2013.6556453
![]()
J. Grüninger, J. Krüger.
“The impact of display bezels on stereoscopic vision for tiled displays,” In Proceedings of the 19th ACM Symposium on Virtual Reality Software and Technology (VRST), pp. 241--250. 2013.
DOI: 10.1145/2503713.2503717
In recent years high-resolution tiled display systems have gained significant attention in scientific and information visualization of large-scale data. Modern tiled display setups are based on either video projectors or LCD screens. While LCD screens are the preferred solution for monoscopic setups, stereoscopic displays almost exclusively consist of some kind of video projection. This is because projections can significantly reduce gaps between tiles, while LCD screens require a bezel around the panel. Projection setups, however, suffer from a number of maintenance issues that are avoided by LCD screens. For example, projector alignment is a very time-consuming task that needs to be repeated at intervals, and different aging states of lamps and filters cause color inconsistencies. The growing availability of inexpensive stereoscopic LCDs for television and gaming allows one to build high-resolution stereoscopic tiled display walls with the same dimensions and resolution as projection systems at a fraction of the cost, while avoiding the aforementioned issues. The only drawback is the increased gap size between tiles.
In this paper, we investigate the effects of bezels on the stereo perception with three surveys and show, that smaller LCD bezels and larger displays significantly increase stereo perception on display wall systems. We also show that the bezel color is not very important and that bezels can negatively affect the adaption times to the stereoscopic effect but improve task completion times. Finally, we present guidelines for the setup of tiled stereoscopic display wall systems.
![]()
D.K. Hammond, Y. Gur, C.R. Johnson.
“Graph Diffusion Distance: A Difference Measure for Weighted Graphs Based on the Graph Laplacian Exponential Kernel,” In Proceedings of the IEEE global conference on information and signal processing (GlobalSIP'13), Austin, Texas, pp. 419--422. 2013.
DOI: 10.1109/GlobalSIP.2013.6736904
Page 7 of 24