


SCI Publications
2016


S. Guler, M. Dannhauer, B. Erem, R.S. Macleod, D. Tucker, S. Turovets, P. Luu, D. Erdogmus, D. Brooks.
“Optimization of focality and direction in dense electrode array transcranial direct currentstimulation (tDCS),” In Journal of Neural Engineering, Vol. 13, No. 3, IOP Publishing, pp. 036020. May, 2016.
DOI: 10.1088/1741-2560/13/3/036020
OBJECTIVE:
Transcranial direct current stimulation (tDCS) aims to alter brain function non-invasively via electrodes placed on the scalp. Conventional tDCS uses two relatively large patch electrodes to deliver electrical current to the brain region of interest (ROI). Recent studies have shown that using dense arrays containing up to 512 smaller electrodes may increase the precision of targeting ROIs. However, this creates a need for methods to determine effective and safe stimulus patterns as the number of degrees of freedom is much higher with such arrays. Several approaches to this problem have appeared in the literature. In this paper, we describe a new method for calculating optimal electrode stimulus patterns for targeted and directional modulation in dense array tDCS which differs in some important aspects with methods reported to date.
APPROACH:
We optimize stimulus pattern of dense arrays with fixed electrode placement to maximize the current density in a particular direction in the ROI. We impose a flexible set of safety constraints on the current power in the brain, individual electrode currents, and total injected current, to protect subject safety. The proposed optimization problem is convex and thus efficiently solved using existing optimization software to find unique and globally optimal electrode stimulus patterns.
MAIN RESULTS:
Solutions for four anatomical ROIs based on a realistic head model are shown as exemplary results. To illustrate the differences between our approach and previously introduced methods, we compare our method with two of the other leading methods in the literature. We also report on extensive simulations that show the effect of the values chosen for each proposed safety constraint bound on the optimized stimulus patterns.
SIGNIFICANCE:
The proposed optimization approach employs volume based ROIs, easily adapts to different sets of safety constraints, and takes negligible time to compute. An in-depth comparison study gives insight into the relationship between different objective criteria and optimized stimulus patterns. In addition, the analysis of the interaction between optimized stimulus patterns and safety constraint bounds suggests that more precise current localization in the ROI, with improved safety criterion, may be achieved by careful selection of the constraint bounds.
B. Hollister, G. Duffley, C. Butson,, C.R. Johnson.
“Visualization for Understanding Uncertainty in Activation Volumes for Deep Brain Stimulation,” In Eurographics Conference on Visualization, Edited by K.L. Ma G. Santucci, and J. van Wijk, 2016.
We have created the Neurostimulation Uncertainty Viewer (nuView or nView) tool for exploring data arising from deep brain stimulation (DBS). Simulated volume of tissue activated (VTA), using clinical electrode placements, are recorded along withpatient outcomes in the Unified Parkinson's disease rating scale (UPDRS). The data is volumetric and sparse, with multi-value patient results for each activated voxel in the simulation. nView provides a collection of visual methods to explore the activated tissue to enhance understanding of electrode usage for improved therapy with DBS.
A. Humphrey, D. Sunderland, T. Harman, M. Berzins.
“Radiative Heat Transfer Calculation on 16384 GPUs Using a Reverse Monte Carlo Ray Tracing Approach with Adaptive Mesh Refinement,” In 2016 IEEE International Parallel and Distributed Processing Symposium Workshops (IPDPSW), pp. 1222-1231. May, 2016.
DOI: 10.1109/IPDPSW.2016.93
Modeling thermal radiation is computationally challenging in parallel due to its all-to-all physical and resulting computational connectivity, and is also the dominant mode of heat transfer in practical applications such as next-generation clean coal boilers, being modeled by the Uintah framework. However, a direct all-to-all treatment of radiation is prohibitively expensive on large computers systems whether homogeneous or heterogeneous. DOE Titan and the planned DOE Summit and Sierra machines are examples of current and emerging GPUbased heterogeneous systems where the increased processing capability of GPUs over CPUs exacerbates this problem. These systems require that computational frameworks like Uintah leverage an arbitrary number of on-node GPUs, while simultaneously utilizing thousands of GPUs within a single simulation. We show that radiative heat transfer problems can be made to scale within Uintah on heterogeneous systems through a combination of reverse Monte Carlo ray tracing (RMCRT) techniques combined with AMR, to reduce the amount of global communication. In particular, significant Uintah infrastructure changes, including a novel lock and contention-free, thread-scalable data structure for managing MPI communication requests and improved memory allocation strategies were necessary to achieve excellent strong scaling results to 16384 GPUs on Titan.
S.K. Iyer, T. Tasdizen, D. Likhite, E.V.R. DiBella.
“Split Bregman multicoil accelerated reconstruction technique: A new framework for rapid reconstruction of cardiac perfusion MRI,” In Medical Physics, Vol. 43, No. 4, Wiley-Blackwell, pp. 1969--1981. March, 2016.
DOI: 10.1118/1.4943643
Purpose:
Rapid reconstruction of undersampled multicoil MRI data with iterative constrained reconstruction method is a challenge. The authors sought to develop a new substitution based variable splitting algorithm for faster reconstruction of multicoil cardiac perfusion MRI data.
Methods:
The new method, split Bregman multicoil accelerated reconstruction technique (SMART), uses a combination of split Bregman based variable splitting and iterative reweighting techniques to achieve fast convergence. Total variation constraints are used along the spatial and temporal dimensions. The method is tested on nine ECG-gated dog perfusion datasets, acquired with a 30-ray golden ratio radial sampling pattern and ten ungated human perfusion datasets, acquired with a 24-ray golden ratio radial sampling pattern. Image quality and reconstruction speed are evaluated and compared to a gradient descent (GD) implementation and to multicoil k-t SLR, a reconstruction technique that uses a combination of sparsity and low rank constraints.
Results:
Comparisons based on blur metric and visual inspection showed that SMART images had lower blur and better texture as compared to the GD implementation. On average, the GD based images had an ∼18% higher blur metric as compared to SMART images. Reconstruction of dynamic contrast enhanced (DCE) cardiac perfusion images using the SMART method was ∼6 times faster than standard gradient descent methods. k-t SLR and SMART produced images with comparable image quality, though SMART was ∼6.8 times faster than k-t SLR.
Conclusions:
The SMART method is a promising approach to reconstruct good quality multicoil images from undersampled DCE cardiac perfusion data rapidly.
S.K. Iyer, T. Tasdizen, N. Burgon, E. Kholmovski, N. Marrouche, G. Adluru, E.V.R. DiBella.
“Compressed sending for rapid late gadolinium enhanced imaging of the left atrium: A preliminary study, Magnetic Resonance Imaging,” In Magnetic Resonance Imaging, Vol. 34, No. 7, Elsevier BV, pp. 846--854. September, 2016.
DOI: 10.1016/j.mri.2016.03.002
Current late gadolinium enhancement (LGE) imaging of left atrial (LA) scar or fibrosis is relatively slow and requires 5–15 min to acquire an undersampled (R = 1.7) 3D navigated dataset. The GeneRalized Autocalibrating Partially Parallel Acquisitions (GRAPPA) based parallel imaging method is the current clinical standard for accelerating 3D LGE imaging of the LA and permits an acceleration factor ~ R = 1.7. Two compressed sensing (CS) methods have been developed to achieve higher acceleration factors: a patch based collaborative filtering technique tested with acceleration factor R ~ 3, and a technique that uses a 3D radial stack-of-stars acquisition pattern (R ~ 1.8) with a 3D total variation constraint. The long reconstruction time of these CS methods makes them unwieldy to use, especially the patch based collaborative filtering technique. In addition, the effect of CS techniques on the quantification of percentage of scar/fibrosis is not known.
We sought to develop a practical compressed sensing method for imaging the LA at high acceleration factors. In order to develop a clinically viable method with short reconstruction time, a Split Bregman (SB) reconstruction method with 3D total variation (TV) constraints was developed and implemented. The method was tested on 8 atrial fibrillation patients (4 pre-ablation and 4 post-ablation datasets). Blur metric, normalized mean squared error and peak signal to noise ratio were used as metrics to analyze the quality of the reconstructed images, Quantification of the extent of LGE was performed on the undersampled images and compared with the fully sampled images. Quantification of scar from post-ablation datasets and quantification of fibrosis from pre-ablation datasets showed that acceleration factors up to R ~ 3.5 gave good 3D LGE images of the LA wall, using a 3D TV constraint and constrained SB methods. This corresponds to reducing the scan time by half, compared to currently used GRAPPA methods. Reconstruction of 3D LGE images using the SB method was over 20 times faster than standard gradient descent methods.
S. Kim, I.Lyu, V. Fonov, C. Vachet, H. Hazlett, R. Smith, J. Piven, S. Dager, R. Mckinstry, J. Pruett, A. Evans, D. Collins, K. Botteron, R. Schultz, G. Gerig, M. Styner.
“Development of Cortical Shape in the Human Brain from 6 to 24 Months of Age via a Novel Measure of Shape Complexity,” In NeuroImage, Vol. 135, Elsevier, pp. 163--176. July, 2016.
DOI: 10.1016/j.neuroimage.2016.04.053
The quantification of local surface morphology in the human cortex is important for examining population differences as well as developmental changes in neurodegenerative or neurodevelopmental disorders. We propose a novel cortical shape measure, referred to as the 'shape complexity index' (SCI), that represents localized shape complexity as the difference between the observed distributions of local surface topology, as quantified by the shape index (SI) measure, to its best fitting simple topological model within a given neighborhood. We apply a relatively small, adaptive geodesic kernel to calculate the SCI. Due to the small size of the kernel, the proposed SCI measure captures fine differences of cortical shape. With this novel cortical feature, we aim to capture comparatively small local surface changes that capture a) the widening versus deepening of sulcal and gyral regions, as well as b) the emergence and development of secondary and tertiary sulci. Current cortical shape measures, such as the gyrification index (GI) or intrinsic curvature measures, investigate the cortical surface at a different scale and are less well suited to capture these particular cortical surface changes. In our experiments, the proposed SCI demonstrates higher complexity in the gyral/sulcal wall regions, lower complexity in wider gyral ridges and lowest complexity in wider sulcal fundus regions. In early postnatal brain development, our experiments show that SCI reveals a pattern of increased cortical shape complexity with age, as well as sexual dimorphisms in the insula, middle cingulate, parieto-occipital sulcal and Broca's regions. Overall, sex differences were greatest at 6months of age and were reduced at 24months, with the difference pattern switching from higher complexity in males at 6months to higher complexity in females at 24months. This is the first study of longitudinal, cortical complexity maturation and sex differences, in the early postnatal period from 6 to 24months of age with fine scale, cortical shape measures. These results provide information that complement previous studies of gyrification index in early brain development.
M. Larsen, K. Moreland, C.R. Johnson,, H. Childs.
“Optimizing Multi-Image Sort-Last Parallel Rendering,” In Symposium on Large Data Analysis and Visualization, IEEE, 2016.
Sort-last parallel rendering can be improved by considering the rendering of multiple images at a time. Most parallel rendering algorithms consider the generation of only a single image. This makes sense when performing interactive rendering where the parameters of each rendering are not known until the previous rendering completes. However, in situ visualization often generates multiple images that do not need to be created sequentially. In this paper we present a simple and effective approach to improving parallel image generation throughput by amortizing the load and overhead among multiple image renders. Additionally, we validate our approach by conducting a performance study exploring the achievable speed-ups in a variety of image-based in situ use cases and rendering workloads. On average, our approach shows a 1.5 to 3.7 fold improvement in performance, and in some cases, shows a 10 fold improvement.
T. Liu, S.M. Seyedhosseini, T. Tasdizen.
“Image Segmentation Using Hierarchical Merge Tree,” In IEEE Transactions on Image Processing, Vol. 25, No. 10, IEEE, pp. 4596--4607. Oct, 2016.
DOI: 10.1109/tip.2016.2592704
This paper investigates one of the most fundamental computer vision problems: image segmentation. We propose a supervised hierarchical approach to object-independent image segmentation. Starting with oversegmenting superpixels, we use a tree structure to represent the hierarchy of region merging, by which we reduce the problem of segmenting image regions to finding a set of label assignment to tree nodes. We formulate the tree structure as a constrained conditional model to associate region merging with likelihoods predicted using an ensemble boundary classifier. Final segmentations can then be inferred by finding globally optimal solutions to the model efficiently. We also present an iterative training and testing algorithm that generates various tree structures and combines them to emphasize accurate boundaries by segmentation accumulation. Experiment results and comparisons with other recent methods on six public datasets demonstrate that our approach achieves the state-of-the-art region accuracy and is competitive in image segmentation without semantic priors.
T. Liu, M. Zhang, M. Javanmardi , N. Ramesh, T. Tasdizen.
“SSHMT: Semi-supervised Hierarchical Merge Tree for Electron Microscopy Image Segmentation,” In Lecture Notes in Computer Science, Vol. 9905, Springer International Publishing, pp. 144--159. 2016.
DOI: 10.1007/978-3-319-46448-0_9
Region-based methods have proven necessary for improving segmentation accuracy of neuronal structures in electron microscopy (EM) images. Most region-based segmentation methods use a scoring function to determine region merging. Such functions are usually learned with supervised algorithms that demand considerable ground truth data, which are costly to collect. We propose a semi-supervised approach that reduces this demand. Based on a merge tree structure, we develop a differentiable unsupervised loss term that enforces consistent predictions from the learned function. We then propose a Bayesian model that combines the supervised and the unsupervised information for probabilistic learning. The experimental results on three EM data sets demonstrate that by using a subset of only 3% to 7% of the entire ground truth data, our approach consistently performs close to the state-of-the-art supervised method with the full labeled data set, and significantly outperforms the supervised method with the same labeled subset.
P. Ljung, J. Krüger, E. Gröller, M. Hadwiger, C. D. Hansen,, A. Ynnerman.
“State of the Art in Transfer Functions for Direct Volume Rendering,” In Computer Graphics Forum, Vol. 35, No. 3, Wiley-Blackwell, pp. 669--691. June, 2016.
DOI: 10.1111/cgf.12934
A central topic in scientific visualization is the transfer function (TF) for volume rendering. The TF serves a fundamental role in translating scalar and multivariate data into color and opacity to express and reveal the relevant features present in the data studied. Beyond this core functionality, TFs also serve as a tool for encoding and utilizing domain knowledge and as an expression for visual design of material appearances. TFs also enable interactive volumetric exploration of complex data. The purpose of this state-of-the-art report (STAR) is to provide an overview of research into the various aspects of TFs, which lead to interpretation of the underlying data through the use of meaningful visual representations. The STAR classifies TF research into the following aspects: dimensionality, derived attributes, aggregated attributes, rendering aspects, automation, and user interfaces. The STAR concludes with some interesting research challenges that form the basis of an agenda for the development of next generation TF tools and methodologies.
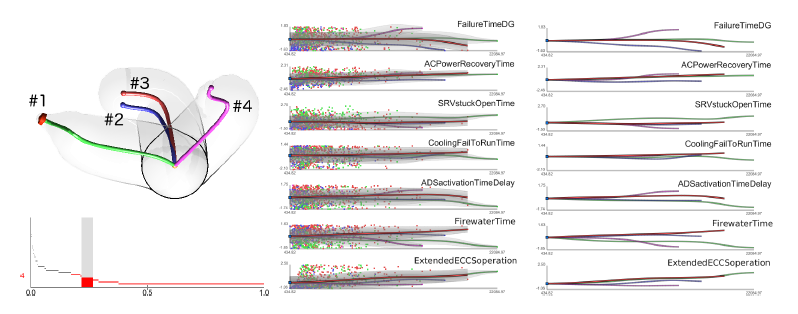
D. Maljovec, S. Liu, Bei Wang, V. Pascucci, P. T. Bremer, D. Mandelli, C. Smith..
“Analyzing Simulation-Based PRA Data Through Traditional and Topological Clustering: A BWR Station Blackout Case Study,” In Reliability Engineering & System Safety, Vol. 145, Elsevier, pp. 262--276. January, 2016.
DOI: 10.1016/j.ress.2015.07.001
F. Mesadi, M. Cetin, T. Tasdizen.
“Disjunctive normal level set: An efficient parametric implicit method,” In 2016 IEEE International Conference on Image Processing (ICIP), IEEE, September, 2016.
DOI: 10.1109/icip.2016.7533171
Level set methods are widely used for image segmentation because of their capability to handle topological changes. In this paper, we propose a novel parametric level set method called Disjunctive Normal Level Set (DNLS), and apply it to both two phase (single object) and multiphase (multi-object) image segmentations. The DNLS is formed by union of polytopes which themselves are formed by intersections of half-spaces. The proposed level set framework has the following major advantages compared to other level set methods available in the literature. First, segmentation using DNLS converges much faster. Second, the DNLS level set function remains regular throughout its evolution. Third, the proposed multiphase version of the DNLS is less sensitive to initialization, and its computational cost and memory requirement remains almost constant as the number of objects to be simultaneously segmented grows. The experimental results show the potential of the proposed method.
K. Moreland, C. Sewell, W. Usher, L. Lo, J. Meredith, D. Pugmire, J. Kress, H. Schroots, K. Ma, H. Childs, M. Larsen, C. Chen, R. Maynard, B. Geveci.
“VTK-m: Accelerating the Visualization Toolkit for Massively Threaded Architectures,” In IEEE Computer Graphics and Applications, Vol. 36, No. 3, pp. 48--58. May, 2016.
ISSN: 0272-1716
DOI: 10.1109/MCG.2016.48
Traditional scientific visualization software approaches do not fare well in massively threaded environments. To address the needs of the high-performance computing community, the VTK-m framework fills the gaps in functionality by bringing together the most recent research.
P. Muralidharan, J. Fishbaugh, E. Y. Kim, H. J. Johnson, J. S. Paulsen, G. Gerig, P. T. Fletcher.
“Bayesian Covariate Selection in Mixed Effects Models for Longitudinal Shape Analysis,” In International Symposium on Biomedical Imaging (ISBI), IEEE, April, 2016.
DOI: 10.1109/isbi.2016.7493352
The goal of longitudinal shape analysis is to understand how anatomical shape changes over time, in response to biological processes, including growth, aging, or disease. In many imaging studies, it is also critical to understand how these shape changes are affected by other factors, such as sex, disease diagnosis, IQ, etc. Current approaches to longitudinal shape analysis have focused on modeling age-related shape changes, but have not included the ability to handle covariates. In this paper, we present a novel Bayesian mixed-effects shape model that incorporates simultaneous relationships between longitudinal shape data and multiple predictors or covariates to the model. Moreover, we place an Automatic Relevance Determination (ARD) prior on the parameters, that lets us automatically select which covariates are most relevant to the model based on observed data. We evaluate our proposed model and inference procedure on a longitudinal study of Huntington's disease from PREDICT-HD. We first show the utility of the ARD prior for model selection in a univariate modeling of striatal volume, and next we apply the full high-dimensional longitudinal shape model to putamen shapes.
C. Partl, S. Gratzl, M. Streit, A. Wassermann, H. Pfister, D. Schmalstieg, A. Lex.
“Pathfinder: Visual Analysis of Paths in Graphs,” In Computer Graphics Forum (EuroVis '16), Vol. 35, No. 3, pp. 71-80. jun, 2016.
ISSN: 1467-8659
DOI: 10.1111/cgf.12883
The analysis of paths in graphs is highly relevant in many domains. Typically, path-related tasks are performed in node-link layouts. Unfortunately, graph layouts often do not scale to the size of many real world networks. Also, many networks are multivariate, i.e., contain rich attribute sets associated with the nodes and edges. These attributes are often critical in judging paths, but directly visualizing attributes in a graph layout exacerbates the scalability problem. In this paper, we present visual analysis solutions dedicated to path-related tasks in large and highly multivariate graphs. We show that by focusing on paths, we can address the scalability problem of multivariate graph visualization, equipping analysts with a powerful tool to explore large graphs. We introduce Pathfinder, a technique that provides visual methods to query paths, while considering various constraints. The resulting set of paths is visualized in both a ranked list and as a node-link diagram. For the paths in the list, we display rich attribute data associated with nodes and edges, and the node-link diagram provides topological context. The paths can be ranked based on topological properties, such as path length or average node degree, and scores derived from attribute data. Pathfinder is designed to scale to graphs with tens of thousands of nodes and edges by employing strategies such as incremental query results. We demonstrate Pathfinder's fitness for use in scenarios with data from a coauthor network and biological pathways.
Y. Pathak, O. Salami, S. Baillet, Z. Li, C.R. Butson.
“Longitudinal Changes in Depressive Circuitry in Response to Neuromodulation Therapy,” In Frontiers in Neural Circuits, Vol. 10, rontiers Media SA, July, 2016.
DOI: 10.3389/fncir.2016.00050
BACKGROUND:
Major depressive disorder (MDD) is a public health problem worldwide. There is increasing interest in using non-invasive therapies such as repetitive transcranial magnetic stimulation (rTMS) to treat MDD. However, the changes induced by rTMS on neural circuits remain poorly characterized. The present study aims to test whether the brain regions previously targeted by deep brain stimulation (DBS) in the treatment of MDD respond to rTMS, and whether functional connectivity (FC) measures can predict clinical response.
METHODS:
rTMS (20 sessions) was administered to five MDD patients at the left-dorsolateral prefrontal cortex (L-DLPFC) over 4 weeks. Magnetoencephalography (MEG) recordings and Montgomery-Asberg depression rating scale (MADRS) assessments were acquired before, during and after treatment. Our primary measures, obtained with MEG source imaging, were changes in power spectral density (PSD) and changes in FC as measured using coherence.
RESULTS:
Of the five patients, four met the clinical response criterion (40% or greater decrease in MADRS) after 4 weeks of treatment. An increase in gamma power at the L-DLPFC was correlated with improvement in symptoms. We also found that increases in delta band connectivity between L-DLPFC/amygdala and L-DLPFC/pregenual anterior cingulate cortex (pACC), and decreases in gamma band connectivity between L-DLPFC/subgenual anterior cingulate cortex (sACC), were correlated with improvements in depressive symptoms.
CONCLUSIONS:
Our results suggest that non-invasive intervention techniques, such as rTMS, modulate the ongoing activity of depressive circuits targeted for DBS, and that MEG can capture these changes. Gamma oscillations may originate from GABA-mediated inhibition, which increases synchronization of large neuronal populations, possibly leading to increased long-range FC. We postulate that responses to rTMS could provide valuable insights into early evaluation of patient candidates for DBS surgery.
I.A. Polejaeva, R. Ranjan, C.J. Davies, M. Regouski, J. Hall, A.L. Olsen, Q. Meng, H.M. Rutigliano, D.J. Dosdall, N.A. Angel, F.B. Sachse, T. Seidel, A.J. Thomas, R. Stott, K.E. Panter, P.M. Lee, A.J. Van Wettere, J.R. Stevens, Z. Wang, R.S. Macleod, N.F. Marrouche, K.L. White.
“Increased Susceptibility to Atrial Fibrillation Secondary to Atrial Fibrosis in Transgenic Goats Expressing Transforming Growth Factor-β1,” In Journal of Cardiovascular Electrophysiology, Vol. 27, No. 10, Wiley-Blackwell, pp. 1220--1229. Aug, 2016.
DOI: 10.1111/jce.13049
Introduction
Large animal models of progressive atrial fibrosis would provide an attractive platform to study relationship between structural and electrical remodeling in atrial fibrillation (AF). Here we established a new transgenic goat model of AF with cardiac specific overexpression of TGF-β1 and investigated the changes in the cardiac structure and function leading to AF.
Methods and Results
Transgenic goats with cardiac specific overexpression of constitutively active TGF-β1 were generated by somatic cell nuclear transfer. We examined myocardial tissue, ECGs, echocardiographic data, and AF susceptibility in transgenic and wild-type control goats. Transgenic goats exhibited significant increase in fibrosis and myocyte diameters in the atria compared to controls, but not in the ventricles. P-wave duration was significantly greater in transgenic animals starting at 12 months of age, but no significant chamber enlargement was detected, suggesting conduction slowing in the atria. Furthermore, this transgenic goat model exhibited a significant increase in AF vulnerability. Six of 8 transgenic goats (75%) were susceptible to AF induction and exhibited sustained AF (>2 minutes), whereas none of 6 controls displayed sustained AF (P < 0.01). Length of induced AF episodes was also significantly greater in the transgenic group compared to controls (687 ± 212.02 seconds vs. 2.50 ± 0.88 seconds, P < 0.0001), but no persistent or permanent AF was observed.
Conclusion
A novel transgenic goat model with a substrate for AF was generated. In this model, cardiac overexpression of TGF-β1 led to an increase in fibrosis and myocyte size in the atria, and to progressive P-wave prolongation. We suggest that these factors underlie increased AF susceptibility.
M. Raj, M. Mirzargar, R. Kirby, R. Whitaker, J. Preston.
“Evaluating Shape Alignment via Ensemble Visualization,” In IEEE Computer Graphics and Applications, Vol. 36, No. 3, IEEE, pp. 60--71. May, 2016.
DOI: 10.1109/mcg.2015.70
The visualization of variability in surfaces embedded in 3D, which is a type of ensemble uncertainty visualization, provides a means of understanding the underlying distribution of a collection or ensemble of surfaces. This work extends the contour boxplot technique to 3D and evaluates it against an enumeration-style visualization of the ensemble members and other conventional visualizations used by atlas builders. The authors demonstrate the efficacy of using the 3D contour boxplot ensemble visualization technique to analyze shape alignment and variability in atlas construction and analysis as a real-world application.
I. Rodero, M. Parashar, A.G. Landge, S. Kumar, V. Pascucci,, P.T. Bremer.
“Evaluation of in-situ analysis strategies at scale for power efficiency and scalability,” In Cluster, Cloud and Grid Computing (CCGrid), 2016 16th IEEE/ACM International Symposium on, IEEE, pp. 156--164. 2016.
The increasing gap between available compute power and I/O capabilities is resulting in simulation pipelines running on leadership computing facilities being reformulated. In particular, in-situ processing is complementing conventional post-process analysis; however, it can be performed by using the same compute resources as the simulation or using secondary dedicated resources.
In this paper, we focus on three different in-situ analysis strategies, which use the same compute resources as the ongoing simulation but different data movement strategies. We evaluate the costs incurred by these strategies in terms of run time, scalability and power/energy consumption. Furthermore, we extrapolate power behavior to peta-scale and investigate different design choices through projections. Experimental evaluation at full machine scale on Titan supports that using fewer cores per node for in-situ analysis is the optimum choice in terms of scalability. Hence, further research effort should be devoted towards developing in-situ analysis techniques following this strategy in future high-end systems.
P. Rosen, B. Burton, K. Potter, C.R. Johnson.
“muView: A Visual Analysis System for Exploring Uncertainty in Myocardial Ischemia Simulations,” In Visualization in Medicine and Life Sciences III, Springer Nature, pp. 49--69. 2016.
DOI: 10.1007/978-3-319-24523-2_3
