
SCI Publications
2024
L.G. Johnson, J.D. Mozingo, P.R. Atkins, S. Schwab, A. Morris, S.Y. Elhabian, D.R. Wilson, H. Kim, A.E. Anderson.
“A framework for three-dimensional statistical shape modeling of the proximal femur in Legg–Calvé–Perthes disease,” In International Journal of Computer Assisted Radiology and Surgery, Springer Nature Switzerland, 2024.
Purpose
The pathomorphology of Legg–Calvé–Perthes disease (LCPD) is a key contributor to poor long-term outcomes such as hip pain, femoroacetabular impingement, and early-onset osteoarthritis. Plain radiographs, commonly used for research and in the clinic, cannot accurately represent the full extent of LCPD deformity. The purpose of this study was to develop and evaluate a methodological framework for three-dimensional (3D) statistical shape modeling (SSM) of the proximal femur in LCPD.
Methods
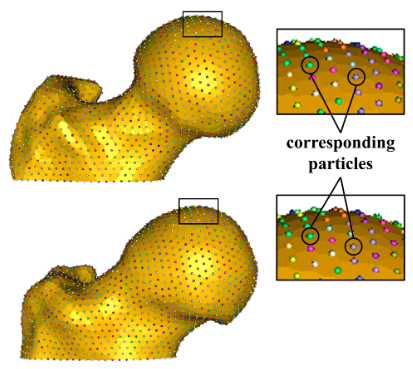
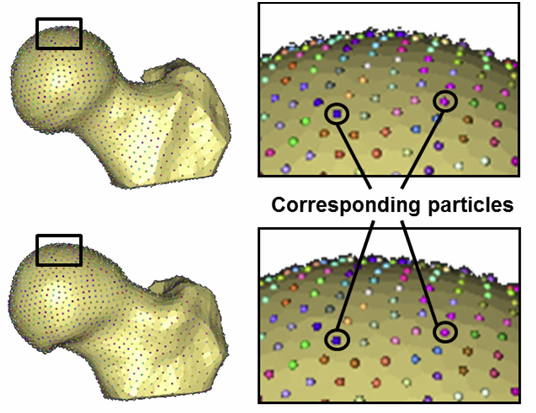
We developed a framework consisting of three core steps: segmentation, surface mesh preparation, and particle-based correspondence. The framework aims to address challenges in modeling this rare condition, characterized by highly heterogeneous deformities across a wide age range and small sample sizes. We evaluated this framework by producing a SSM from clinical magnetic resonance images of 13 proximal femurs with LCPD deformity from 11 patients between the ages of six and 12 years.
Results
After removing differences in scale and pose, the dominant shape modes described morphological features characteristic of LCPD, including a broad and flat femoral head, high-riding greater trochanter, and reduced neck-shaft angle. The first four shape modes were chosen for the evaluation of the model’s performance, together describing 87.5% of the overall cohort variance. The SSM was generalizable to unfamiliar examples with an average point-to-point reconstruction error below 1mm. We observed strong Spearman rank correlations (up to 0.79) between some shape modes, 3D measurements of femoral head asphericity, and clinical radiographic metrics.
Conclusion
In this study, we present a framework, based on SSM, for the objective description of LCPD deformity in three dimensions. Our methods can accurately describe overall shape variation using a small number of parameters, and are a step toward a widely accepted, objective 3D quantification of LCPD deformity.
2021
![]()
P. R. Atkins, P. Agrawal, J. D. Mozingo, K. Uemura, K. Tokunaga, C. L. Peters, S. Y. Elhabian, R. T. Whitaker, A. E. Anderson.
“Prediction of Femoral Head Coverage from Articulated Statistical Shape Models of Patients with Developmental Dysplasia of the Hip,” In Journal of Orthopaedic Research, Wiley, 2021.
DOI: 10.1002/jor.25227
Developmental dysplasia of the hip (DDH) is commonly described as reduced femoral head coverage due to anterolateral acetabular deficiency. Although reduced coverage is the defining trait of DDH, more subtle and localized anatomic features of the joint are also thought to contribute to symptom development and degeneration. These features are challenging to identify using conventional approaches. Herein, we assessed the morphology of the full femur and hemi-pelvis using an articulated statistical shape model (SSM). The model determined the morphological and pose-based variations associated with DDH in a population of Japanese females and established which of these variations predict coverage. Computed tomography images of 83 hips from 47 patients were segmented for input into a correspondence-based SSM. The dominant modes of variation in the model initially represented scale and pose. After removal of these factors through individual bone alignment, femoral version and neck-shaft angle, pelvic curvature, and acetabular version dominated the observed variation. Femoral head oblateness and prominence of the acetabular rim and various muscle attachment sites of the femur and hemi-pelvis were found to predict 3D CT-based coverage measurements (R2=0.5-0.7 for the full bones, R2=0.9 for the joint).
2019
![]()
P. R. Atkins, Y. Shin, P. Agrawal, S. Y. Elhabian, R. T. Whitaker, J. A. Weiss, S. K. Aoki, C. L. Peters, A. E. Anderson.
“Which Two-dimensional Radiographic Measurements of Cam Femoroacetabular Impingement Best Describe the Three-dimensional Shape of the Proximal Femur?,” In Clinical Orthopaedics and Related Research, Vol. 477, No. 1, 2019.
BACKGROUND:
Many two-dimensional (2-D) radiographic views are used to help diagnose cam femoroacetabular impingement (FAI), but there is little consensus as to which view or combination of views is most effective at visualizing the magnitude and extent of the cam lesion (ie, severity). Previous studies have used a single image from a sequence of CT or MR images to serve as a reference standard with which to evaluate the ability of 2-D radiographic views and associated measurements to describe the severity of the cam lesion. However, single images from CT or MRI data may fail to capture the apex of the cam lesion. Thus, it may be more appropriate to use measurements of three-dimensional (3-D) surface reconstructions from CT or MRI data to serve as an anatomic reference standard when evaluating radiographic views and associated measurements used in the diagnosis of cam FAI.
QUESTIONS/PURPOSES:
The purpose of this study was to use digitally reconstructed radiographs and 3-D statistical shape modeling to (1) determine the correlation between 2-D radiographic measurements of cam FAI and 3-D metrics of proximal femoral shape; and 2) identify the combination of radiographic measurements from plain film projections that were most effective at predicting the 3-D shape of the proximal femur.
METHODS:
This study leveraged previously acquired CT images of the femur from a convenience sample of 37 patients (34 males; mean age, 27 years, range, 16-47 years; mean body mass index [BMI], 24.6 kg/m, range, 19.0-30.2 kg/m) diagnosed with cam FAI imaged between February 2005 and January 2016. Patients were diagnosed with cam FAI based on a culmination of clinical examinations, history of hip pain, and imaging findings. The control group consisted of 59 morphologically normal control participants (36 males; mean age, 29 years, range, 15-55 years; mean BMI, 24.4 kg/m, range, 16.3-38.6 kg/m) imaged between April 2008 and September 2014. Of these controls, 30 were cadaveric femurs and 29 were living participants. All controls were screened for evidence of femoral deformities using radiographs. In addition, living control participants had no history of hip pain or previous surgery to the hip or lower limbs. CT images were acquired for each participant and the surface of the proximal femur was segmented and reconstructed. Surfaces were input to our statistical shape modeling pipeline, which objectively calculated 3-D shape scores that described the overall shape of the entire proximal femur and of the region of the femur where the cam lesion is typically located. Digital reconstructions for eight plain film views (AP, Meyer lateral, 45° Dunn, modified 45° Dunn, frog-leg lateral, Espié frog-leg, 90° Dunn, and cross-table lateral) were generated from CT data. For each view, measurements of the α angle and head-neck offset were obtained by two researchers (intraobserver correlation coefficients of 0.80-0.94 for the α angle and 0.42-0.80 for the head-neck offset measurements). The relationships between radiographic measurements from each view and the 3-D shape scores (for the entire proximal femur and for the region specific to the cam lesion) were assessed with linear correlation. Additionally, partial least squares regression was used to determine which combination of views and measurements was the most effective at predicting 3-D shape scores.
RESULTS:
Three-dimensional shape scores were most strongly correlated with α angle on the cross-table view when considering the entire proximal femur (r = -0.568; p < 0.001) and on the Meyer lateral view when considering the region of the cam lesion (r = -0.669; p < 0.001). Partial least squares regression demonstrated that measurements from the Meyer lateral and 90° Dunn radiographs produced the optimized regression model for predicting shape scores for the proximal femur (R = 0.405, root mean squared error of prediction [RMSEP] = 1.549) and the region of the cam lesion (R = 0.525, RMSEP = 1.150). Interestingly, views with larger differences in the α angle and head-neck offset between control and cam FAI groups did not have the strongest correlations with 3-D shape.
CONCLUSIONS:
Considered together, radiographic measurements from the Meyer lateral and 90° Dunn views provided the most effective predictions of 3-D shape of the proximal femur and the region of the cam lesion as determined using shape modeling metrics.
CLINICAL RELEVANCE:
Our results suggest that clinicians should consider using the Meyer lateral and 90° Dunn views to evaluate patients in whom cam FAI is suspected. However, the α angle and head-neck offset measurements from these and other plain film views could describe no more than half of the overall variation in the shape of the proximal femur and cam lesion. Thus, caution should be exercised when evaluating femoral head anatomy using the α angle and head-neck offset measurements from plain film radiographs. Given these findings, we believe there is merit in pursuing research that aims to develop the framework necessary to integrate statistical shape modeling into clinical evaluation, because this could aid in the diagnosis of cam FAI.
2016
![]()
P.R. Atkins, S.Y. Elhabian, P. Agrawal, M.D. Harris, R.T. Whitaker, J.A. Weiss, C.L. Peters, A.E. Anderson.
“Quantitative comparison of cortical bone thickness using correspondence-based shape modeling in patients with cam femoroacetabular impingement,” In Journal of Orthopaedic Research, Wiley-Blackwell, Nov, 2016.
DOI: 10.1002/jor.23468
The proximal femur is abnormally shaped in patients with cam-type femoroacetabular impingement (FAI). Impingement
may elicit bone remodeling at the proximal femur, causing increases in cortical bone thickness. We used correspondence-based shape modeling to quantify and compare cortical thickness between cam patients and controls for the location of the cam lesion and the proximal femur. Computed tomography images were segmented for 45 controls and 28 cam-type FAI patients. The segmentations were input to a correspondence-based shape model to identify the region of the cam lesion. Median cortical thickness data over the region of the cam lesion and the proximal femur were compared between mixed-gender and gender-specific groups. Median [interquartile range] thickness was significantly greater in FAI patients than controls in the cam lesion (1.47 [0.64] vs. 1.13 [0.22] mm, respectively; p < 0.001) and proximal femur (1.28 [0.30] vs. 0.97 [0.22] mm, respectively; p < 0.001). Maximum thickness in the region of the cam lesion was more anterior and less lateral (p < 0.001) in FAI patients. Male FAI patients had increased thickness compared to male controls in the cam lesion (1.47 [0.72] vs. 1.10 [0.19] mm, respectively; p < 0.001) and proximal femur (1.25 [0.29] vs. 0.94 [0.17] mm, respectively; p < 0.001). Thickness was not significantly different between male and female controls. Clinical significance: Studies of non-pathologic cadavers have provided guidelines regarding safe surgical resection depth for FAI patients. However, our results suggest impingement induces cortical thickening in cam patients, which may strengthen the proximal femur. Thus, these previously established guidelines may be too conservative.
2013
![]()
C.L. Abraham, S.A. Maas, J.A. Weiss, B.J. Ellis, C.L. Peters, A.E. Anderson.
“A new discrete element analysis method for predicting hip joint contact stresses,” In Journal of Biomechanics, Vol. 46, No. 6, pp. 1121--1127. 2013.
DOI: 10.1016/j.jbiomech.2013.01.012
![]()
M.D. Harris, S.P. Reese, C.L. Peters, J.A. Weiss, A.E. Anderson.
“Three-dimensional Quantification of Femoral Head Shape in Controls and Patients with Cam-type Femoroacetabular Impingement,” In Annals of Biomedical Engineering, Vol. 41, No. 6, pp. 1162--1171. 2013.
DOI: 10.1007/s10439-013-0762-1

![]()
M.D. Harris, M. Datar, R.T. Whitaker, E.R. Jurrus, C.L. Peters, A.E. Anderson.
“Statistical Shape Modeling of Cam Femoroacetabular Impingement,” In Journal of Orthopaedic Research, Vol. 31, No. 10, pp. 1620--1626. 2013.
DOI: 10.1002/jor.22389
C.R. Henak, A.E. Anderson, J.A. Weiss.
“Subject-specific analysis of joint contact mechanics: application to the study of osteoarthritis and surgical planning,” In Journal of Biomechanical Engineering, Vol. 135, No. 2, 2013.
DOI: 10.1115/1.4023386
PubMed ID: 23445048
Advances in computational mechanics, constitutive modeling, and techniques for subject-specific modeling have opened the door to patient-specific simulation of the relationships between joint mechanics and osteoarthritis (OA), as well as patient-specific preoperative planning. This article reviews the application of computational biomechanics to the simulation of joint contact mechanics as relevant to the study of OA. This review begins with background regarding OA and the mechanical causes of OA in the context of simulations of joint mechanics. The broad range of technical considerations in creating validated subject-specific whole joint models is discussed. The types of computational models available for the study of joint mechanics are reviewed. The types of constitutive models that are available for articular cartilage are reviewed, with special attention to choosing an appropriate constitutive model for the application at hand. Issues related to model generation are discussed, including acquisition of model geometry from volumetric image data and specific considerations for acquisition of computed tomography and magnetic resonance imaging data. Approaches to model validation are reviewed. The areas of parametric analysis, factorial design, and probabilistic analysis are reviewed in the context of simulations of joint contact mechanics. Following the review of technical considerations, the article details insights that have been obtained from computational models of joint mechanics for normal joints; patient populations; the study of specific aspects of joint mechanics relevant to OA, such as congruency and instability; and preoperative planning. Finally, future directions for research and application are summarized.
![]()
C.R. Henak, Carruth E, A.E. Anderson, M.D. Harris, B.J. Ellis, C.L. Peters, J.A. Weiss.
“Finite element predictions of cartilage contact mechanics in hips with retroverted acetabula,” In Osteoarthritis and Cartilage, Vol. 21, pp. 1522-1529. 2013.
DOI: 10.1016/j.joca.2013.06.008
Background
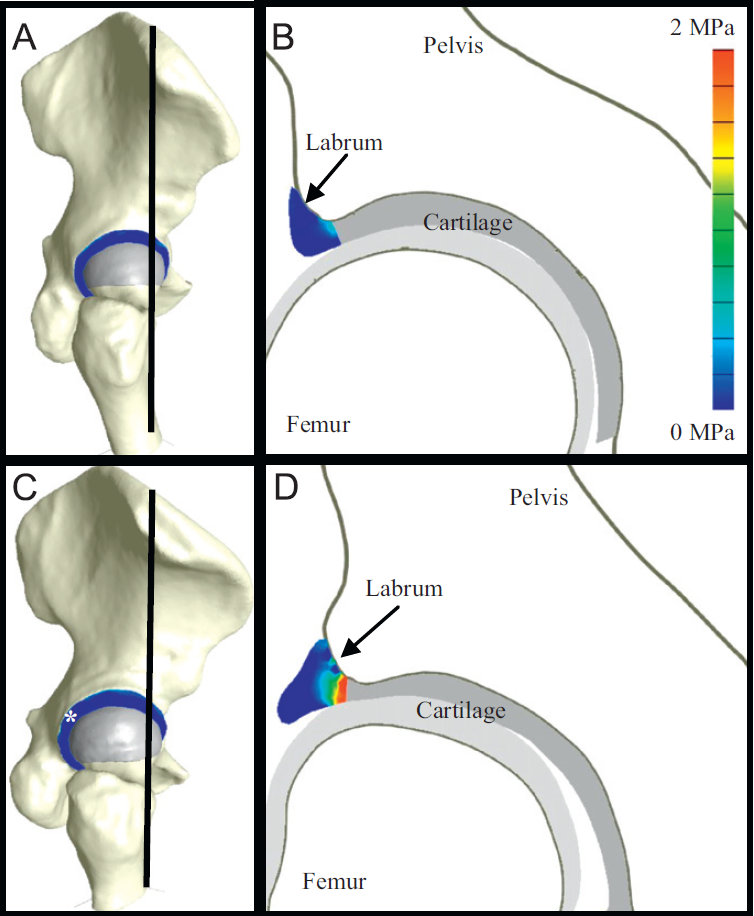
A contributory factor to hip osteoarthritis (OA) is abnormal cartilage mechanics. Acetabular retroversion, a version deformity of the acetabulum, has been postulated to cause OA via decreased posterior contact area and increased posterior contact stress. Although cartilage mechanics cannot be measured directly in vivo to evaluate the causes of OA, they can be predicted using finite element (FE) modeling.
Objective
The objective of this study was to compare cartilage contact mechanics between hips with normal and retroverted acetabula using subject-specific FE modeling.
Methods
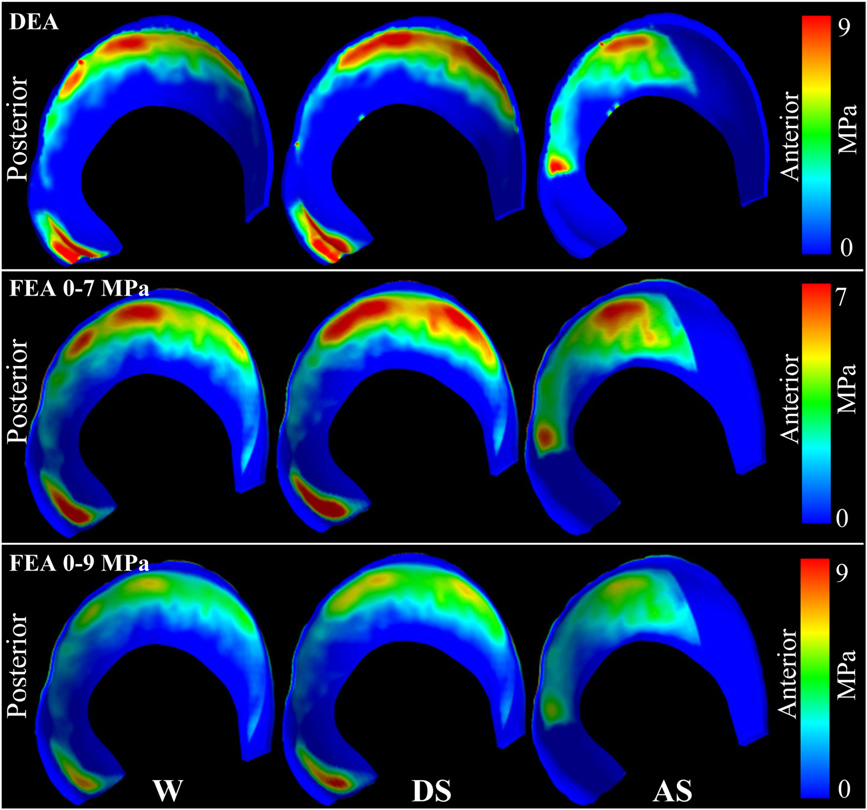
Twenty subjects were recruited and imaged: 10 with normal acetabula and 10 with retroverted acetabula. FE models were constructed using a validated protocol. Walking, stair ascent, stair descent and rising from a chair were simulated. Acetabular cartilage contact stress and contact area were compared between groups.
Results
Retroverted acetabula had superomedial cartilage contact patterns, while normal acetabula had widely distributed cartilage contact patterns. In the posterolateral acetabulum, average contact stress and contact area during walking and stair descent were 2.6–7.6 times larger in normal than retroverted acetabula (P ≤ 0.017). Conversely, in the superomedial acetabulum, peak contact stress during walking was 1.2–1.6 times larger in retroverted than normal acetabula (P ≤ 0.044). Further differences varied by region and activity.
Conclusions
This study demonstrated superomedial contact patterns in retroverted acetabula vs widely distributed contact patterns in normal acetabula. Smaller posterolateral contact stress in retroverted acetabula than in normal acetabula suggests that increased posterior contact stress alone may not be the link between retroversion and OA.
C.R. Henak, A.K. Kapron, B.J. Ellis, S.A. Maas, A.E. Anderson, J.A. Weiss.
“Specimen-specific predictions of contact stress under physiological loading in the human hip: validation and sensitivity studies,” In Biomechanics and Modeling in Mechanobiology, pp. 1-14. 2013.
DOI: 10.1007/s10237-013-0504-1
Hip osteoarthritis may be initiated and advanced by abnormal cartilage contact mechanics, and finite element (FE) modeling provides an approach with the potential to allow the study of this process. Previous FE models of the human hip have been limited by single specimen validation and the use of quasi-linear or linear elastic constitutive models of articular cartilage. The effects of the latter assumptions on model predictions are unknown, partially because data for the instantaneous behavior of healthy human hip cartilage are unavailable. The aims of this study were to develop and validate a series of specimen-specific FE models, to characterize the regional instantaneous response of healthy human hip cartilage in compression, and to assess the effects of material nonlinearity, inhomogeneity and specimen-specific material coefficients on FE predictions of cartilage contact stress and contact area. Five cadaveric specimens underwent experimental loading, cartilage material characterization and specimen-specific FE modeling. Cartilage in the FE models was represented by average neo-Hookean, average Veronda Westmann and specimen- and region-specific Veronda Westmann hyperelastic constitutive models. Experimental measurements and FE predictions compared well for all three cartilage representations, which was reflected in average RMS errors in contact stress of less than 25 %. The instantaneous material behavior of healthy human hip cartilage varied spatially, with stiffer acetabular cartilage than femoral cartilage and stiffer cartilage in lateral regions than in medial regions. The Veronda Westmann constitutive model with average material coefficients accurately predicted peak contact stress, average contact stress, contact area and contact patterns. The use of subject- and region-specific material coefficients did not increase the accuracy of FE model predictions. The neo-Hookean constitutive model underpredicted peak contact stress in areas of high stress. The results of this study support the use of average cartilage material coefficients in predictions of cartilage contact stress and contact area in the normal hip. The regional characterization of cartilage material behavior provides the necessary inputs for future computational studies, to investigate other mechanical parameters that may be correlated with OA and cartilage damage in the human hip. In the future, the results of this study can be applied to subject-specific models to better understand how abnormal hip contact stress and contact area contribute to OA.
2012
A. Barg, M.D. Harris, H.B. Henninger, R.L. Amendola, C.L. Saltzman, B. Hintermann, A.E. Anderson.
“Medial distal tibial angle: comparison between weightbearing mortise view and hindfoot alignment view,” In Foot & Ankle International, Vol. 33, No. 8, pp. 655--661. 2012.
DOI: 10.3113/FAI.2012.0655
Background: The medial distal tibial angle (MDTA) is used to determine ankle alignment. The mortise view is the standard to measure MDTA, but the hindfoot alignment view (HAV) has become popular. The MDTA may vary between views, influencing the choice of surgery.
Methods: The MDTA was compared between the mortise and HAV in 146 ankles. MDTA was correlated to age and sagittal tibial tilt for each view. Differences in MDTA by gender and ethnicity were assessed. Diagnostic agreement (varus, valgus, normal) between views was calculated. Clinical assessment of alignment was determined and percent agreement between clinical and radiographic alignment was quantified.
Results: The MDTA measured from the mortise view and HAV radiographs was 89.0 (range, 81 to 96 degrees; SD = 2.8) degrees and 86.0 (range, 73 to 95 degrees; SD = 3.5) degrees, respectively. The MDTA was comparable for both genders for mortise (p = 0.356) and HAV (p = 0.621). The MDTA was comparable in all ethnic groups for mortise view (p = 0.616) and HAV (p = 0.916). Correlation between the measured MDTA and age was not statistically significant for both the mortise (r = 0.118; p = 0.158) and HAV (r = 0.148; p = 0.074). In only 47.3% of all ankles was the radiographic diagnosis of alignment the same between views. Agreement between clinical and radiographic classifications was 60.3% for the mortise view and 52.8% for the HAV.
Conclusion: Substantial disagreement in primary alignment was found between the mortise and HAV as quantified by the MDTA. Agreement between clinical and radiographic alignment was also poor. Clinical Relevance: Advanced imaging such as CT or MRI may better describe ankle alignment.
![]()
B.J. Hansen, M.D. Harris, L.A. Anderson, C.L. Peters, J.A. Weiss, A.E. Anderson.
“Correlation between radiographic measures of acetabular morphology with 3D femoral head coverage in patients with acetabular retroversion,” In Acta Orthopaedica, Vol. 83, No. 3, pp. 233--239. 2012.
DOI: 10.3109/17453674.2012.684138
Background and purpose
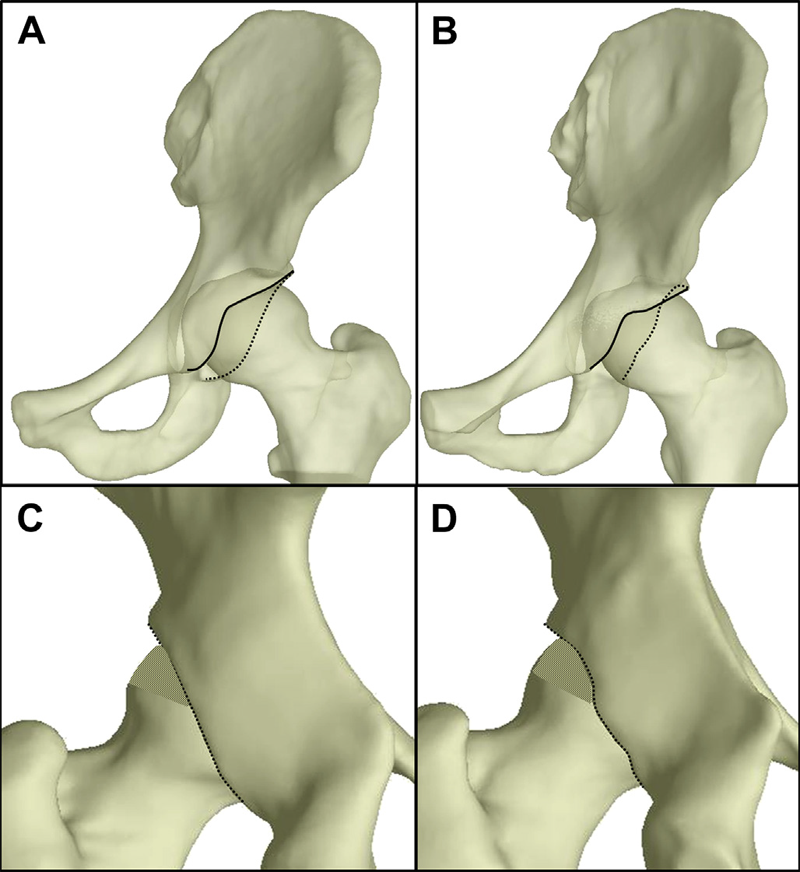
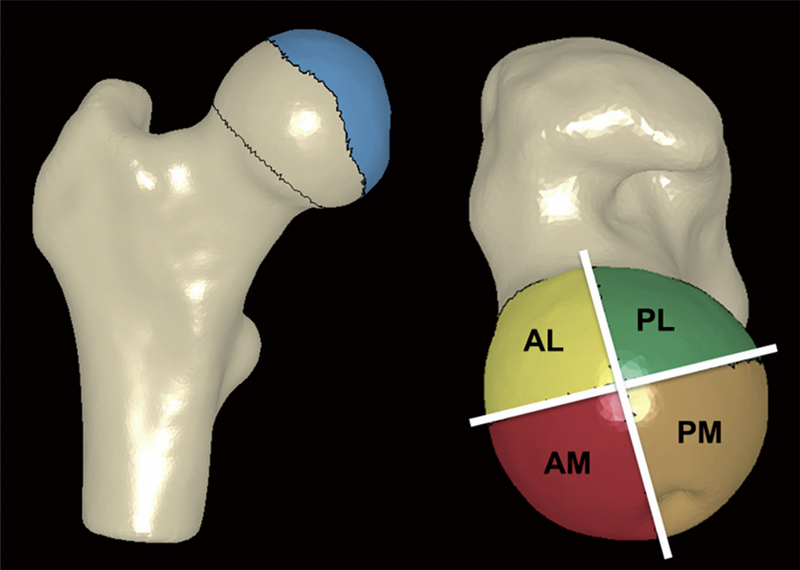
Acetabular retroversion may result in anterior acetabular over-coverage and posterior deficiency. It is unclear how standard radiographic measures of retroversion relate to measurements from 3D models, generated from volumetric CT data. We sought to: (1) compare 2D radiographic measurements between patients with acetabular retroversion and normal control subjects, (2) compare 3D measurements of total and regional femoral head coverage between patients and controls, and (3) quantify relationships between radiographic measurements of acetabular retroversion to total and regional coverage of the femoral head.
Patients and methods
For 16 patients and 18 controls we measured the extrusion index, crossover ratio, acetabular angle, acetabular index, lateral center edge angle, and a new measurement termed the "posterior wall distance". 3D femoral coverage was determined from volumetric CT data using objectively defined acetabular rim projections, head-neck junctions, and 4 anatomic regions. For radiographic measurements, intra-observer and inter-observer reliabilities were evaluated and associations between 2D radiographic and 3D model-based measures were determined.
Results
Compared to control subjects, patients with acetabular retroversion had a negative posterior wall distance, increased extrusion index, and smaller lateral center edge angle. Differences in the acetabular index between groups approached statistical significance. The acetabular angle was similar between groups. Acetabular retroversion was associated with a slight but statistically significant increase in anterior acetabular coverage, especially in the anterolateral region. Retroverted hips had substantially less posterior coverage, especially in the posterolateral region.
Interpretation
We found that a number of 2D radiographic measures of acetabular morphology were correlated with 3D model-based measures of total and regional femoral head coverage. These correlations may be used to assist in the diagnosis of retroversion and for preoperative planning.
![]()
M.D. Harris, M. Datar, E. Jurrus, C.L. Peters, R.T. Whitaker, A.E. Anderson.
“Statistical Shape Modeling of CAM-type Femoroacetabular Impingement,” In Proceedings of the International Symposium on Computer Methods in Biomechanics and Biomedical Engineering (CMBBE 2012), 2012.
![]()
M.D. Harris, A.E. Anderson, C.R. Henak, B.J. Ellis, C.L. Peters, J.A. Weiss.
“Finite element prediction of cartilage contact stresses in normal human hips,” In Journal of Orthopaedic Research, Vol. 30, No. 7, pp. 1133--1139. 2012.
DOI: 10.1002/jor.22040

Keywords: hip, finite element, biomechanics, cartilage contact stresses, cartilage pressure
![]()
H.B. Henninger, Barg A, A.E. Anderson, K.N. Bachus, R.Z. Tashjian, R.T. Burks.
“Effect of deltoid tension and humeral version in reverse total shoulder arthroplasty: a biomechanical study,” In Journal of Shoulder and Elbow Surgery, Vol. 21, No. 4, pp. 483–-490. 2012.
DOI: 10.1016/j.jse.2011.01.040
Background
No clear recommendations exist regarding optimal humeral component version and deltoid tension in reverse total shoulder arthroplasty (TSA).
Materials and methods
A biomechanical shoulder simulator tested humeral versions (0°, 10°, 20° retroversion) and implant thicknesses (-3, 0, +3 mm from baseline) after reverse TSA in human cadavers. Abduction and external rotation ranges of motion as well as abduction and dislocation forces were quantified for native arms and arms implanted with 9 combinations of humeral version and implant thickness.
Results
Resting abduction angles increased significantly (up to 30°) after reverse TSA compared with native shoulders. With constant posterior cuff loads, native arms externally rotated 20°, whereas no external rotation occurred in implanted arms (20° net internal rotation). Humeral version did not affect rotational range of motion but did alter resting abduction. Abduction forces decreased 30% vs native shoulders but did not change when version or implant thickness was altered. Humeral center of rotation was shifted 17 mm medially and 12 mm inferiorly after implantation. The force required for lateral dislocation was 60% less than anterior and was not affected by implant thickness or version.
Conclusion
Reverse TSA reduced abduction forces compared with native shoulders and resulted in limited external rotation and abduction ranges of motion. Because abduction force was reduced for all implants, the choice of humeral version and implant thickness should focus on range of motion. Lateral dislocation forces were less than anterior forces; thus, levering and inferior/posterior impingement may be a more probable basis for dislocation (laterally) than anteriorly directed forces.
Keywords: Shoulder, reverse arthroplasty, deltoid tension, humeral version, biomechanical simulator
![]()
H.B. Henninger, A. Barg, A.E. Anderson, K.N. Bachus, R.T. Burks, R.Z. Tashjian.
“Effect of lateral offset center of rotation in reverse total shoulder arthroplasty: a biomechanical study,” In Journal of Shoulder and Elbow Surgery, Vol. 21, No. 9, pp. 1128--1135. 2012.
DOI: 10.1016/j.jse.2011.07.034
Background
Lateral offset center of rotation (COR) reduces the incidence of scapular notching and potentially increases external rotation range of motion (ROM) after reverse total shoulder arthroplasty (rTSA). The purpose of this study was to determine the biomechanical effects of changing COR on abduction and external rotation ROM, deltoid abduction force, and joint stability.
Materials and methods
A biomechanical shoulder simulator tested cadaveric shoulders before and after rTSA. Spacers shifted the COR laterally from baseline rTSA by 5, 10, and 15 mm. Outcome measures of resting abduction and external rotation ROM, and abduction and dislocation (lateral and anterior) forces were recorded.
Results
Resting abduction increased 20° vs native shoulders and was unaffected by COR lateralization. External rotation decreased after rTSA and was unaffected by COR lateralization. The deltoid force required for abduction significantly decreased 25% from native to baseline rTSA. COR lateralization progressively eliminated this mechanical advantage. Lateral dislocation required significantly less force than anterior dislocation after rTSA, and both dislocation forces increased with lateralization of the COR.
Conclusion
COR lateralization had no influence on ROM (adduction or external rotation) but significantly increased abduction and dislocation forces. This suggests the lower incidence of scapular notching may not be related to the amount of adduction deficit after lateral offset rTSA but may arise from limited impingement of the humeral component on the lateral scapula due to a change in joint geometry. Lateralization provides the benefit of increased joint stability, but at the cost of increasing deltoid abduction forces.
Keywords: Shoulder simulator, reverse arthroplasty, lateral offset, center of rotation
2011
![]()
C.R. Henak, B.J. Ellis, M.D. Harris, A.E. Anderson, C.L. Peters, J.A. Weiss.
“Role of the acetabular labrum in load support across the hip joint,” In Journal of Biomechanics, Vol. 44, No. 12, pp. 2201-2206. 2011.
2010
![]()
A.E. Anderson, B.J. Ellis, S.A. Maas, J.A. Weiss.
“Effects of idealized joint geometry on finite element predictions of cartilage contact stresses in the hip,” In Journal of Biomechanics, Vol. 43, No. 7, pp. 1351--1357. May, 2010.
Computational models may have the ability to quantify the relationship between hip morphology, cartilage mechanics and osteoarthritis. Most models have assumed the hip joint to be a perfect ball and socket joint and have neglected deformation at the bone-cartilage interface. The objective of this study was to analyze finite element (FE) models of hip cartilage mechanics with varying degrees of simplified geometry and a model with a rigid bone material assumption to elucidate the effects on predictions of cartilage stress. A previously validated subject-specific FE model of a cadaveric hip joint was used as the basis for the models. Geometry for the bone-cartilage interface was either: (1) subject-specific (i.e. irregular), (2) spherical, or (3) a rotational conchoid. Cartilage was assigned either a varying (irregular) or constant thickness (smoothed). Loading conditions simulated walking, stair-climbing and descending stairs. FE predictions of contact stress for the simplified models were compared with predictions from the subject-specific model. Both spheres and conchoids provided a good approximation of native hip joint geometry (average fitting error ∼0.5 mm). However, models with spherical/conchoid bone geometry and smoothed articulating cartilage surfaces grossly underestimated peak and average contact pressures (50% and 25% lower, respectively) and overestimated contact area when compared to the subject-specific FE model. Models incorporating subject-specific bone geometry with smoothed articulating cartilage also underestimated pressures and predicted evenly distributed patterns of contact. The model with rigid bones predicted much higher pressures than the subject-specific model with deformable bones. The results demonstrate that simplifications to the geometry of the bone-cartilage interface, cartilage surface and bone material properties can have a dramatic effect on the predicted magnitude and distribution of cartilage contact pressures in the hip joint.
Keywords: mrl
2009
![]()
H.B. Henninger, S.P. Reese, A.E. Anderson, J.A. Weiss.
“Validation of computational models in biomechanics,” In Proceedings of the Institution of Mechanical Engineers, Part H: Journal of Engineering in Medicine, Vol. 224, No. 7, SAGE Publications, pp. 801--812. 2009.
2008
![]()
A.E. Anderson, B.J. Ellis, C.L. Peters, J.A. Weiss.
“Cartilage Thickness: Factors Influencing Multidetector CT Measurements in a Phantom Study,” In Radiology, Vol. 246, No. 1, pp. 133-141. 2008.
PubMed ID: 18982614
Page 1 of 2