
SCI Publications
2013
![]()
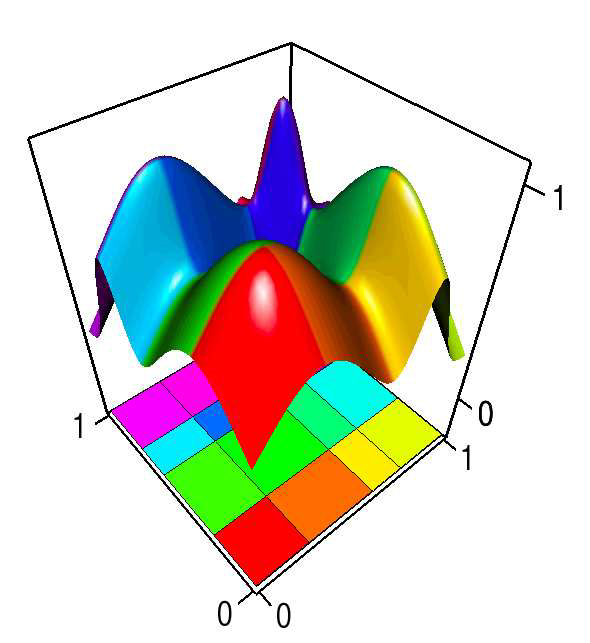
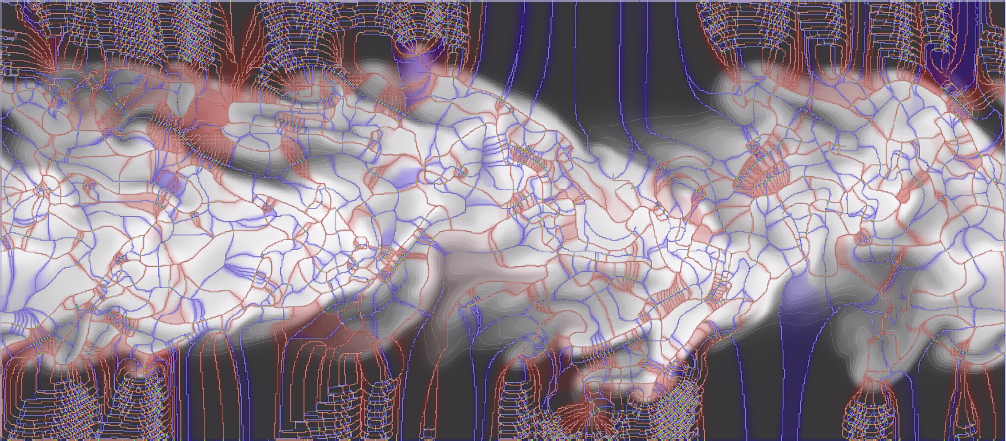
H. Bhatia, G. Norgard, V. Pascucci, P.-T. Bremer.
“Comments on the “Meshless Helmholtz-Hodge decomposition”,” In IEEE Transactions on Visualization and Computer Graphics, Vol. 19, No. 3, pp. 527--528. 2013.
DOI: 10.1109/TVCG.2012.62
The Helmholtz-Hodge decomposition (HHD) is one of the fundamental theorems of fluids describing the decomposition of a flow field into its divergence-free, curl-free and harmonic components. Solving for an HDD is intimately connected to the choice of boundary conditions which determine the uniqueness and orthogonality of the decomposition. This article points out that one of the boundary conditions used in a recent paper \"Meshless Helmholtz-Hodge decomposition\" [5] is, in general, invalid and provides an analytical example demonstrating the problem. We hope that this clarification on the theory will foster further research in this area and prevent undue problems in applying and extending the original approach.
![]()
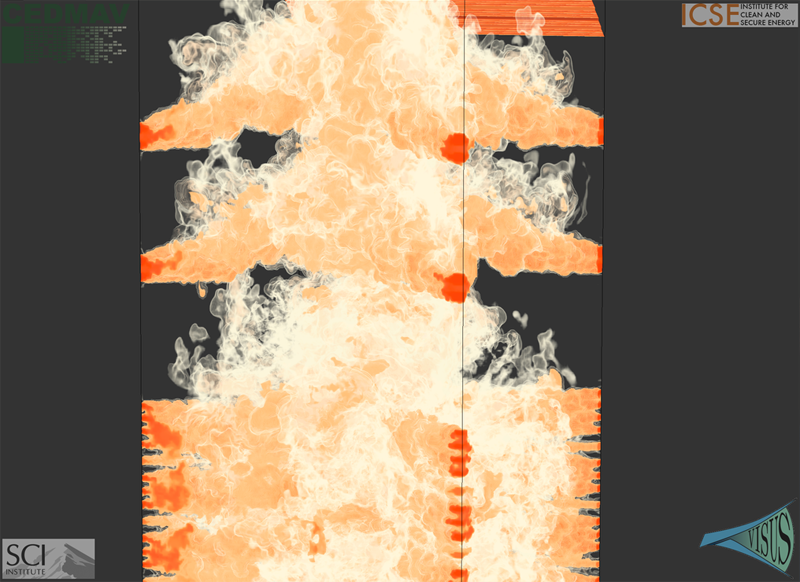
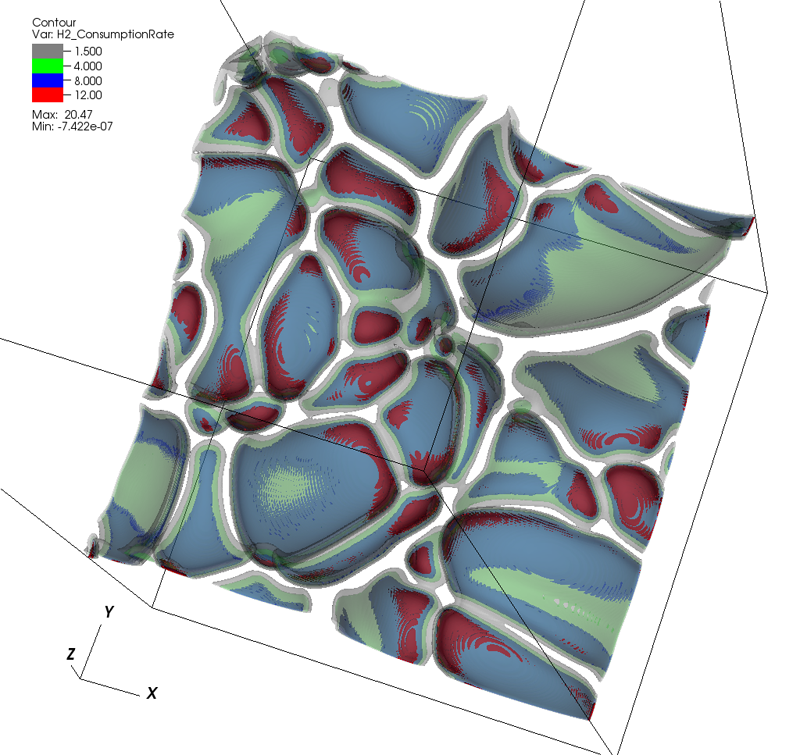
M. Gamell, I. Rodero, M. Parashar, J.C. Bennett, H. Kolla, J.H. Chen, P.-T. Bremer, A. Landge, A. Gyulassy, P. McCormick, Scott Pakin, Valerio Pascucci, Scott Klasky.
“Exploring Power Behaviors and Trade-offs of In-situ Data Analytics,” In Proceedings of the International Conference for High Performance Computing, Networking, Storage and Analysis, Association for Computing Machinery, 2013.
ISBN: 978-1-4503-2378-9
DOI: 10.1145/2503210.2503303
As scientific applications target exascale, challenges related to data and energy are becoming dominating concerns. For example, coupled simulation workflows are increasingly adopting in-situ data processing and analysis techniques to address costs and overheads due to data movement and I/O. However it is also critical to understand these overheads and associated trade-offs from an energy perspective. The goal of this paper is exploring data-related energy/performance trade-offs for end-to-end simulation workflows running at scale on current high-end computing systems. Specifically, this paper presents: (1) an analysis of the data-related behaviors of a combustion simulation workflow with an in-situ data analytics pipeline, running on the Titan system at ORNL; (2) a power model based on system power and data exchange patterns, which is empirically validated; and (3) the use of the model to characterize the energy behavior of the workflow and to explore energy/performance trade-offs on current as well as emerging systems.
Keywords: SDAV
![]()
S. Gerber, O. Reubel, P.-T. Bremer, V. Pascucci, R.T. Whitaker.
“Morse-Smale Regression,” In Journal of Computational and Graphical Statistics, Vol. 22, No. 1, pp. 193--214. 2013.
DOI: 10.1080/10618600.2012.657132
![]()
D. Maljovec, Bei Wang, V. Pascucci, P.-T. Bremer, M.Pernice, D. Mandelli, R. Nourgaliev.
“Exploration of High-Dimensional Scalar Function for Nuclear Reactor Safety Analysis and Visualization,” In Proceedings of the 2013 International Conference on Mathematics and Computational Methods Applied to Nuclear Science & Engineering (M&C), pp. 712-723. 2013.

Keywords: high-dimensional data analysis, computational topology, nuclear reactor safety analysis, visualization
![]()
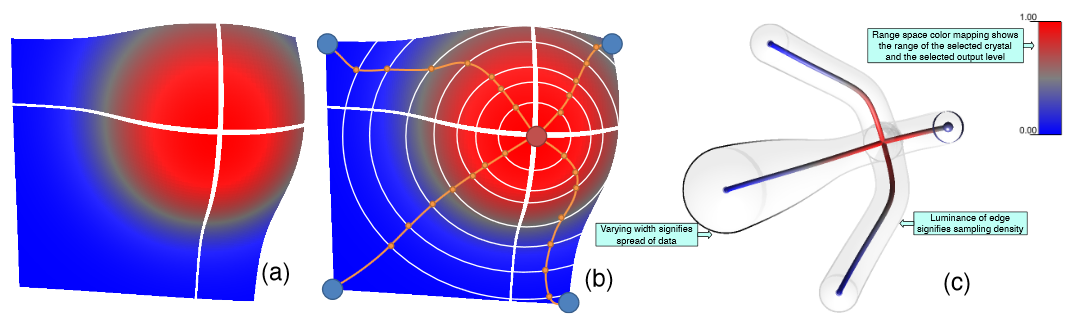
D. Maljovec, Bei Wang, D. Mandelli, P.-T. Bremer, V. Pascucci.
“Adaptive Sampling Algorithms for Probabilistic Risk Assessment of Nuclear Simulations,” In Proceedings of the 2013 International Topical Meeting on Probabilistic Safety Assessment and Analysis (PSA 2013), Note: First runner-up for Best Student Paper Award, 2013.
Nuclear simulations are often computationally expensive, time-consuming, and high-dimensional with respect to the number of input parameters. Thus exploring the space of all possible simulation outcomes is infeasible using finite computing resources. During simulation-based probabilistic risk analysis, it is important to discover the relationship between a potentially large number of input parameters and the output of a simulation using as few simulation trials as possible. This is a typical context for performing adaptive sampling where a few observations are obtained from the simulation, a surrogate model is built to represent the simulation space, and new samples are selected based on the model constructed. The surrogate model is then updated based on the simulation results of the sampled points. In this way, we attempt to gain the most information possible with a small number of carefully selected sampled points, limiting the number of expensive trials needed to understand features of the simulation space.
We analyze the specific use case of identifying the limit surface, i.e., the boundaries in the simulation space between system failure and system success. In this study, we explore several techniques for adaptively sampling the parameter space in order to reconstruct the limit surface. We focus on several adaptive sampling schemes. First, we seek to learn a global model of the entire simulation space using prediction models or neighborhood graphs and extract the limit surface as an iso-surface of the global model. Second, we estimate the limit surface by sampling in the neighborhood of the current estimate based on topological segmentations obtained locally.
Our techniques draw inspirations from topological structure known as the Morse-Smale complex. We highlight the advantages and disadvantages of using a global prediction model versus local topological view of the simulation space, comparing several different strategies for adaptive sampling in both contexts. One of the most interesting models we propose attempt to marry the two by obtaining a coarse global representation using prediction models, and a detailed local representation based on topology. Our methods are validated on several analytical test functions as well as a small nuclear simulation dataset modeled after a simplified Pressurized Water Reactor.
Keywords: high-dimensional data analysis, computational topology, nuclear reactor safety analysis, visualization
![]()
D. Maljovec, Bei Wang, D. Mandelli, P.-T. Bremer, V. Pascucci.
“Analyze Dynamic Probabilistic Risk Assessment Data through Clustering,” In Proceedings of the 2013 International Topical Meeting on Probabilistic Safety Assessment and Analysis (PSA 2013), 2013.
![]()
D. Maljovec, Bei Wang, A. Kupresanin, G. Johannesson, V. Pascucci, P.-T. Bremer.
“Adaptive Sampling with Topological Scores,” In Int. J. Uncertainty Quantification, Vol. 3, No. 2, Begell House, pp. 119--141. 2013.
DOI: 10.1615/int.j.uncertaintyquantification.2012003955
Understanding and describing expensive black box functions such as physical simulations is a common problem in many application areas. One example is the recent interest in uncertainty quantification with the goal of discovering the relationship between a potentially large number of input parameters and the output of a simulation. Typically, the simulation of interest is expensive to evaluate and thus the sampling of the parameter space is necessarily small. As a result choosing a "good" set of samples at which to evaluate is crucial to glean as much information as possible from the fewest samples. While space-filling sampling designs such as Latin hypercubes provide a good initial cover of the entire domain, more detailed studies typically rely on adaptive sampling: Given an initial set of samples, these techniques construct a surrogate model and use it to evaluate a scoring function which aims to predict the expected gain from evaluating a potential new sample. There exist a large number of different surrogate models as well as different scoring functions each with their own advantages and disadvantages. In this paper we present an extensive comparative study of adaptive sampling using four popular regression models combined with six traditional scoring functions compared against a space-filling design. Furthermore, for a single high-dimensional output function, we introduce a new class of scoring functions based on global topological rather than local geometric information. The new scoring functions are competitive in terms of the root mean squared prediction error but are expected to better recover the global topological structure. Our experiments suggest that the most common point of failure of adaptive sampling schemes are ill-suited regression models. Nevertheless, even given well-fitted surrogate models many scoring functions fail to outperform a space-filling design.
![]()
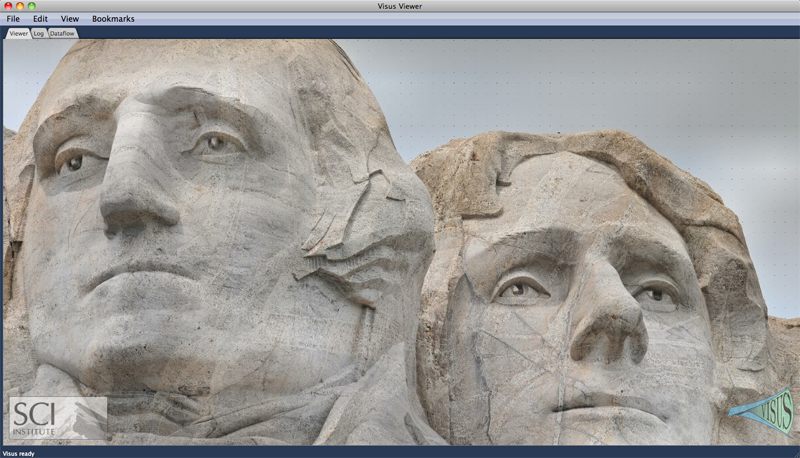
V. Pascucci, P.-T. Bremer, A. Gyulassy, G. Scorzelli, C. Christensen, B. Summa, S. Kumar.
“Scalable Visualization and Interactive Analysis Using Massive Data Streams,” In Cloud Computing and Big Data, Advances in Parallel Computing, Vol. 23, IOS Press, pp. 212--230. 2013.
Historically, data creation and storage has always outpaced the infrastructure for its movement and utilization. This trend is increasing now more than ever, with the ever growing size of scientific simulations, increased resolution of sensors, and large mosaic images. Effective exploration of massive scientific models demands the combination of data management, analysis, and visualization techniques, working together in an interactive setting. The ViSUS application framework has been designed as an environment that allows the interactive exploration and analysis of massive scientific models in a cache-oblivious, hardware-agnostic manner, enabling processing and visualization of possibly geographically distributed data using many kinds of devices and platforms.
For general purpose feature segmentation and exploration we discuss a new paradigm based on topological analysis. This approach enables the extraction of summaries of features present in the data through abstract models that are orders of magnitude smaller than the raw data, providing enough information to support general queries and perform a wide range of analyses without access to the original data.
Keywords: Visualization, data analysis, topological data analysis, Parallel I/O
![]()
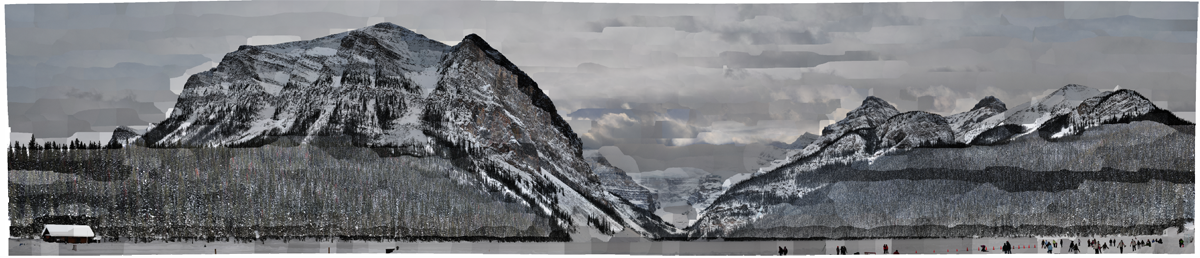
S. Philip, B. Summa, J. Tierny, P.-T. Bremer, V. Pascucci.
“Scalable Seams for Gigapixel Panoramas,” In Proceedings of the 2013 Eurographics Symposium on Parallel Graphics and Visualization, Note: Awarded Best Paper!, pp. 25--32. 2013.
DOI: 10.2312/EGPGV/EGPGV13/025-032
![]()
A. Rungta, B. Summa, D. Demir, P.-T. Bremer, V. Pascucci.
“ManyVis: Multiple Applications in an Integrated Visualization Environment,” In IEEE Transactions on Visualization and Computer Graphics (TVCG), Vol. 19, No. 12, pp. 2878--2885. December, 2013.
![]()
G.H. Weber, K. Beketayev, P.-T. Bremer, B. Hamann, M. Haranczyk, M. Hlawitschka, V. Pascucci.
“Comprehensible Presentation of Topological Information,” No. LBNL-5693E, Lawrence Berkeley National Laboratory, 2013.
2012
![]()
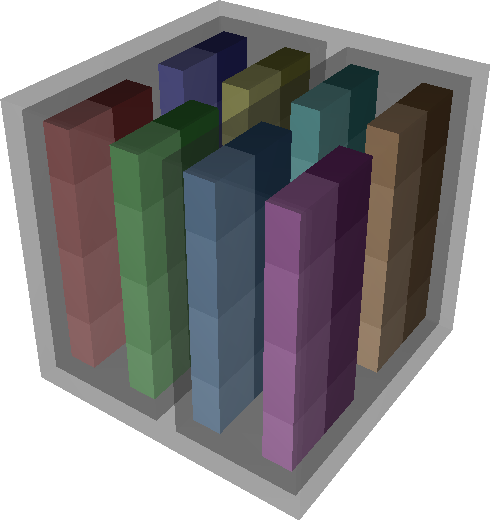
A. Bhatele, T. Gamblin, S.H. Langer, P.-T. Bremer, E.W. Draeger, B. Hamann, K.E. Isaacs, A.G. Landge, J.A. Levine, V. Pascucci, M. Schulz, C.H. Still.
“Mapping applications with collectives over sub-communicators on torus networks,” In Proceedings of Supercomputing 2012, pp. 1--11. 2012.
DOI: 10.1109/SC.2012.75
The placement of tasks in a parallel application on specific nodes of a supercomputer can significantly impact performance. Traditionally, this task mapping has focused on reducing the distance between communicating tasks on the physical network. This minimizes the number of hops that point-to-point messages travel and thus reduces link sharing between messages and contention. However, for applications that use collectives over sub-communicators, this heuristic may not be optimal. Many collectives can benefit from an increase in bandwidth even at the cost of an increase in hop count, especially when sending large messages. For example, placing communicating tasks in a cube configuration rather than a plane or a line on a torus network increases the number of possible paths messages might take. This increases the available bandwidth which can lead to significant performance gains.
We have developed Rubik, a tool that provides a simple and intuitive interface to create a wide variety of mappings for structured communication patterns. Rubik supports a number of elementary operations such as splits, tilts, or shifts, that can be combined into a large number of unique patterns. Each operation can be applied to disjoint groups of processes involved in collectives to increase the effective bandwidth. We demonstrate the use of Rubik for improving performance of two parallel codes, pF3D and Qbox, which use collectives over sub-communicators.
![]()
A. Gyulassy, P.-T. Bremer, V. Pascucci.
“Computing Morse-Smale Complexes with Accurate Geometry,” In IEEE Transactions on Visualization and Computer Graphics, Vol. 18, No. 12, pp. 2014--2022. 2012.
DOI: 10.1109/TVCG.2011.272
![]()
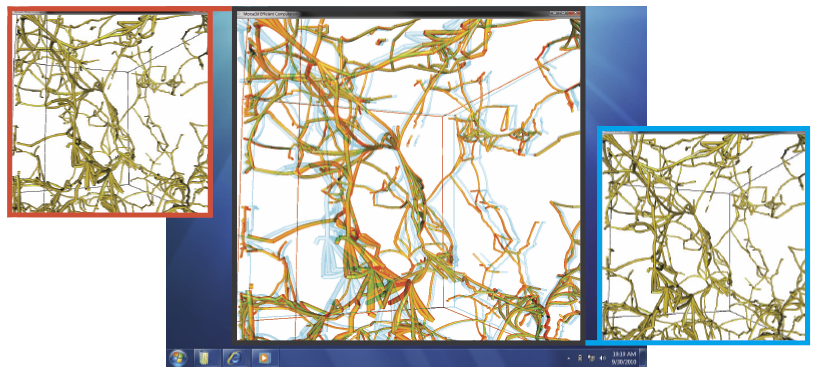
A.G. Landge, J.A. Levine, A. Bhatele, K.E. Isaacs, T. Gamblin, S. Langer, M. Schulz, P.-T. Bremer, V. Pascucci.
“Visualizing Network Traffic to Understand the Performance of Massively Parallel Simulations,” In IEEE Transactions on Visualization and Computer Graphics, Vol. 18, No. 12, IEEE, pp. 2467--2476. Dec, 2012.
DOI: 10.1109/TVCG.2012.286
The performance of massively parallel applications is often heavily impacted by the cost of communication among compute nodes. However, determining how to best use the network is a formidable task, made challenging by the ever increasing size and complexity of modern supercomputers. This paper applies visualization techniques to aid parallel application developers in understanding the network activity by enabling a detailed exploration of the flow of packets through the hardware interconnect. In order to visualize this large and complex data, we employ two linked views of the hardware network. The first is a 2D view, that represents the network structure as one of several simplified planar projections. This view is designed to allow a user to easily identify trends and patterns in the network traffic. The second is a 3D view that augments the 2D view by preserving the physical network topology and providing a context that is familiar to the application developers. Using the massively parallel multi-physics code pF3D as a case study, we demonstrate that our tool provides valuable insight that we use to explain and optimize pF3D’s performance on an IBM Blue Gene/P system.
![]()
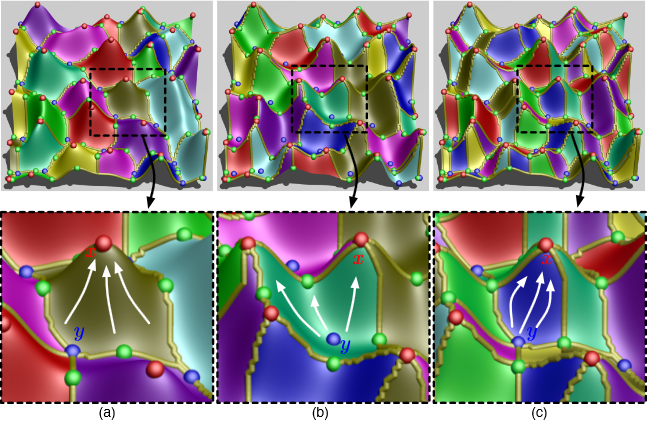
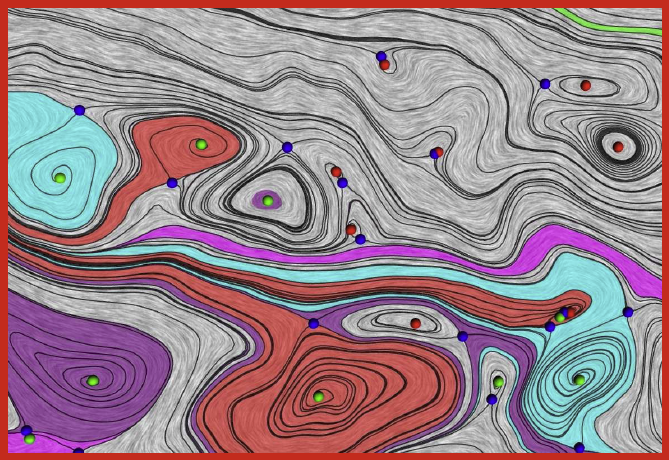
J.A. Levine, S. Jadhav, H. Bhatia, V. Pascucci, P.-T. Bremer.
“A Quantized Boundary Representation of 2D Flows,” In Computer Graphics Forum, Vol. 31, No. 3 Pt. 1, pp. 945--954. June, 2012.
DOI: 10.1111/j.1467-8659.2012.03087.x
![]()
S. Liu, J.A. Levine, P.-T. Bremer, V. Pascucci.
“Gaussian Mixture Model Based Volume Visualization,” In Proceedings of the IEEE Large-Scale Data Analysis and Visualization Symposium 2012, Note: Received Best Paper Award, pp. 73--77. 2012.
DOI: 10.1109/LDAV.2012.6378978

Keywords: Uncertainty Visualization, Volume Rendering, Gaussian Mixture Model, Ensemble Visualization
![]()
V. Pascucci, G. Scorzelli, B. Summa, P.-T. Bremer, A. Gyulassy, C. Christensen, S. Philip, S. Kumar.
“The ViSUS Visualization Framework,” In High Performance Visualization: Enabling Extreme-Scale Scientific Insight, Chapman and Hall/CRC Computational Science, Ch. 19, Edited by E. Wes Bethel and Hank Childs (LBNL) and Charles Hansen (UofU), Chapman and Hall/CRC, 2012.
![]()
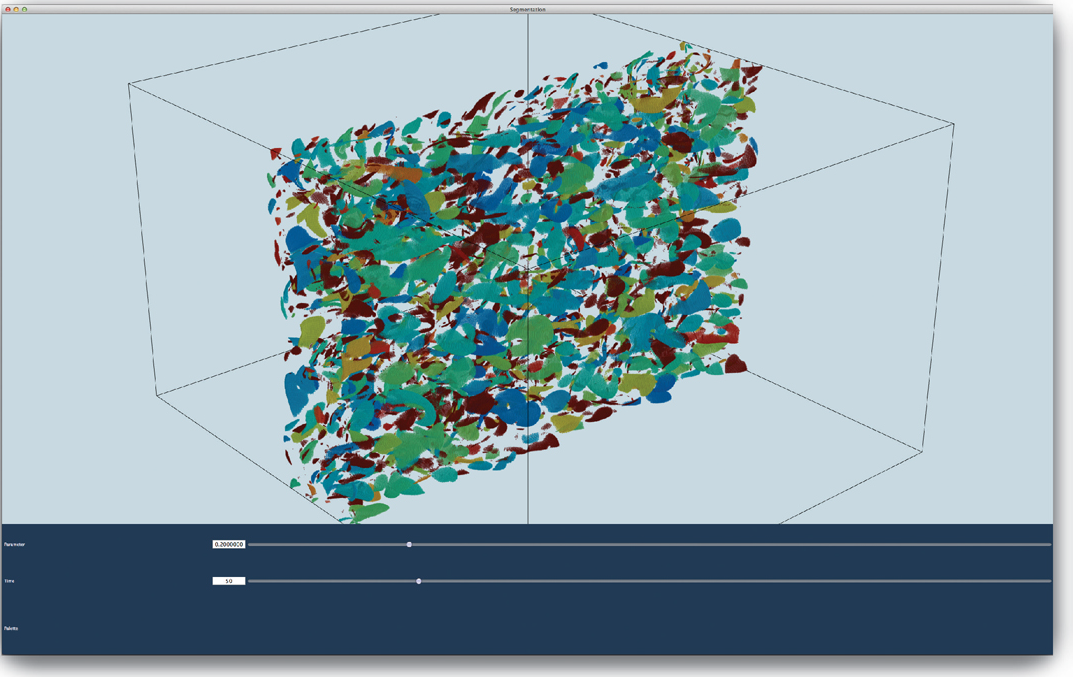
W. Widanagamaachchi, C. Christensen, P.-T. Bremer, V. Pascucci.
“Interactive Exploration of Large-scale Time-varying Data using Dynamic Tracking Graphs,” In 2012 IEEE Symposium on Large Data Analysis and Visualization (LDAV), pp. 9--17. 2012.
DOI: 10.1109/LDAV.2012.6378962
2011
![]()
J.C. Bennett, V. Krishnamoorthy, S. Liu, R.W. Grout, E.R. Hawkes, J.H. Chen, J. Shepherd, V. Pascucci, P.-T. Bremer.
“Feature-Based Statistical Analysis of Combustion Simulation Data,” In IEEE Transactions on Visualization and Computer Graphics, Proceedings of the 2011 IEEE Visualization Conference, Vol. 17, No. 12, pp. 1822--1831. 2011.
![]()
H. Bhatia, S. Jadhav, P.-T. Bremer, G. Chen, J.A. Levine, L.G. Nonato, V. Pascucci.
“Edge Maps: Representing Flow with Bounded Error,” In Proceedings of IEEE Pacific Visualization Symposium 2011, Hong Kong, China, Note: Won Best Paper Award!, pp. 75--82. March, 2011.
DOI: 10.1109/PACIFICVIS.2011.5742375
Page 3 of 5