SCIENTIFIC COMPUTING AND IMAGING INSTITUTEat the University of Utah
An internationally recognized leader in visualization, scientific computing, and image analysis
SCI Publications
2013
Modeling 4D changes in pathological anatomy using domain adaptation: analysis of TBI imaging using a tumor database
Bo Wang, M. Prastawa, A. Saha, S.P. Awate, A. Irimia, M.C. Chambers, P.M. Vespa, J.D. Van Horn, V. Pascucci, G. Gerig.
“Modeling 4D changes in pathological anatomy using domain adaptation: analysis of TBI imaging using a tumor database,” In Proceedings of the 2013 MICCAI-MBIA Workshop, Lecture Notes in Computer Science (LNCS), Vol. 8159, Note: Awarded Best Paper!, pp. 31--39. 2013.
DOI: 10.1007/978-3-319-02126-3_4
ABSTRACT
×
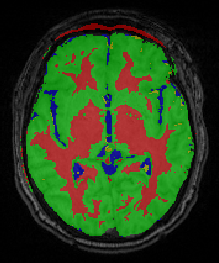
Analysis of 4D medical images presenting pathology (i.e., lesions) is signi cantly challenging due to the presence of complex changes over time. Image analysis methods for 4D images with lesions need to account for changes in brain structures due to deformation, as well as the formation and deletion of new structures (e.g., edema, bleeding) due to the physiological processes associated with damage, intervention, and recovery. We propose a novel framework that models 4D changes in pathological anatomy across time, and provides explicit mapping from a healthy template to subjects with pathology. Moreover, our framework uses transfer learning to leverage rich information from a known source domain, where we have a collection of completely segmented images, to yield effective appearance models for the input target domain. The automatic 4D segmentation method uses a novel domain adaptation technique for generative kernel density models to transfer information between different domains, resulting in a fully automatic method that requires no user interaction. We demonstrate the effectiveness of our novel approach with the analysis of 4D images of traumatic brain injury (TBI), using a synthetic tumor database as the source domain.
Comprehensible Presentation of Topological Information
G.H. Weber, K. Beketayev, P.-T. Bremer, B. Hamann, M. Haranczyk, M. Hlawitschka, V. Pascucci.
“Comprehensible Presentation of Topological Information,” No. LBNL-5693E, Lawrence Berkeley National Laboratory, 2013.
ABSTRACT
×
Topological information has proven very valuable in the analysis of scientific data. An important challenge that remains is presenting this highly abstract information in a way that it is comprehensible even if one does not have an in-depth background in topology. Furthermore, it is often desirable to combine the structural insight gained by topological analysis with complementary information, such as geometric information. We present an overview over methods that use metaphors to make topological information more accessible to non-expert users, and we demonstrate their applicability to a range of scientific data sets. With the increasingly complex output of exascale simulations, the importance of having effective means of providing a comprehensible, abstract overview over data will grow. The techniques that we present will serve as an important foundation for this purpose.
A Flexible Framework for Fusing Image Collections into Panoramas
W. Widanagamaachchi, P. Rosen, V. Pascucci.
“A Flexible Framework for Fusing Image Collections into Panoramas,” In Proceedings of the 2013 SIBGRAPI Conference on Graphics, Patterns, and Images, Note: Awarded Best Paper., pp. 195-202. 2013.
DOI: 10.1109/SIBGRAPI.2013.35
ABSTRACT
×
Panoramas create summary views of multiple images, which make them a valuable means of analyzing huge quantities of image and video data. This paper introduces the Ray Graph - a general framework for panorama construction. With rays as its vertices, the Ray Graph uses its edges to specify a set of coherency relationships among all input rays. Consequently, by using a set of simple graph traversal rules, a diverse set of panorama structures can be enumerated, which can be used to efficiently and robustly generate panoramic images from image collections. To demonstrate this framework, we first use it to recreate both 360° and street panoramas. We further introduce two new panorama models, the centipede panorama - a hybrid of the 360° and street panoramas, and the storytelling panorama - a time encoding panorama. Finally, we demonstrate the flexibility of this framework by enabling interactive brushing of panoramic regions for removal of undesired features such as occlusions and moving objects.
2012
Combining In-Situ and In-Transit Processing to Enable Extreme-Scale Scientific Analysis
J.C. Bennett, H. Abbasi, P. Bremer, R.W. Grout, A. Gyulassy, T. Jin, S. Klasky, H. Kolla, M. Parashar, V. Pascucci, P. Pbay, D. Thompson, H. Yu, F. Zhang, J. Chen.
“Combining In-Situ and In-Transit Processing to Enable Extreme-Scale Scientific Analysis,” In ACM/IEEE International Conference for High Performance Computing, Networking, Storage, and Analysis (SC), Salt Lake City, Utah, U.S.A., November, 2012.
ABSTRACT
×
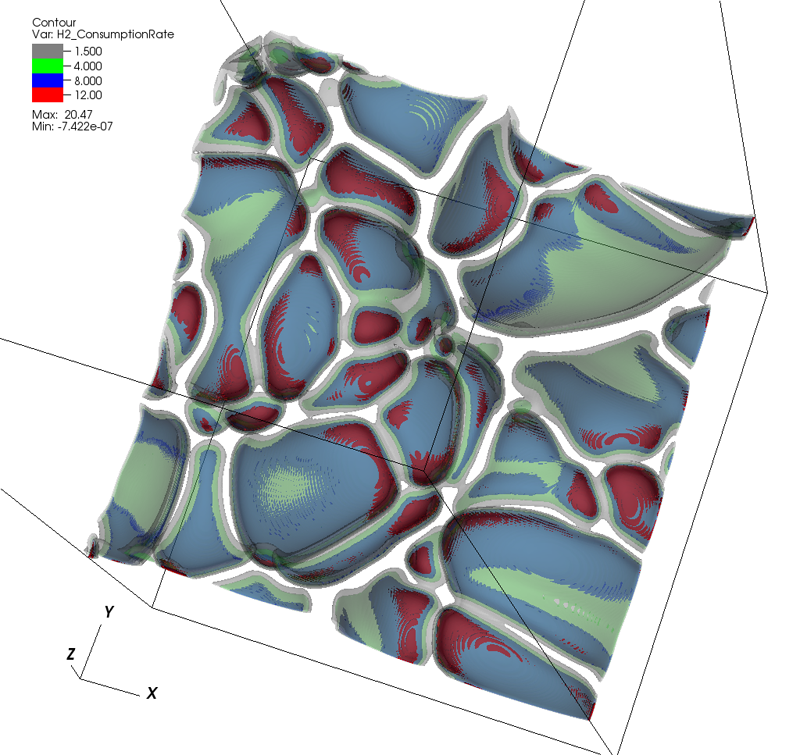
With the onset of extreme-scale computing, I/O constraints make it increasingly difficult for scientists to save a sufficient amount of raw simulation data to persistent storage. One potential solution is to change the data analysis pipeline from a post-process centric to a concurrent approach based on either in-situ or in-transit processing. In this context computations are considered in-situ if they utilize the primary compute resources, while in-transit processing refers to offloading computations to a set of secondary resources using asynchronous data transfers. In this paper we explore the design and implementation of three common analysis techniques typically performed on large-scale scientific simulations: topological analysis, descriptive statistics, and visualization. We summarize algorithmic developments, describe a resource scheduling system to coordinate the execution of various analysis workflows, and discuss our implementation using the DataSpaces and ADIOS frameworks that support efficient data movement between in-situ and in-transit computations. We demonstrate the efficiency of our lightweight, flexible framework by deploying it on the Jaguar XK6 to analyze data generated by S3D, a massively parallel turbulent combustion code. Our framework allows scientists dealing with the data deluge at extreme scale to perform analyses at increased temporal resolutions, mitigate I/O costs, and significantly improve the time to insight.
Mapping applications with collectives over sub-communicators on torus networks
A. Bhatele, T. Gamblin, S.H. Langer, P.-T. Bremer, E.W. Draeger, B. Hamann, K.E. Isaacs, A.G. Landge, J.A. Levine, V. Pascucci, M. Schulz, C.H. Still.
“Mapping applications with collectives over sub-communicators on torus networks,” In Proceedings of Supercomputing 2012, pp. 1--11. 2012.
DOI: 10.1109/SC.2012.75
ABSTRACT
×
The placement of tasks in a parallel application on specific nodes of a supercomputer can significantly impact performance. Traditionally, this task mapping has focused on reducing the distance between communicating tasks on the physical network. This minimizes the number of hops that point-to-point messages travel and thus reduces link sharing between messages and contention. However, for applications that use collectives over sub-communicators, this heuristic may not be optimal. Many collectives can benefit from an increase in bandwidth even at the cost of an increase in hop count, especially when sending large messages. For example, placing communicating tasks in a cube configuration rather than a plane or a line on a torus network increases the number of possible paths messages might take. This increases the available bandwidth which can lead to significant performance gains.
We have developed Rubik, a tool that provides a simple and intuitive interface to create a wide variety of mappings for structured communication patterns. Rubik supports a number of elementary operations such as splits, tilts, or shifts, that can be combined into a large number of unique patterns. Each operation can be applied to disjoint groups of processes involved in collectives to increase the effective bandwidth. We demonstrate the use of Rubik for improving performance of two parallel codes, pF3D and Qbox, which use collectives over sub-communicators.
Topology Analysis of Time-Dependent Multi-Fluid Data Using the Reeb Graph
F. Chen, H. Obermaier, H. Hagen, B. Hamann, J. Tierny, V. Pascucci..
“Topology Analysis of Time-Dependent Multi-Fluid Data Using the Reeb Graph,” In Computer Aided Geometric Design, Note: Published online Apr 24., Elsevier, 2012.
DOI: 10.1016/j.cagd.2012.03.019
ABSTRACT
×
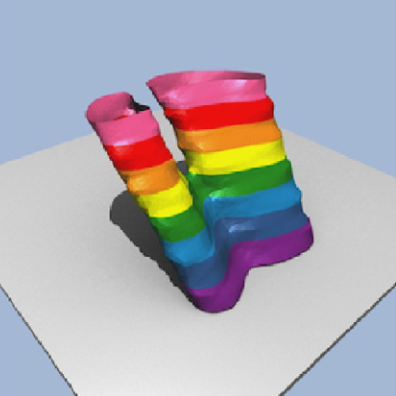
Liquid–liquid extraction is a typical multi-fluid problem in chemical engineering where two types of immiscible fluids are mixed together. Mixing of two-phase fluids results in a time-varying fluid density distribution, quantitatively indicating the presence of liquid phases. For engineers who design extraction devices, it is crucial to understand the density distribution of each fluid, particularly flow regions that have a high concentration of the dispersed phase. The propagation of regions of high density can be studied by examining the topology of isosurfaces of the density data. We present a topology-based approach to track the splitting and merging events of these regions using the Reeb graphs. Time is used as the third dimension in addition to two-dimensional (2D) point-based simulation data. Due to low time resolution of the input data set, a physics-based interpolation scheme is required in order to improve the accuracy of the proposed topology tracking method. The model used for interpolation produces a smooth time-dependent density field by applying Lagrangian-based advection to the given simulated point cloud data, conforming to the physical laws of flow evolution. Using the Reeb graph, the spatial and temporal locations of bifurcation and merging events can be readily identified supporting in-depth analysis of the extraction process.
Topological Analysis and Visualization of Cyclical Behavior in Memory Reference Traces
A.N.M. Imroz Choudhury, Bei Wang, P. Rosen, V. Pascucci.
“Topological Analysis and Visualization of Cyclical Behavior in Memory Reference Traces,” In Proceedings of the IEEE Pacific Visualization Symposium (PacificVis 2012), pp. 9--16. 2012.
DOI: 10.1109/PacificVis.2012.6183557
ABSTRACT
×
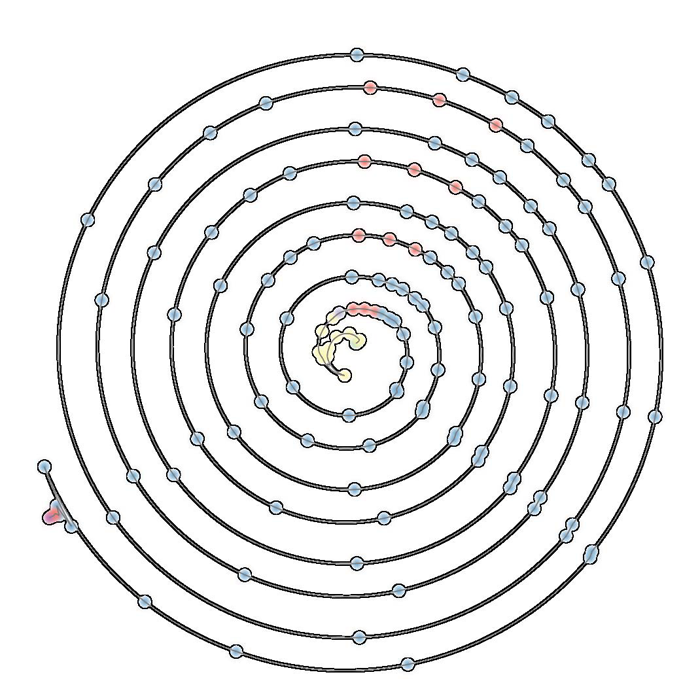
We demonstrate the application of topological analysis techniques to the rather unexpected domain of software visualization. We collect a memory reference trace from a running program, recasting the linear flow of trace records as a high-dimensional point cloud in a metric space. We use topological persistence to automatically detect significant circular structures in the point cloud, which represent recurrent or cyclical runtime program behaviors. We visualize such recurrences using radial plots to display their time evolution, offering multi-scale visual insights, and detecting potential candidates for memory performance optimization. We then present several case studies to demonstrate some key insights obtained using our techniques.
Keywords: scidac
The Parallel Computation of Morse-Smale Complexes
A. Gyulassy, V. Pascucci, T. Peterka, R. Ross.
“The Parallel Computation of Morse-Smale Complexes,” In Proceedings of the Parallel and Distributed Processing Symposium (IPDPS), pp. 484--495. 2012.
DOI: 10.1109/IPDPS.2012.52
ABSTRACT
×
Topology-based techniques are useful for multiscale exploration of the feature space of scalar-valued functions, such as those derived from the output of large-scale simulations. The Morse-Smale (MS) complex, in particular, allows robust identification of gradient-based features, and therefore is suitable for analysis tasks in a wide range of application domains. In this paper, we develop a two-stage algorithm to construct the 1-skeleton of the Morse-Smale complex in parallel, the first stage independently computing local features per block and the second stage merging to resolve global features. Our implementation is based on MPI and a distributed-memory architecture. Through a set of scalability studies on the IBM Blue Gene/P supercomputer, we characterize the performance of the algorithm as block sizes, process counts, merging strategy, and levels of topological simplification are varied, for datasets that vary in feature composition and size. We conclude with a strong scaling study using scientific datasets computed by combustion and hydrodynamics simulations.
Computing Morse-Smale Complexes with Accurate Geometry
A. Gyulassy, P.-T. Bremer, V. Pascucci.
“Computing Morse-Smale Complexes with Accurate Geometry,” In IEEE Transactions on Visualization and Computer Graphics, Vol. 18, No. 12, pp. 2014--2022. 2012.
DOI: 10.1109/TVCG.2011.272
ABSTRACT
×
Topological techniques have proven highly successful in analyzing and visualizing scientific data. As a result, significant efforts have been made to compute structures like the Morse-Smale complex as robustly and efficiently as possible. However, the resulting algorithms, while topologically consistent, often produce incorrect connectivity as well as poor geometry. These problems may compromise or even invalidate any subsequent analysis. Moreover, such techniques may fail to improve even when the resolution of the domain mesh is increased, thus producing potentially incorrect results even for highly resolved functions. To address these problems we introduce two new algorithms: (i) a randomized algorithm to compute the discrete gradient of a scalar field that converges under refinement; and (ii) a deterministic variant which directly computes accurate geometry and thus correct connectivity of the MS complex. The first algorithm converges in the sense that on average it produces the correct result and its standard deviation approaches zero with increasing mesh resolution. The second algorithm uses two ordered traversals of the function to integrate the probabilities of the first to extract correct (near optimal) geometry and connectivity. We present an extensive empirical study using both synthetic and real-world data and demonstrates the advantages of our algorithms in comparison with several popular approaches.
Direct Feature Visualization Using Morse-Smale Complexes
A. Gyulassy, N. Kotava, M. Kim, C. Hansen, H. Hagen, and V. Pascucci.
“Direct Feature Visualization Using Morse-Smale Complexes,” In IEEE Transactions on Visualization and Computer Graphics, Vol. 18, No. 9, pp. 1549--1562. September, 2012.
DOI: 10.1109/TVCG.2011.272
ABSTRACT
×
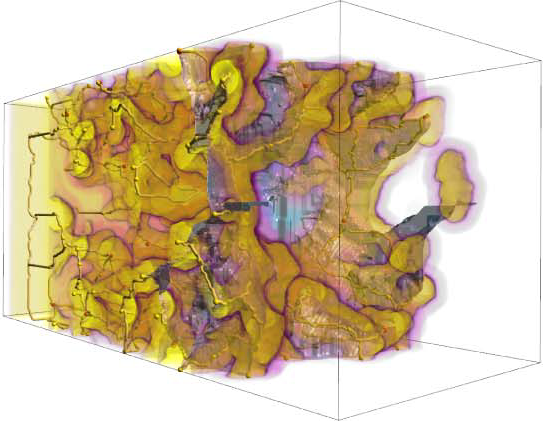
In this paper, we characterize the range of features that can be extracted from an Morse-Smale complex and describe a unified query language to extract them. We provide a visual dictionary to guide users when defining features in terms of these queries. We demonstrate our topology-rich visualization pipeline in a tool that interactively queries the MS complex to extract features at multiple resolutions, assigns rendering attributes, and combines traditional volume visualization with the extracted features. The flexibility and power of this approach is illustrated with examples showing novel features.
Efficient data restructuring and aggregation for {I/O} acceleration in {PIDX}
S. Kumar, V. Vishwanath, P. Carns, J.A. Levine, R. Latham, G. Scorzelli, H. Kolla, R. Grout, R. Ross, M.E. Papka, J. Chen, V. Pascucci.
“Efficient data restructuring and aggregation for I/O acceleration in PIDX,” In Proceedings of the International Conference on High Performance Computing, Networking, Storage and Analysis, IEEE Computer Society Press, pp. 50:1--50:11. 2012.
ISBN: 978-1-4673-0804-5
ABSTRACT
Hierarchical, multiresolution data representations enable interactive analysis and visualization of large-scale simulations. One promising application of these techniques is to store high performance computing simulation output in a hierarchical Z (HZ) ordering that translates data from a Cartesian coordinate scheme to a one-dimensional array ordered by locality at different resolution levels. However, when the dimensions of the simulation data are not an even power of 2, parallel HZ ordering produces sparse memory and network access patterns that inhibit I/O performance. This work presents a new technique for parallel HZ ordering of simulation datasets that restructures simulation data into large (power of 2) blocks to facilitate efficient I/O aggregation. We perform both weak and strong scaling experiments using the S3D combustion application on both Cray-XE6 (65,536 cores) and IBM Blue Gene/P (131,072 cores) platforms. We demonstrate that data can be written in hierarchical, multiresolution format with performance competitive to that of native data-ordering methods.
Visualizing Network Traffic to Understand the Performance of Massively Parallel Simulations
A.G. Landge, J.A. Levine, A. Bhatele, K.E. Isaacs, T. Gamblin, S. Langer, M. Schulz, P.-T. Bremer, V. Pascucci.
“Visualizing Network Traffic to Understand the Performance of Massively Parallel Simulations,” In IEEE Transactions on Visualization and Computer Graphics, Vol. 18, No. 12, IEEE, pp. 2467--2476. Dec, 2012.
DOI: 10.1109/TVCG.2012.286
ABSTRACT
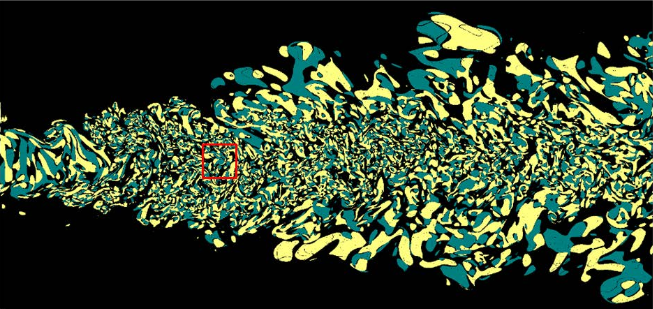
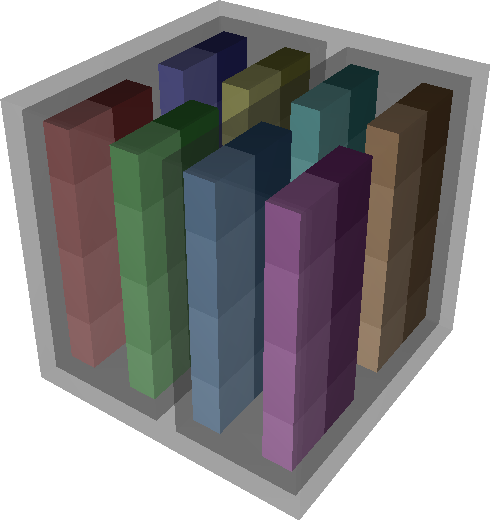
The performance of massively parallel applications is often heavily impacted by the cost of communication among compute nodes. However, determining how to best use the network is a formidable task, made challenging by the ever increasing size and complexity of modern supercomputers. This paper applies visualization techniques to aid parallel application developers in understanding the network activity by enabling a detailed exploration of the flow of packets through the hardware interconnect. In order to visualize this large and complex data, we employ two linked views of the hardware network. The first is a 2D view, that represents the network structure as one of several simplified planar projections. This view is designed to allow a user to easily identify trends and patterns in the network traffic. The second is a 3D view that augments the 2D view by preserving the physical network topology and providing a context that is familiar to the application developers. Using the massively parallel multi-physics code pF3D as a case study, we demonstrate that our tool provides valuable insight that we use to explain and optimize pF3D’s performance on an IBM Blue Gene/P system.
A Quantized Boundary Representation of {2D} Flows
J.A. Levine, S. Jadhav, H. Bhatia, V. Pascucci, P.-T. Bremer.
“A Quantized Boundary Representation of 2D Flows,” In Computer Graphics Forum, Vol. 31, No. 3 Pt. 1, pp. 945--954. June, 2012.
DOI: 10.1111/j.1467-8659.2012.03087.x
ABSTRACT
×
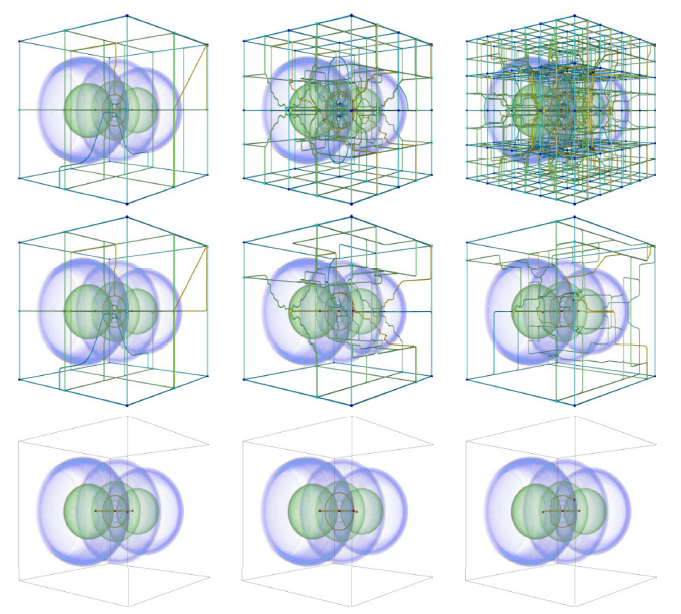
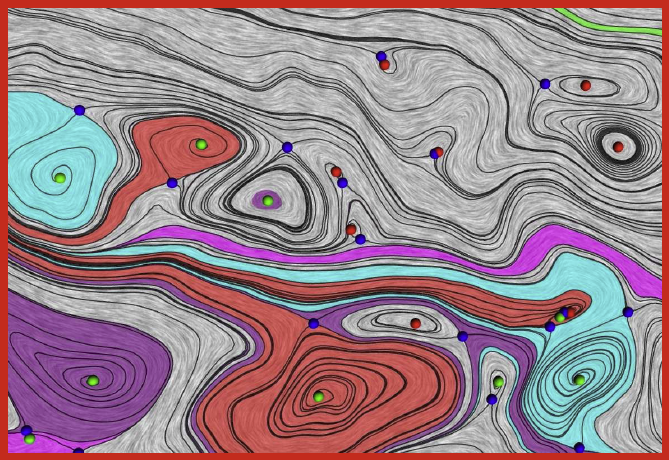
Analysis and visualization of complex vector fields remain major challenges when studying large scale simulation of physical phenomena. The primary reason is the gap between the concepts of smooth vector field theory and their computational realization. In practice, researchers must choose between either numerical techniques, with limited or no guarantees on how they preserve fundamental invariants, or discrete techniques which limit the precision at which the vector field can be represented. We propose a new representation of vector fields that combines the advantages of both approaches. In particular, we represent a subset of possible streamlines by storing their paths as they traverse the edges of a triangulation. Using only a finite set of streamlines creates a fully discrete version of a vector field that nevertheless approximates the smooth flow up to a user controlled error bound. The discrete nature of our representation enables us to directly compute and classify analogues of critical points, closed orbits, and other common topological structures. Further, by varying the number of divisions (quantizations) used per edge, we vary the resolution used to represent the field, allowing for controlled precision. This representation is compact in memory and supports standard vector field operations.
Gaussian Mixture Model Based Volume Visualization
S. Liu, J.A. Levine, P.-T. Bremer, V. Pascucci.
“Gaussian Mixture Model Based Volume Visualization,” In Proceedings of the IEEE Large-Scale Data Analysis and Visualization Symposium 2012, Note: Received Best Paper Award, pp. 73--77. 2012.
DOI: 10.1109/LDAV.2012.6378978
ABSTRACT
×
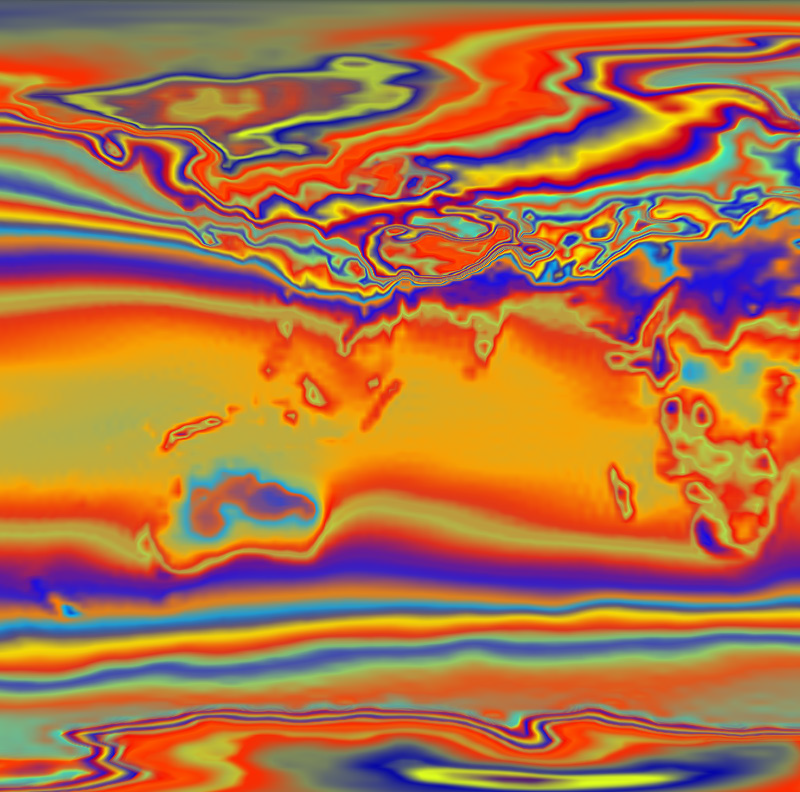
Representing uncertainty when creating visualizations is becoming more indispensable to understand and analyze scientific data. Uncertainty may come from different sources, such as, ensembles of experiments or unavoidable information loss when performing data reduction. One natural model to represent uncertainty is to assume that each position in space instead of a single value may take on a distribution of values. In this paper we present a new volume rendering method using per voxel Gaussian mixture models (GMMs) as the input data representation. GMMs are an elegant and compact way to drastically reduce the amount of data stored while still enabling realtime data access and rendering on the GPU. Our renderer offers efficient sampling of the data distribution, generating renderings of the data that flicker at each frame to indicate high variance. We can accumulate samples as well to generate still frames of the data, which preserve additional details in the data as compared to either traditional scalar indicators (such as a mean or a single nearest neighbor down sample) or to fitting the data with only a single Gaussian per voxel. We demonstrate the effectiveness of our method using ensembles of climate simulations and MRI scans as well as the down sampling of large scalar fields as examples.
V. Pascucci, G. Scorzelli, B. Summa, P.-T. Bremer, A. Gyulassy, C. Christensen, S. Philip, S. Kumar.
“The ViSUS Visualization Framework,” In High Performance Visualization: Enabling Extreme-Scale Scientific Insight, Chapman and Hall/CRC Computational Science, Ch. 19, Edited by E. Wes Bethel and Hank Childs (LBNL) and Charles Hansen (UofU), Chapman and Hall/CRC, 2012.
ABSTRACT
×
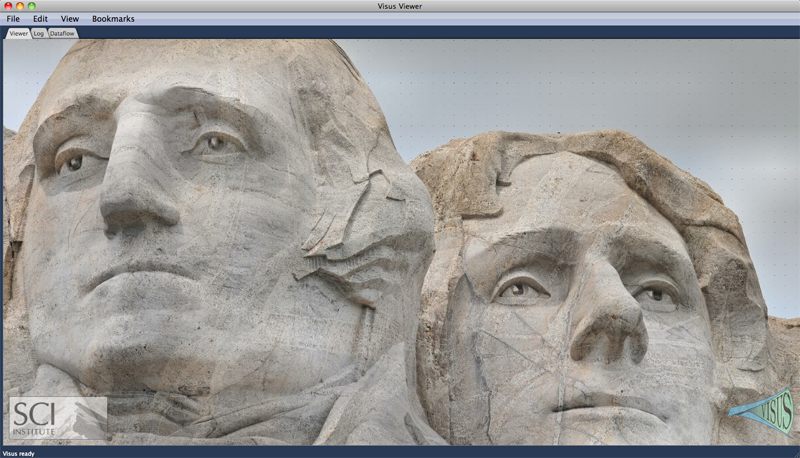
The ViSUS software framework was designed with the primary philosophy that the visualization of massive data need not be tied to specialized hardware or infrastructure. In other words, a visualization environment for large data can be designed to be lightweight, highly scalable and run on a variety of plat- forms or hardware. Moreover, if designed generally such an infrastructure can have a wide variety of applications, all from the same code base. Figure 19.1 details example applications and the major components of the ViSUS infrastructure. The components can be grouped into three major categories. First, a lightweight and fast out-of-core data management framework using multi- resolution space filling curves. This allows the organization of information in an order that exploits the cache hierarchies of any modern data storage architectures. Second, a data flow framework that allows data to be processed during movement. Processing massive datasets in their entirety would be a long and expensive operation which hinders interactive exploration. By designing new algorithms to fit within this framework, data can be processed as it moves. Third, a portable visualization layer which was designed to scale from mobile devices to powerwall displays with same code base. In this chapter we will describe the ViSUS infrastructure, as well as give practical examples of its use in real world applications.
Panorama weaving: fast and flexible seam processing
B. Summa, J. Tierny, V. Pascucci.
“Panorama weaving: fast and flexible seam processing,” In ACM Trans. Graph., Vol. 31, No. 4, Note: ACM ID:2335434, ACM, New York, NY, USA pp. 83:1--83:11. July, 2012.
ISSN: 0730-0301
DOI: 10.1145/2185520.2185579
ABSTRACT
×
A fundamental step in stitching several pictures to form a larger mosaic is the computation of boundary seams that minimize the visual artifacts in the transition between images. Current seam computation algorithms use optimization methods that may be slow, sequential, memory intensive, and prone to finding suboptimal solutions related to local minima of the chosen energy function. Moreover, even when these techniques perform well, their solution may not be perceptually ideal (or even good). Such an inflexible approach does not allow the possibility of user-based improvement. This paper introduces the Panorama Weaving technique for seam creation and editing in an image mosaic. First, Panorama Weaving provides a procedure to create boundaries for panoramas that is fast, has low memory requirements and is easy to parallelize. This technique often produces seams with lower energy than the competing global technique. Second, it provides the first interactive technique for the exploration of the seam solution space. This powerful editing capability allows the user to automatically extract energy minimizing seams given a sparse set of constraints. With a variety of empirical results, we show how Panorama Weaving allows the computation and editing of a wide range of digital panoramas including unstructured configurations.
Keywords: digital panoramas, interactive image boundaries, panorama editing, panorama seams
Generalized Topological Simplification of Scalar Fields on Surfaces
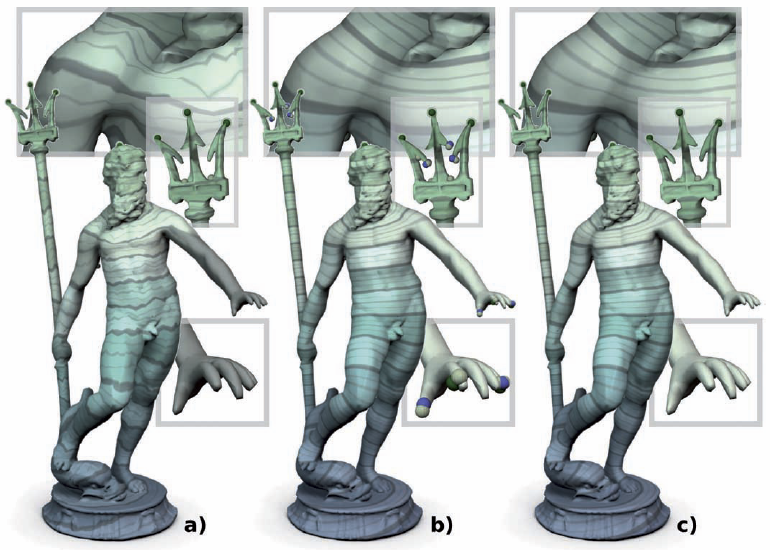
J. Tierny, V. Pascucci.
“Generalized Topological Simplification of Scalar Fields on Surfaces,” In IEEE Transactions on Visualization and Computer Graphics (TVCG), Vol. 18, No. 12, pp. 2005--2013. Dec, 2012.
DOI: 10.1109/TVCG.2012.228
ABSTRACT
×
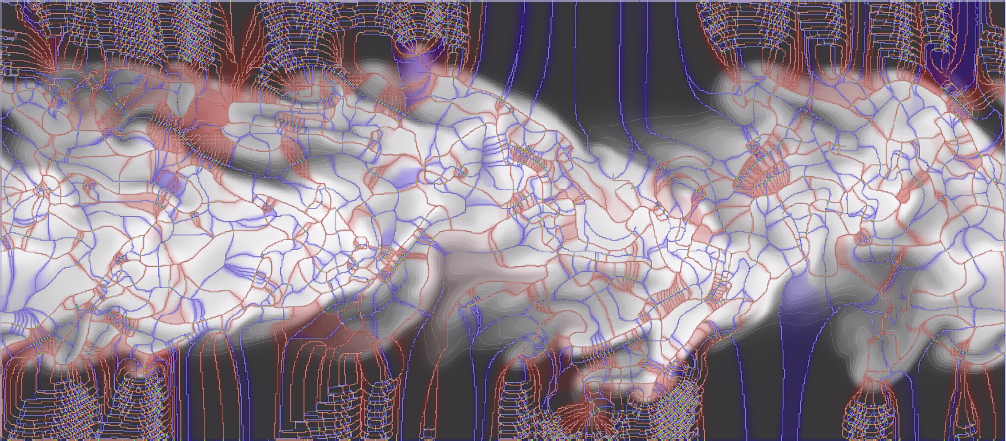
We present a combinatorial algorithm for the general topological simplification of scalar fields on surfaces. Given a scalar field f, our algorithm generates a simplified field g that provably admits only critical points from a constrained subset of the singularities of f, while guaranteeing a small distance ||f - g||∞ for data-fitting purpose. In contrast to previous algorithms, our approach is oblivious to the strategy used for selecting features of interest and allows critical points to be removed arbitrarily. When topological persistence is used to select the features of interest, our algorithm produces a standard ϵ-simplification. Our approach is based on a new iterative algorithm for the constrained reconstruction of sub- and sur-level sets. Extensive experiments show that the number of iterations required for our algorithm to converge is rarely greater than 2 and never greater than 5, yielding O(n log(n)) practical time performances. The algorithm handles triangulated surfaces with or without boundary and is robust to the presence of multi-saddles in the input. It is simple to implement, fast in practice and more general than previous techniques. Practically, our approach allows a user to arbitrarily simplify the topology of an input function and robustly generate the corresponding simplified function. An appealing application area of our algorithm is in scalar field design since it enables, without any threshold parameter, the robust pruning of topological noise as selected by the user. This is needed for example to get rid of inaccuracies introduced by numerical solvers, thereby providing topological guarantees needed for certified geometry processing. Experiments show this ability to eliminate numerical noise as well as validate the time efficiency and accuracy of our algorithm. We provide a lightweight C++ implementation as supplemental material that can be used for topological cleaning on surface meshes.
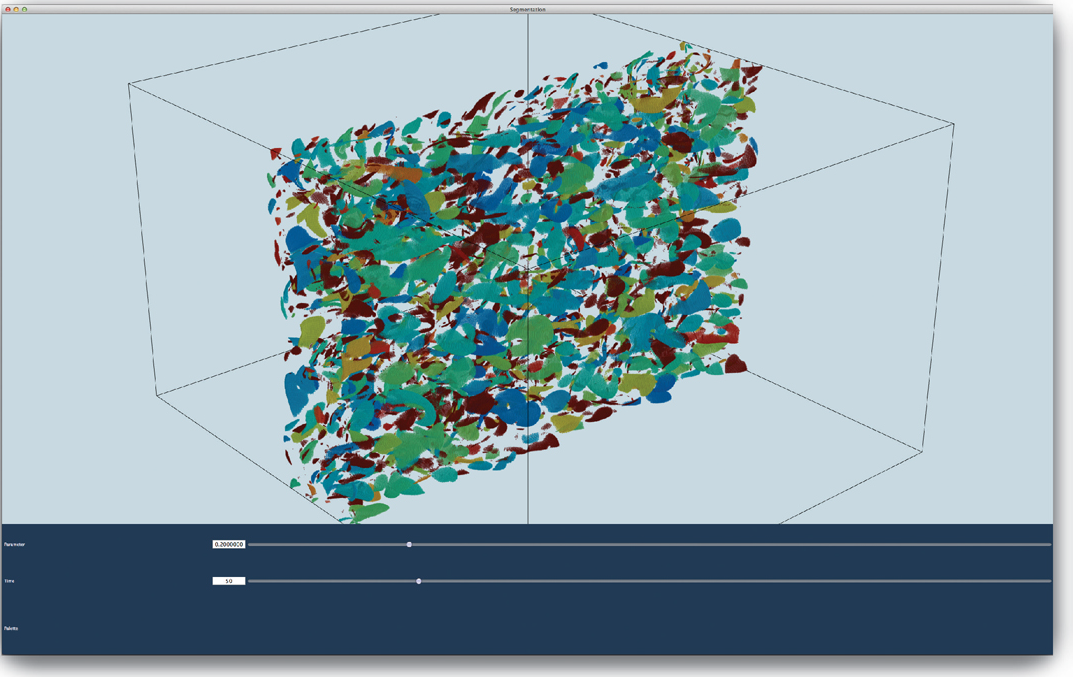
Interactive Exploration of Large-scale Time-varying Data using Dynamic Tracking Graphs
W. Widanagamaachchi, C. Christensen, P.-T. Bremer, V. Pascucci.
“Interactive Exploration of Large-scale Time-varying Data using Dynamic Tracking Graphs,” In 2012 IEEE Symposium on Large Data Analysis and Visualization (LDAV), pp. 9--17. 2012.
DOI: 10.1109/LDAV.2012.6378962
ABSTRACT
×
Exploring and analyzing the temporal evolution of features in large-scale time-varying datasets is a common problem in many areas of science and engineering. One natural representation of such data is tracking graphs, i.e., constrained graph layouts that use one spatial dimension to indicate time and show the “tracks” of each feature as it evolves, merges or disappears. However, for practical data sets creating the corresponding optimal graph layouts that minimize the number of intersections can take hours to compute with existing techniques. Furthermore, the resulting graphs are often unmanageably large and complex even with an ideal layout. Finally, due to the cost of the layout, changing the feature definition, e.g. by changing an iso-value, or analyzing properly adjusted sub-graphs is infeasible. To address these challenges, this paper presents a new framework that couples hierarchical feature definitions with progressive graph layout algorithms to provide an interactive exploration of dynamically constructed tracking graphs. Our system enables users to change feature definitions on-the-fly and filter features using arbitrary attributes while providing an interactive view of the resulting tracking graphs. Furthermore, the graph display is integrated into a linked view system that provides a traditional 3D view of the current set of features and allows a cross-linked selection to enable a fully flexible spatio-temporal exploration of data. We demonstrate the utility of our approach with several large-scale scientific simulations from combustion science.
Extreme-Scale Visual Analytics
P.C. Wong, H. Shen, V. Pascucci.
“Extreme-Scale Visual Analytics,” In IEEE Computer Graphics and Applications, Vol. 32, No. 4, pp. 23--25. 2012.
DOI: 10.1109/MCG.2012.73
ABSTRACT
Extreme-scale visual analytics (VA) is about applying VA to extreme-scale data. The articles in this special issue examine advances related to extreme-scale VA problems, their analytical and computational challenges, and their real-world applications.
2011
Scientific Discovery at the Exascale: Report from the (DOE) (ASCR) 2011 Workshop on Exascale Data Management, Analysis, and Visualization
S. Ahern, A. Shoshani, K.L. Ma, A. Choudhary, T. Critchlow, S. Klasky, V. Pascucci.
“Scientific Discovery at the Exascale: Report from the (DOE) (ASCR) 2011 Workshop on Exascale Data Management, Analysis, and Visualization,” Note: Office of Scientific and Technical Information (OSTI), January, 2011.
DOI: 10.2172/1011053