By Gordon Kindlmann.
 The technology of Magnetic Resonance Imaging (MRI) has been used in an ever-increasing variety of applications in the area of medical imaging. This is partly because of MRI's basic ability to non-invasively and non-destructively take images of living tissue, and also because of the inherent flexibility in the way that MRI machines are programmed in order to acquire images. One relatively new method of using MRI technology is called "diffusion tensor imaging". By measuring the directions along which water molecules diffuse through brain tissue, this technology allows us to explore the structure of the brain in new ways which benefit many disciplines. For example, it can help doctors to better detect abnormalities in brain tissue, cognitive scientists to better understand the interconnections between the functional units of the brain, and show biologists how brain tissue becomes organized in a growing fetus.
 One interesting way of interpreting the data from diffusion tensor MRI (DT MRI) is through volume rendering. The basic principle in volume rendering is that with an appropriate way of assigning colors and opacities to different regions in the dataset, the vital structures of the data become visible. This is an example of the basic task of scientific visualization: finding a way to make the numbers in the data visible so that important features of the dataset become readily apparent to the eye. Because volume rendering of DT MRI data is a new approach, the possibilities for how to make it visible are wide open, and the research has been an exploration of a variety of different strategies.
 If a drop of dye were to be injected into a region of gray matter (around the outside of the brain), as the dye spread it would create a shape close to a sphere. This is because the diffusion rate is basically the same, regardless of direction. The name for this is "isotropy". But in the white matter, at the core of our brain, the tissue is more fibrous, and the shape of the dye spot would not be a sphere. It might look more like a cigar, or perhaps even like a pancake. Here, the diffusion rate is faster in some directions than others, a condition called "anisotropy".
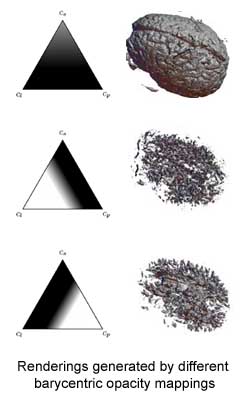
This research has focused on ways of making the DT MRI data based on the shape and direction of the anisotropy. One way of describing the shape of the anisotropy is with the triangle. At the corners are the extremes of the different shape possibilities: spheres (top), cigars (bottom left) and pancakes (bottom right). Everywhere inside the triangle is a shape somewhere in between. If you assign opacity and color according to location within this triangle of shape possibilities, you can discern different structures in the tissue, especially the white and gray matter.
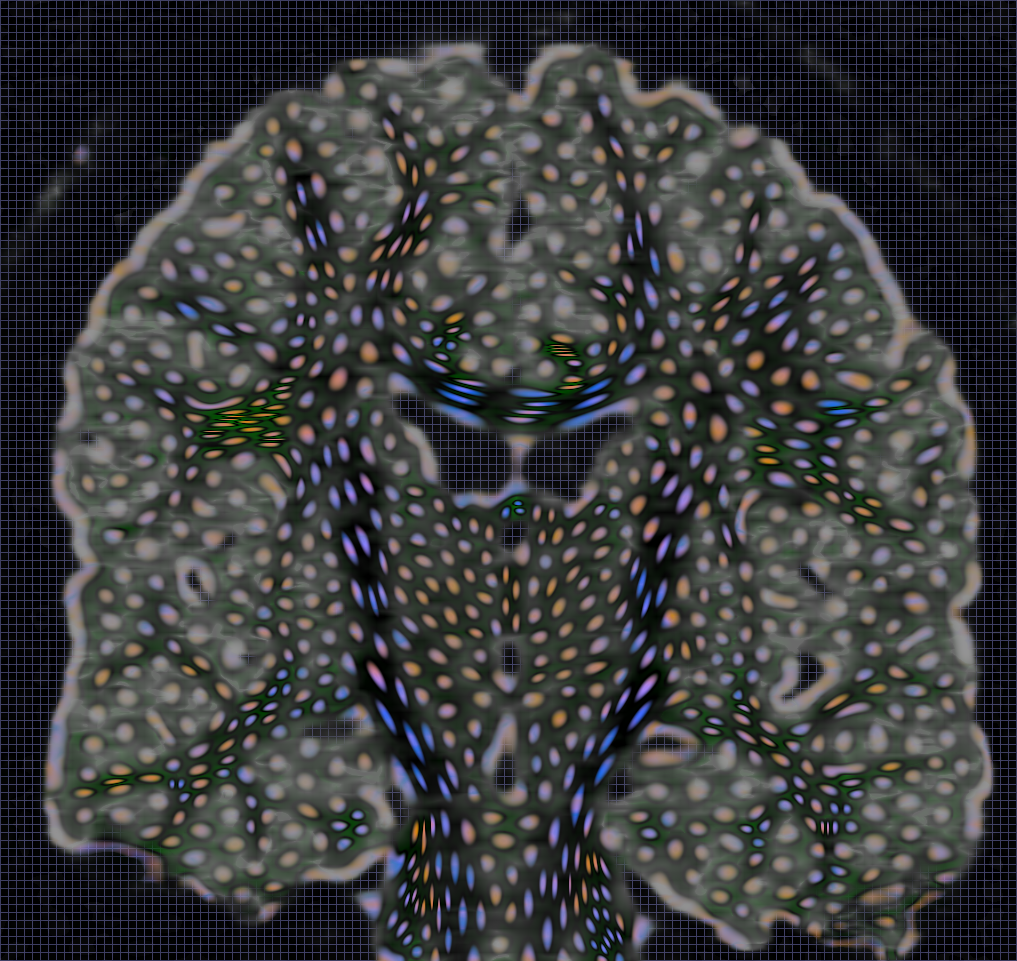
Other strategies for creating color and opacity in the DT MRI data were explored. The idea of "hue-balls" is to visualize the linear transformation induced by the matrix representation of the diffusion tensor: different colors represent the range of the linear transformation. Also, the idea of "lit-tensors" is to generalize surface shading traditionally used in computer graphics, and a vector visualization technique known as "lit-lines". Finally, the use of reaction-diffusion textures was explored as a way to depict the structure of DT MRI data. Alan Turing invented reaction-diffusion textures in the 1950's as a mathematical model of biological development, so it is interesting that 50 years later they are finding use as a method to understand the complex structure of the brain.
For more information, see "Hue-Balls and Lit-Tensors for Direct Volume Rendering of Diffusion Tensor Fields" presented at Vis '99 by Gordon Kindlmann.
