Jennifer Simpson, Eric luke, MS., Allen Sanderson, Phd.
Introduction
In the last few years, scientists and researchers have given a great deal of attention to the area of remote visualization of scientific datasets within collaborative environments. This recent interest has been fueled by the use of interactive viewing as the primary means by which researchers explore large datasets. However, researchers often need to extend this interactivity in order to collaborate with colleagues who are geographically separated. Most current remote visualization tools allow multiple parties to view images from different locations, but pose problems with efficiency and user interactivity.
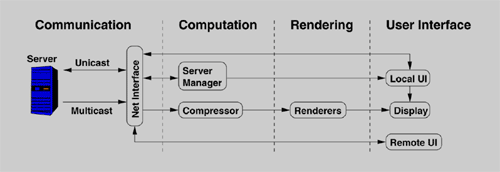 |
| The remote visualization rendering pipeline with the client-server paradigm applied to it. As illustrated, the data is rendered (partially or fully, depending in the rendering method) on the server and sent to the remote client via a variety of communication protocols. Our focus has been on improving the communication stage of the pipeline through the implementation of multicasting. |
 |
The two open windows illustrate the server (left) and client (right) interfaces. The same dataset appears on both, with the client controlling the viewing parameters. |
Approach
In general, popular recent approaches that address these shortcomings focus on improving two different areas of remote visualization:
- Increasing network bandwidth utilization.
- Adjusting the amount of rendering performed on a local server versus a remote client in order to optimally utilize resources.
In particular, researchers and developers use the client-server paradigm as a logical means to partition rendering responsibilities, efficiently utilizing valuable resources on both local and remote machines. In this project, we have built upon a prototype remote visualization application that applies this client-server paradigm, along with several rendering methods, in order to offer greater flexibility for remote viewing. As a part of the application framework, multiple clients may steer remote visualization applications via a graphical user interface. We have implemented this tool as an extension of the SCIRun problem solving environment.We have focused this project on the communication portion of the client-server rendering pipeline. Specifically, we have experimented with multicasting of image data as a means to improve network bandwidth utilization and scalability. We have tested both a reliable multicast protocol as well as unreliable IP Multicast, comparing transfer rates with standard TCP point-to-point transfers in order to find the most efficient method.
Results
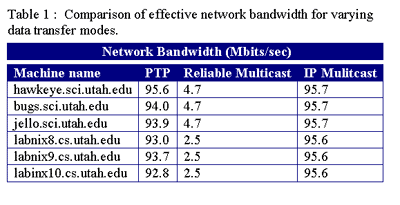
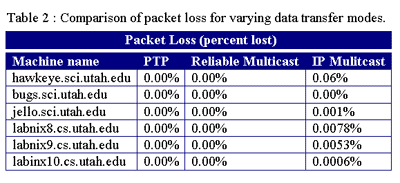
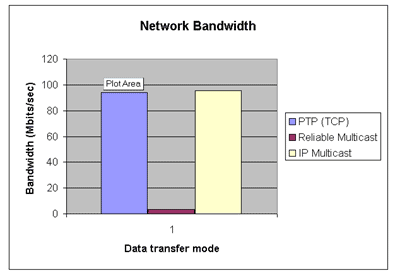
For several reasons, we found reliable multicasting to be unsuitable for streaming real-time image data. First, we encountered excessive overhead with implementing reliability at the application layer. Second, since lost packets are usually outdated, the retransmission of lost packets is generally not useful in real-time data transfer. Third, even with a reliable multicast protocol that uses efficient NAK/ACK algorithms, receivers must wait for any lost packet in order to remain synchronized. Once we found that reliable multicasting could not give the transfer rate needed to compete with TCP point-to-point transfers of image frames, we chose to use IP Multicast. In our tests, IP Multicast yielded send times that are comparable to PTP send times. Packet loss was acceptably low given that we expect some loss in an interactive remote imaging application.
Conclusion
We have found promising ways of using multicasting in order to achieve scalability,which allows better communication and flexibility with data exploration. We have also illustrated the collaborative potential of our remote visualization application through testing in a collaborative session between a standard Access Grid node and a Personal Interface Grid.
 |
Here is one of our Access Grid developers (Richard Coffey) running a remote client on a laptop within an Access Grid node. The client illustrates remote viewing and control of a dataset being rendered by SCIRun on a Personal Interface Grid. The video from the Personal Interface Grid can be seen on the display wall. |
 |
This is a view of the server and local client being run on a Personal Information Grid. The server is sending images to both the local client as well as the remote client in the Access Grid Node. The video from the Access Grid Node can be seen on the right monitor.
|
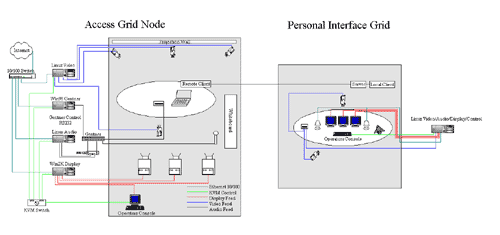 |
| On the left is a diagram of a standard Access Grid node, very similar to the one at the SCI Institute. On the right is a diagram of a Personal Interface Grid (PIG), which is a compact version of an AG node with a multiple monitor display instead of a display wall. The AG node and the PIG exchange audio and video data to enable remote collaboration. For our demo, we ran the server on the PIG, with a remote client in the Access Grid node. |
This work was supported by the NSF Partnerships for an Advanced Computational Infrastructure Research Experience for Undergraduates Program and the National Collaboratory to Advance the Science of High Temperature Plasma Physics for Magnetic Fusion which is funded under the DOE Office of Science SciDAC program DE-FC02-01ER25457.


