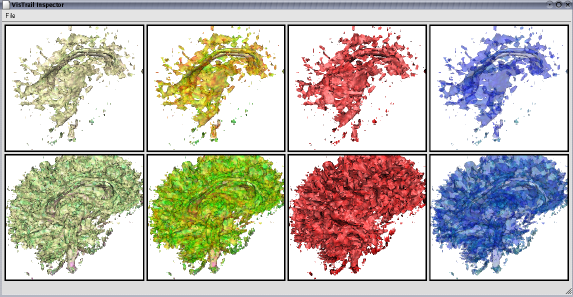
 Figure 1: The VisTrails Visualization Spreadsheet. Surface salinity variation at the mouth of the Columbia River over the period of a day. The green regions represent the fresh-water discharge of the river into the ocean. A single vistrail specification is used to construct this ensemble. Each cell corresponds to a single visualization pipeline specification executed with a different timestamp value. |
Developers at SCI are currently working on the next transformation in dataflow management called "VisTrails". VisTrails is a new system that enables interactive multiple-view visualizations by simplifying the creation and maintenance of visualization pipelines, and by optimizing their execution. It provides a general infrastructure that can be combined with existing visualization systems and libraries.
 Figure 2: The VisTrails History Management Interface. Each node in the vistrail history tree represents a dataflow version. An edge between a parent and child nodes represents to a set of actions applied to the parent to obtain the dataflow for the child node. |
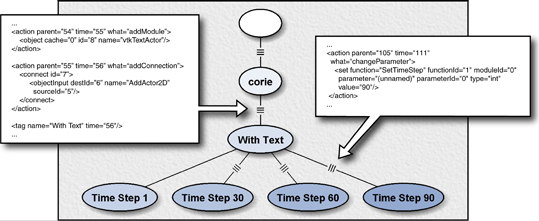
A "vistrail" (Fig. 2) is an evolving workflow that provides full provenance of the exploration process. A vistrail captures the evolution of a workflow - all the trial-and-error steps followed to construct a set of data products. A vistrail consists of a collection of workflows-several versions of a workflow and its instances. It allows scientists to explore visualizations by returning to and modifying previous versions of a workflow. Instead of storing a set of related workflows, it stores the operations (actions) that are applied to the workflows. A vistrail is essentially a tree in which each node corresponds to a version of a workflow, and the lines between the parent nodes and their children represent the actions applied to parent nodes to obtain the child nodes.
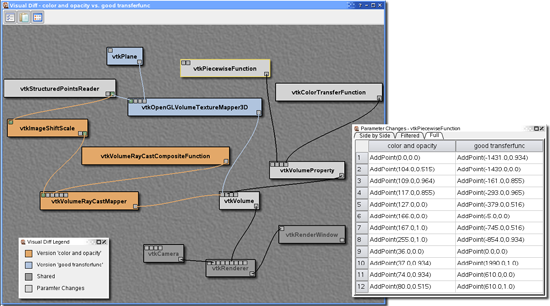
Powerful operations are enabled through direct manipulation of the version tree. These operations combined with an intuitive interface for comparing the results of different work-flows, greatly simplify the scientific discovery process. These include the ability to re-use workflows and workflow fragments through a macro facility; to explore a multi-dimensional slice of the parameter space of a workflow and generate a large number of data products through bulk-updates (see Fig 4); to analyze (and visualize) the differences between two workflows (see Fig 3); and to support collaborative data exploration in a distributed and disconnected fashion.
By maintaining the provenance of both the visualization processes and data they manipulate, VisTrails makes it possible to reproduce dataflow networks at any stage in their development and simplifies the problem of creating and maintaining visualization products. This allows scientists to efficiently and effectively explore data through visualization: they can explore their visualization product by returning to previous versions of a dataflow (or visualization pipeline), apply a dataflow instance to different data, explore the parameter space of the dataflow, query the visualization history, and comparatively visualize different results. Unlike existing dataflow-based systems, in VisTrails there is a clear separation between the specification of a pipeline and its execution instances. This separation enables powerful scripting capabilities and provides a scalable mechanism for generating a large number of visualizations.
 Figure 3: The Visual Diff Interface. |
To better understand the exploratory process, users often need to compare different workflows. The Visual Diff Interface (Fig. 3) allows users to see the differences between the sequences of actions applied to two nodes in the vistrail tree.
 Figure 4: VisTrails Spreadsheet showing the results of multiple visualizations of diffusion tensor data. The horizontal rows explore different color mapping schemes, while the vertical columns use different isosurfaces. |
 Figure 5 Figure 5 |
VisTrails is a new visualization management system that provides the necessary infrastructure to streamline the process of data exploration through visualization. The beta version of VisTrails (including the GUIs) runs on multiple platforms. It has been tested on Linux, Mac and Windows. The current version is being deployed in a select number of collaborator sites. Over the next year, we intend to start a beta testing program in preparation for a future public release.
 Download VisTrails!
VisTrails is now available for download and testing. Downloads and documentation are available on the VisTrails Wiki. Plase give it a try and let us know what you think.
Principal Researchers
- Juliana Freire
- Claudio T. Silva
- Erik Anderson
- Steven P. Callahan
- Emanuele Santos
- Carlos E. Scheidegger
- Nathan Smith
- Huy T. Vo
