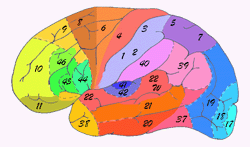
 In 1909 the Broadman areas map was published which localized various functions of cortex. |
Although we've identified many structures and characteristics that are common in all human brains, in reality every brain is different and we need to improve our understanding of how brains vary between individuals. One problem that persists is that most current atlases have been based on arbitrarily chosen individuals. Even today, when intense research has been directed toward the development of digital three-dimensional atlases of the brain, most digital brain atlases so far have been based on a single subject's anatomy. This introduces a bias into the analysis when comparing individual brains to the atlas and does not provide a meaningful baseline with which to measure individual anatomical variation.
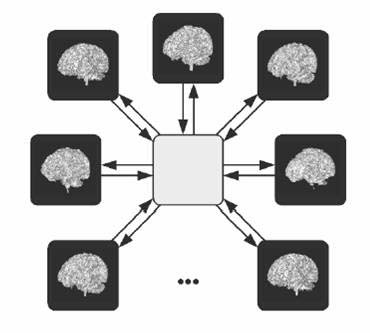
Dr. Sarang Joshi at the Scientific Computing and Imaging Institute and collaborators from the University of North Carolina are developing methods to create unbiased three-dimensional digital brain atlases to provide scientifically meaningful standards with which to measure anatomic variation in individual brains. Their method is to construct atlases which are the anatomical average of every brain in a given population. They use a sophisticated form of morphing based on the theory of diffeomorphic transformations, that allows them to combine all of the brains in a population together in a statistically balanced way to arrive at an average structure and morphology of all the brains in the population while preserving structural details. Every part of the resulting anatomy then represents the statistical average in size, shape and structure of the population. From there, any feature of an individual brain can be quantitatively measured in terms of deviation from the mean.
 CT slices from fourteen individuals reveals significant structural variation between individuals. |
Methodology
Although the study of structural variability of anatomy can be traced back to the beginnings of modern science, Dr. Joshi's methodology is rooted in the philosophy first proposed by D'Arcy Thompson in his treatise "On Growth and Form."
"In a very large part of morphology, our essential task lies in the comparison of related forms rather in the precise definition of each; and the deformation of a complicated figure may be a phenomenon easy of comprehension, though the figure itself may have to be left unanalyzed and undefined. This process of comparison, of recognizing in one form a definite permutation or deformation of another, apart altogether from a precise and adequate understanding of the original `type' or standard of comparison, lies within the immediate province of mathematics and finds its solution in the elementary use of a certain method of the mathematician. This method is the Method of Coordinates, on which is based the Theory of Transformations." -- D'Arcy Thompson.Following D'Arcy Thompson, anatomical shape variability in populations is quantified by studying the transformations required to deform one anatomy to another. Dr. Joshi uses this concept to define the average brain atlas as the image that requires the least amount of deformation to deform to all the images.
Applications
While one could create such an atlas to represent the average human brain, it is much more informative to create atlases based on specific subpopulations and then compare the differences between them. This reveals generalized differences or changes that occur between populations in a quantitatively measurable way. This approach has been applied to study numerous neurological diseases such as Autism, Schizophrenia and Alzheimer's.Assessing Trajectory of Brain Growth
Imaging studies of early brain development get increasing attention as improved modeling of the pattern of normal development might lead to a better understanding of origin, timing and nature of morphologic differences in neurodevelopmental disorders such as Autism. Quantitative MR imaging studies face the challenge that cross-sectional inter-individual variability is very large in relation to longitudinal change, which underscores the critical importance of a longitudinal design of such studies. It is the goal of Dr. Joshi and his collaborators to model the trajectory of early brain development, primarily focusing on the most challenging group of very young children in the age range from birth to 6 years, as a 4-dimensional atlas that is represented by a time series of 3-D images and quantitative description of local growth. Shown bellow is a visualization of how an atlas based a population of 2 year olds, differs from an atlas based on a population of 4 year olds. Such comparisons reveal general development trends that occur as children age. By comparing atlases based on the two populations, one can measure the normal rate of development and growth in children between these ages. MRI Data from a populations of 2 year olds and 4 year olds are combined to create unbiased diffeomorphic atlases for each population. |
 A full volumetric analysis is generated based on 3D atlases from the 2 year old population and 3 year old population to reveal areas of greatest brain growth during development. |
Quantifying Metabolic Asymmetry Modulo Structure in Alzheimer's Disease
 Shown in (a) are original MRI scan (top) and the associated structurally symmetric image (bottom) of a subject with AD. Shown in (b) top is the subject's PET scan. Shown in the (b) bottom is the metabolic asymmetry image mapped in to the atlas space. The right panel is the image of the statistical significance of metabolic asymmetry as compared to the normative atlas. |
For more information See:
Dr. Sarang Joshi presents "Statistics of Shape: Simple Statistics on Interesting Spaces".S. Joshi, B. Davis, M Jomier, G. Gerig. “Unbiased Diffeomorphic Atlas Construction for Computational Anatomy,” In Neuroimage, Vol. 23 Suppl. 1, pp. S151--S160. 2004.Publications -- Sarang JoshiVersions Available: [PDF]
