After back-to-back hurricanes forced IEEE VIS organizers to change Florida venues and ultimately abandon in-person conference plans, the event went virtual this week, with a strong presence from the University of Utah Scientific Computing and Imaging (SCI) Institute.
SCI faculty member and VIS General Chair Paul Rosen was gutted by the bad luck, but commended his VIS peers for their response—which included organizing in-person satellite events at the U and beyond. “We had to not just pivot, but double-pivot in two and a half weeks,” Rosen said. “The community really came together and is making the best of the situation.”
VIS, which dates to 1990, is the top forum for advances in visualization and visual analytics. In its 30-year history, SCI has been well-represented at the annual conference and has also hosted/chaired VIS in 2000, 2010, and 2020. According to Rosen, SCI’s presence is especially prolific this year:
- Awards (view all)
- Best Paper
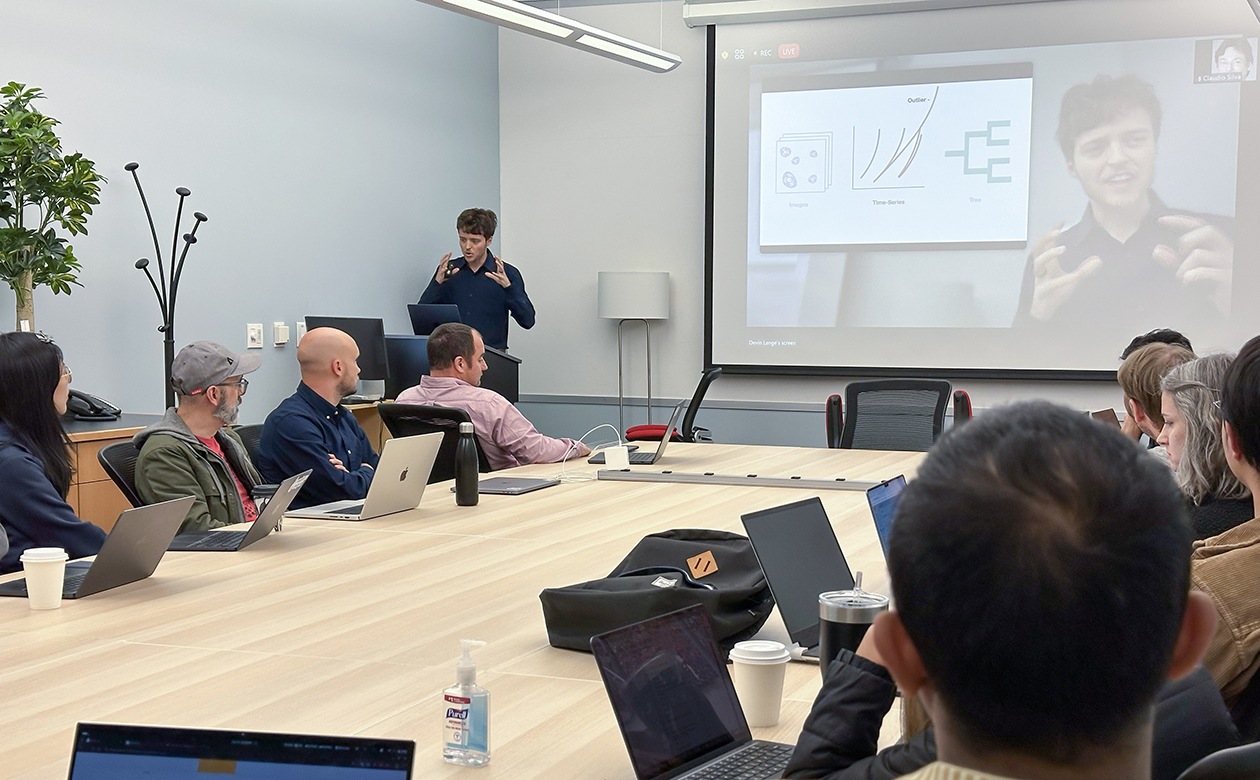
“Aardvark: Composite Visualizations of Trees, Time-Series, and Images”
Authors: SCI alum Devin Lange Ph.D. ’24, Robert Judson-Torres, Thomas Zangle, and SCI faculty Alexander Lex- Three other best papers are from SCI alumni: alum and former faculty Miriah Meyer Ph.D. ’08 and her Ph.D. student Derya Akbaba; Brian Summa Ph.D. ’13; and Han-Wei Shen Ph.D. ’98
- Visualization Dissertation Award
SCI alum Lin Yan Ph.D. ’22, advised by SCI faculty Bei Wang Phillips - Test of Time Award (10 Year)—IEEE INFOVIS 2014 Paper
“UpSet: Visualization of Intersecting Sets”
Authors: SCI faculty Alexander Lex, Nils Gehlenborg, Hendrik Strobelt, Romain Vuillemot, and Hanspeter Pfister - Best Poster Honorable Mention
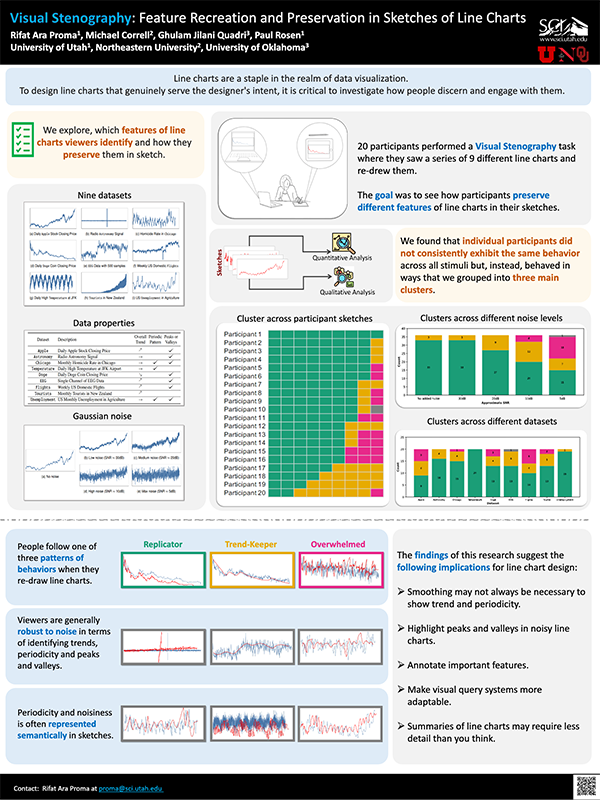
“Visual Stenography: Feature Recreation and Preservation in Sketches of Line Charts”
Authors: SCI Ph.D. student Rifat Ara Proma, Michael Correll, Ghulam Jilani Quadri, and SCI faculty Paul Rosen - Visualization Technical Achievement Award
SCI alum Han-Wei Shen Ph.D. ’98, now an Ohio State University professor, joins SCI faculty Charles Hansen and Valerio Pascucci and former faculty Claudio Silva in receiving this top visualization award
- Best Paper
- SCI Faculty in Leadership Roles: General Chair Paul Rosen, Program Chair Kate Isaacs, Area Curation Committee Chair Alexander Lex
- Workshops
- Uncertainty Visualization: Applications, Techniques, Software, and Decision Frameworks
Chaired by former SCI postdoctoral fellow Tushar Athawale; co-chaired by SCI faculty Paul Rosen and Chris Johnson, SCI alum Kristi Potter Ph.D. ’10, and U alum David Pugmire Ph.D. ’99 - VISions of the Future: Workshop on Sustainable Practices within Visualization and Physicalisation
Co-chaired by SCI faculty Andrew McNutt - EduVis: Workshop on Visualization Education, Literacy, and Activities
AI track organizers include SCI faculty Paul Rosen and his Ph.D. student Md Dilshadur Rahman
- Uncertainty Visualization: Applications, Techniques, Software, and Decision Frameworks
- Workshops
- Papers and More: 13 full papers, 3 short papers, 9 workshop papers, 2 tutorials, 2 panels
Best Paper Award for a Newly Minted Ph.D.
Devin Lange and his team won a best paper award—a first for the 2024 Ph.D. graduate advised by SCI faculty member Alexander Lex. “It is an incredible honor,” said Lange, now a postdoctoral research fellow in biomedical informatics at Harvard Medical School. “VIS has many amazing publications every year, and even having a paper published always feels like a great accomplishment.”
The paper, “Aardvark: Composite Visualizations of Trees, Time-Series, and Images,” is part of an ongoing collaboration between Lange, Lex, Huntsman Cancer Institute researcher Robert Judson-Torres, and U chemical engineering associate professor Thomas A. Zangle. Their first paper won a VIS honorable mention award in 2021.
This year, “Aardvark” ranks among the top 1% of VIS papers: of 557 submissions, 124 were accepted and 5 were named best papers. “Aardvark” develops visualizations that combine three different forms of data—images, time-series, and trees—that describe how cancer cells grow in different ways. These visualizations can help cancer researchers understand their data and can help visualization researchers design better visualizations for complex data.
View the Aardvark website, try the demo, or watch the video below.
A “Broad-Reaching” and “Outstanding” Dissertation
Lin Yan Ph.D. ’22, advised by SCI faculty member Bei Wang Phillips, won the Visualization Dissertation Award for “Merge Trees and Their Variants For Scientific Visualization.” The publication, Yan explained, addresses challenges in big-data analysis by enriching methodologies and tools of topology-based visualization. According to the award citation, “The implications of the thesis are broad-reaching across the field of visualization, and the body of work is outstanding in terms of content and volume.”
“It was such a thrill,” Yan said of receiving the award. “The VIS conference has been such a big deal on my way to pursuing my Ph.D.” She’s also grateful for the chance to highlight her collaborators, including Wang Phillips. “I want to thank Bei, who has been the best supervisor a Ph.D. student could hope for.”
Yan now works as an assistant professor of computer science at Iowa State University. As a student, she often developed her own visualization tools from scratch and mentored junior lab members, her former advisor said. “I am extremely proud of Lin,” Wang Phillips said. “She is very passionate about research and it has been such a pleasure working with her.”
Standing the Test of Time
SCI faculty member Alexander Lex won a prestigious Test of Time Award, which recognizes older, highly cited publications that “are still vibrant and useful today and have had a major impact and influence within and beyond the visualization community,” according to VIS. “I’m deeply honored by this award,” Lex said. He also reflects on the paper’s history and the reasons behind its success in a blog post. “Thanks to the community for this recognition, and to the team for the excellent collaboration.”
From VIS:Already 10 years ago, Alexander Lex, Nils Gehlenborg, Hendrik Strobelt, Romain Vuillemot, and Hanspeter Pfister contributed "UpSet: Visualization of Intersecting Sets" to the IEEE InfoVis community, spawning an extraordinary run of success with their work. Their approach to represent sets, their intersections and their aggregations in a smart tabular layout, paired with highly effective interaction mechanisms, including means to sort and query the data, got highly appreciated on an impressive scale, also far beyond the realm of visualization research, importantly supported and facilitated by the authors' approach to open science and reproducibility. This work is one of very few with a large four-digit number of citations of which a large share is found in other fields of science, making use of UpSet for data visualization. Besides being a wonderful showcase of highly successful visualization research, this work also takes an important place emphasizing the role and potential of interaction in visualization.
Encouraging Effective Line Charts
 A team led by Rifat Ara Proma, a Ph.D. student under SCI faculty member Paul Rosen, won an honorable mention for a poster titled “Visual Stenography: Feature Recreation and Preservation in Sketches of Line Charts.” According to Proma, the project examined what visual features capture viewers' attention when they see a line chart and how they preserve these features when they sketch it.
“Based on our findings, we developed a set of implications for line chart design to help visualization designers or practitioners make better choices while creating line charts,” Proma said. It was amazing to win the honorable mention, she added. “It feels nice knowing that the VIS community found this project interesting. It motivated me to keep working hard on this project and refine it for a broader impact.”

