
Introduction to Image-Based Modeling
 |
 |
 |
 |
 |
 |
Bei Wang Joins the Scientific Computing and Imaging Institute as an Assistant Professor of Computer Science
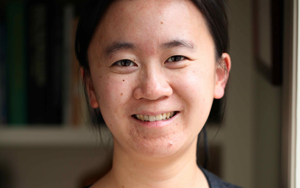 Bei Wang has joined the University of Utah's Scientific Computing and Imaging (SCI) Institute as an Assistant Professor of Computer Science. The SCI Institute focuses on solving important problems in biomedicine, science, and engineering using computation and is an international research leader in the areas of scientific computing, visualization, and image analysis.
Dr. Wang received her Ph.D. in Computer Science from Duke University in 2010. There, she also earned a certificate in Computational Biology and Bioinformatics. She was a postdoctoral fellow from 2010 to 2011, and a research scientist from 2011 to 2016, both at the SCI Institute, University of Utah.
Science-ArtQuiz
 The SCI Institute recently contributed to the Science-ArtQuiz with the Leonardo. Can you distinguish Science from Art???
Paintbrush or microscope? Einstein or Picasso? Is there any difference? Challenge your inner genius with this unique, mind bending science vs art quiz. Can you get a perfect score?
SCI Research Highlighted in Argonne's 10 Year Celebration
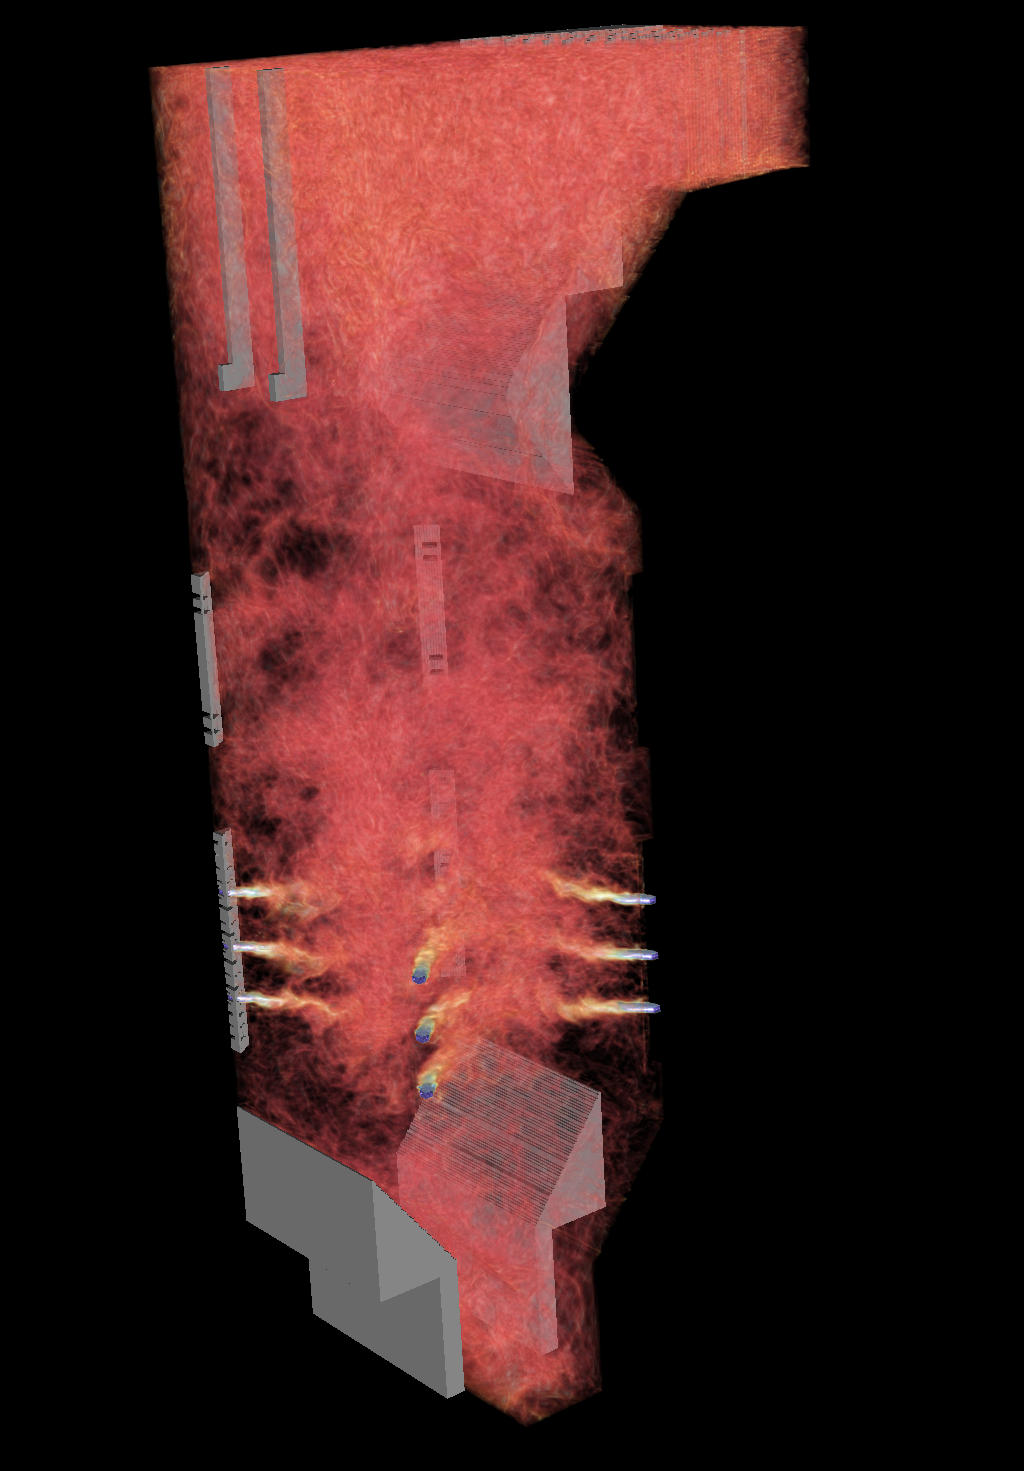
 Modeling detonations to transport explosives safely
Researchers modeled a 2005 explosion that left a 30-by-70-foot crater in a Utah highway, capturing the physics that made the truck's cargo explode more violently than it should have. With such simulations, we can design safer transport for explosives. Led by Martin Berzins, University of Utah
You can see the 10 highlights at https://www.alcf.anl.gov/articles/10-science-highlights-celebrating-10-years-argonne-leadership-computing-facility
Image Analysis Tools for Understanding Connective Tissue Structure
 Sponsored by the Burton Foundation
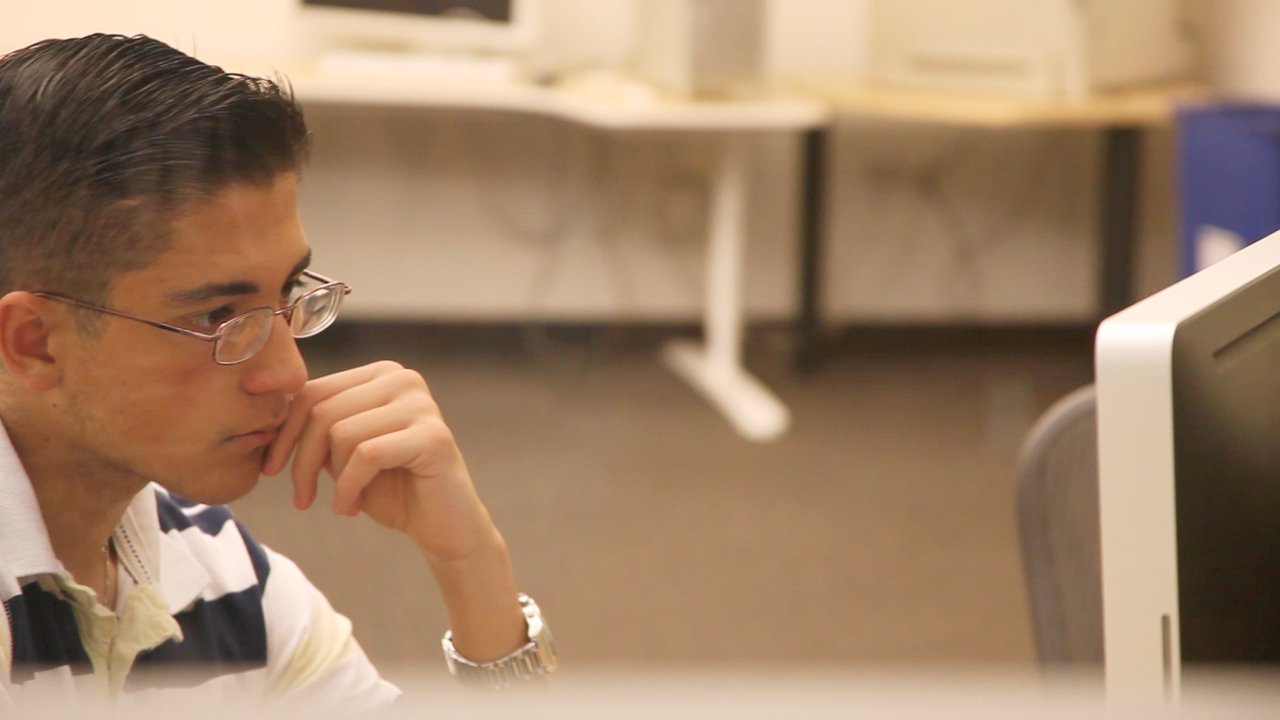
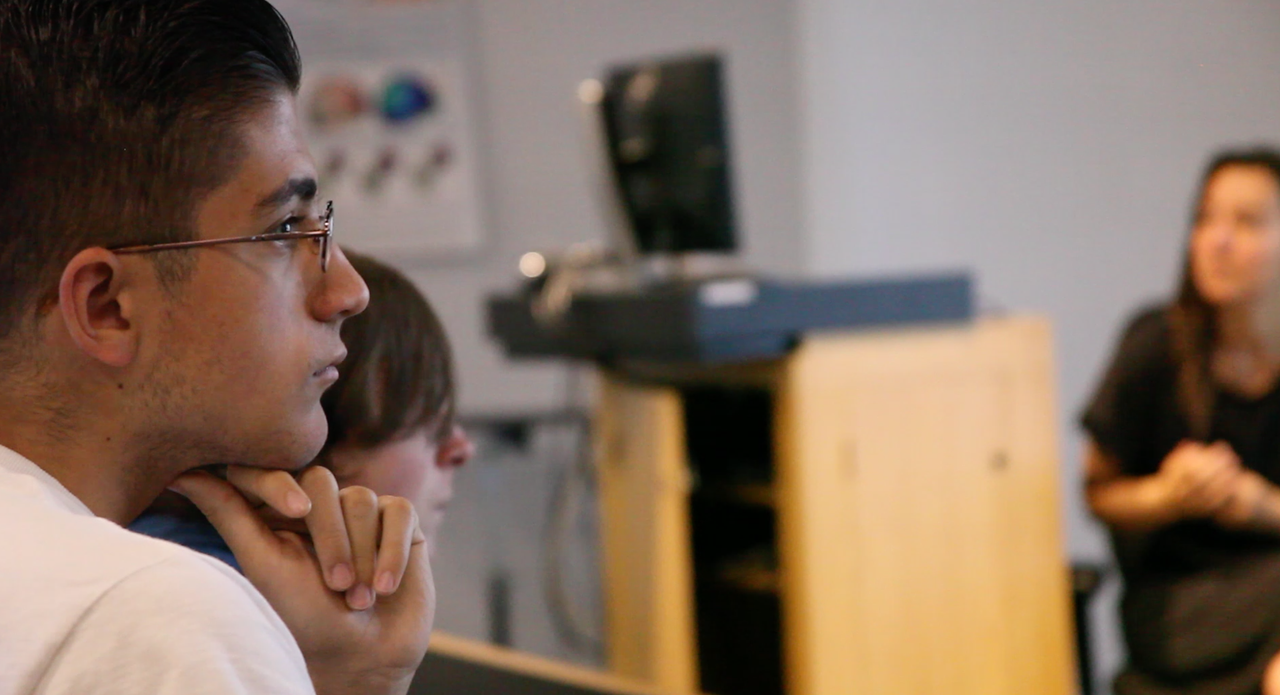
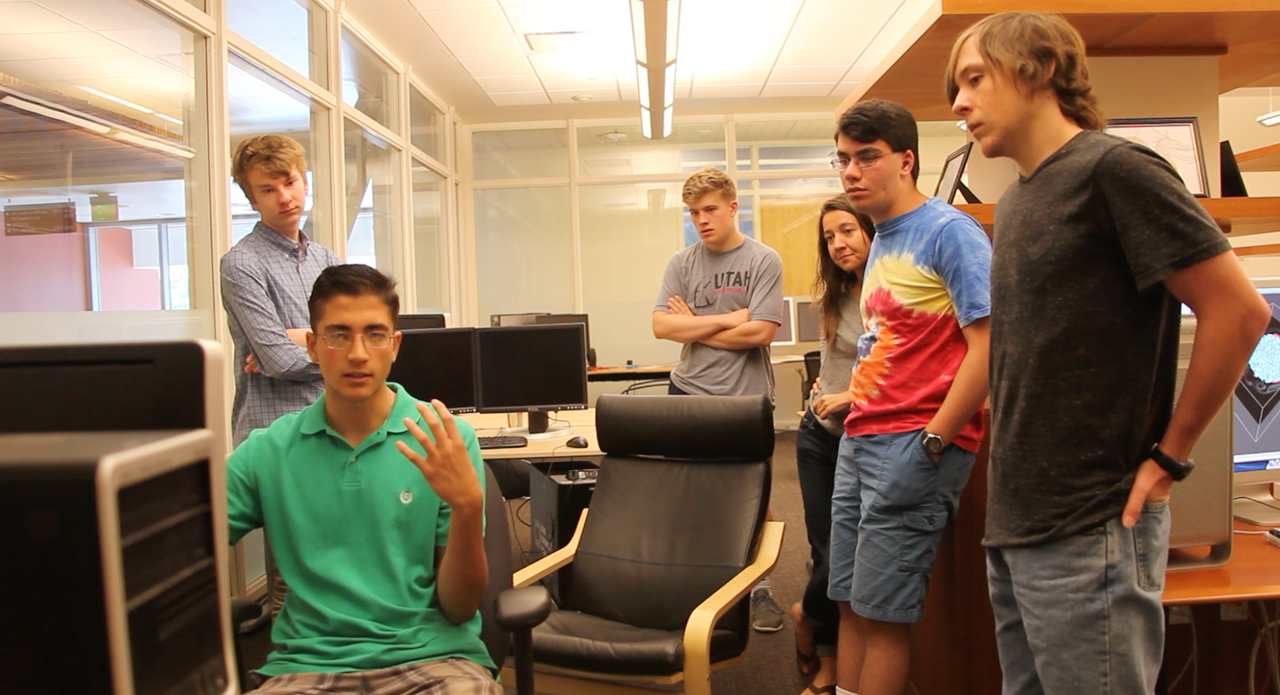
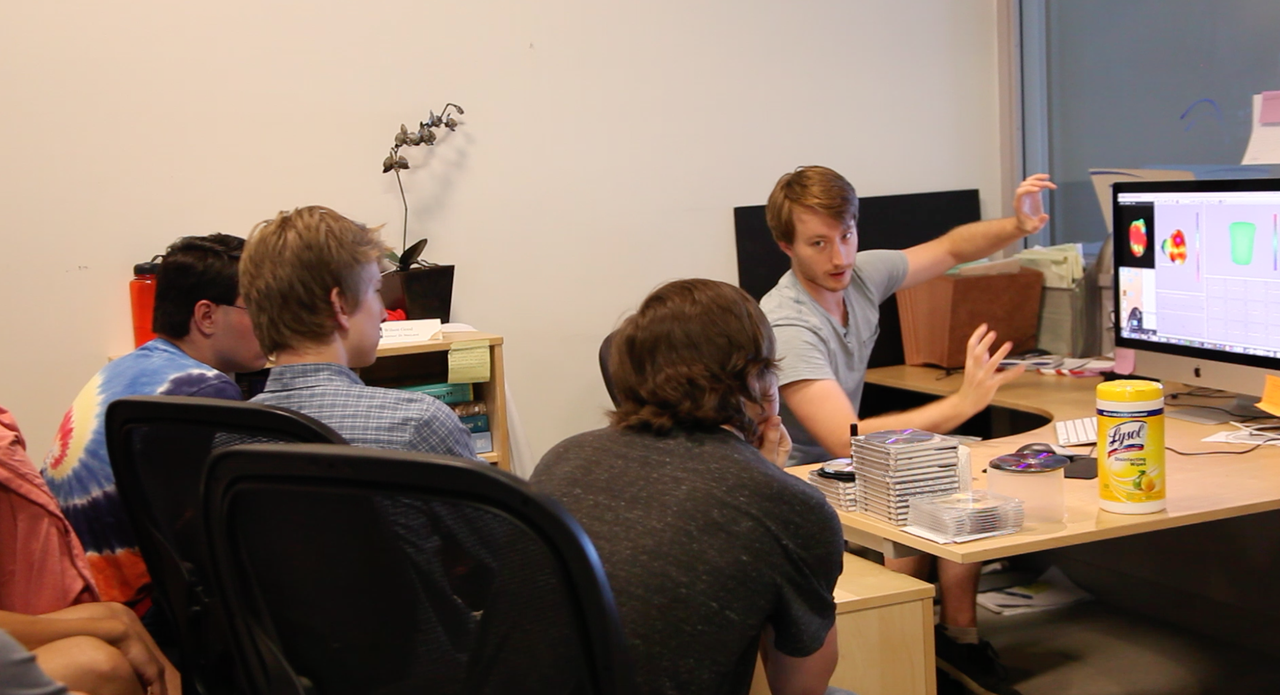
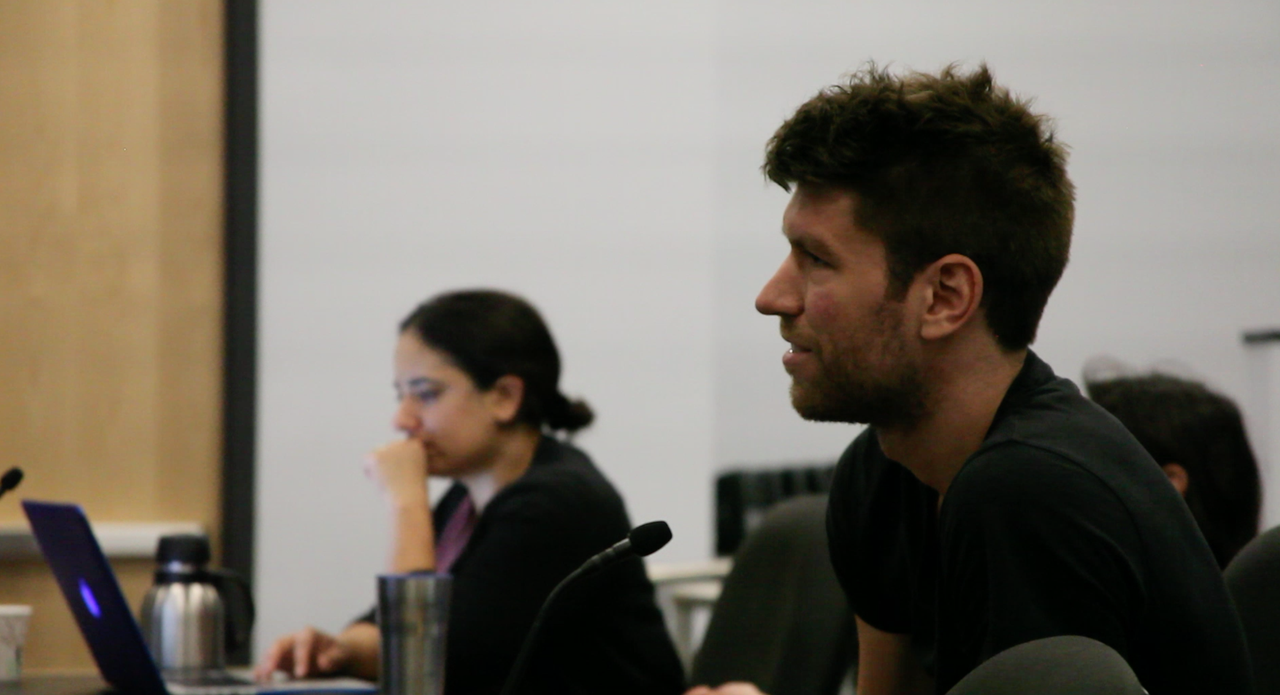
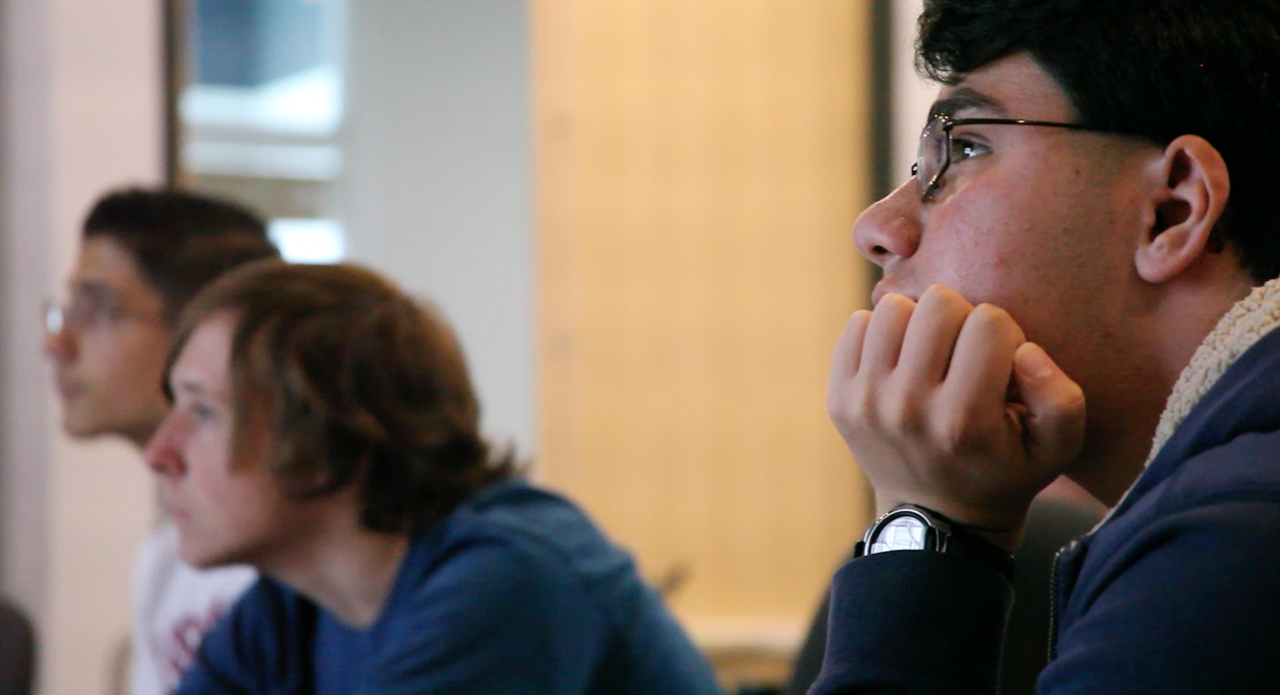
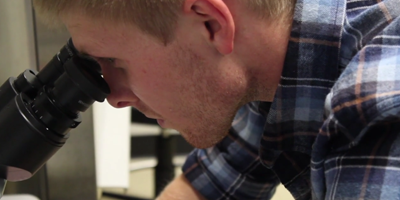
This summer, two Salt Lake area high school students from Copper Hills High School came to the University of Utah to participate in a hands-on research experience. The students learned how image analysis tools help biomechanics researchers understand the effects of structural features of musculoskeletal tissues (e.g. tendons, ligaments, and articular cartilage) on the functional behavior of these tissues.Many musculoskeletal tissue injuries and diseases exhibit altered macroscopic and microscopic tissue structure. The Musculoskeletal Research Laboratories, a research center of the Scientific Computing and Imaging Institute, uses engineered tissue materials to study the effect of these structural changes on tissue behavior. Researchers use many image acquisition techniques to characterize the structure of native and engineered tissues, including optical microscopy, x-ray computed tomography (CT), and electron microscopy. Image analysis tools allow efficient detection and quantification of structural features from these images.
INCITE Awards 351 Million Core Hours to Martin Berzins and Team
 INCITE Grants Awarded to 56 Computational Research Projects
Newswise — OAK RIDGE, Tenn., Nov. 16, 2015–The U.S. Department of Energy's Office of Science announced 56 projects aimed at accelerating discovery and innovation to address some of the world's most challenging scientific questions. The projects will share 5.8 billion core hours on America's two most powerful supercomputers dedicated to open science. The diverse projects will advance knowledge in critical areas ranging from sustainable energy technologies to next-generation materials.
Valerio Pascucci on Cool Science Radio
 Valerio Pascucci, Professor, from the School of Computing and Alessandra Angelucci, Professor of Ophthalmology and Visual Science featured on KCPW and Cool Science Radio.
You can listen to the podcast here.
NCI Grant for Personalized Cancer Diagnostics and Prognostics to Alter and Team
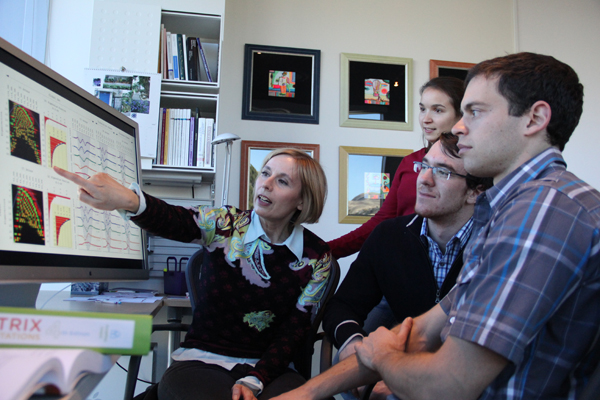 Orly Alter has been awarded a five-year, three million-dollar National Cancer Institute (NCI) grant for the project "Multi-Tensor Decompositions for Personalized Cancer Diagnostics and Prognostics." Co-investigators on her team include pathology professors Cheryl A. Palmer and Carl T. Wittwer, associate professor Elke A. Jarboe, and clinical assistant professor Reha M. Toydemir, and neurosurgery professor Randy L. Jensen.
 Alter, a bioengineering associate professor and a faculty member of the Scientific Computing and Imaging Institute, pioneered the matrix and tensor modeling of large-scale molecular biological data, which have been demonstrated to correctly predict previously unknown cellular mechanisms.
For more see the project website at https://physics.cancer.gov/network/UniversityofUtah.aspx.
Speeding up extreme big brain data analysis
Interactive software tool lets brain researchers explore large-scale, high-res imaging to better understand connections in the brain
October 26, 2015It's tough to unravel the mysteries of the brain when your computer is frozen.
To aid frustrated brain researchers, a multidisciplinary team of scientists at the University of Utah has created a faster method for generating and exploring high-resolution, 3-D images of the brain.
3-D map of the brain: Utah researchers develop software to better understand brain’s network of neurons
The animal brain is so complex, it would take a supercomputer and vast amounts of data to create a detailed 3-D model of the billions of neurons that power it.
But computer scientists and a professor of ophthalmology at the University of Utah have developed software that maps out a monkey's brain and more easily creates a 3-D model, providing a more complete picture of how the brain is wired. Their process was announced this week at Neuroscience 2015, the annual Society for Neuroscience meeting in Chicago.