SCI Publications
2013
V. Pascucci, P.-T. Bremer, A. Gyulassy, G. Scorzelli, C. Christensen, B. Summa, S. Kumar.
“Scalable Visualization and Interactive Analysis Using Massive Data Streams,” In Cloud Computing and Big Data, Advances in Parallel Computing, Vol. 23, IOS Press, pp. 212--230. 2013.
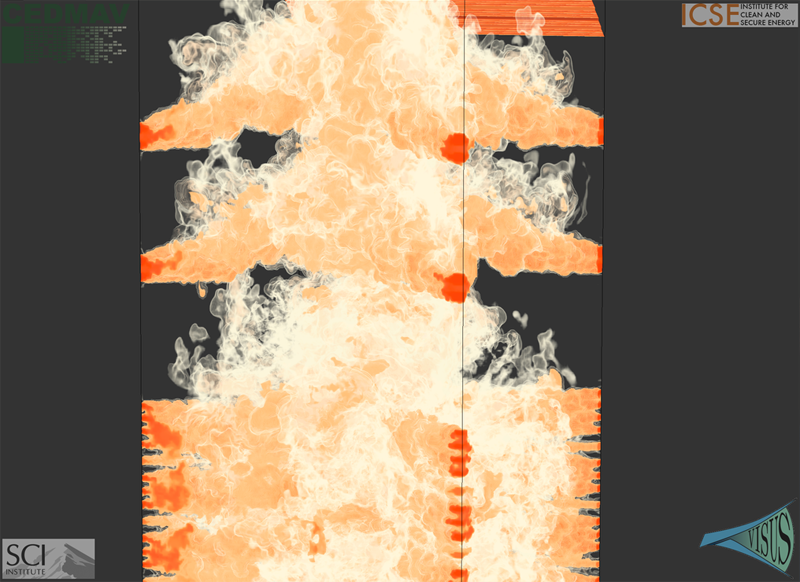
Historically, data creation and storage has always outpaced the infrastructure for its movement and utilization. This trend is increasing now more than ever, with the ever growing size of scientific simulations, increased resolution of sensors, and large mosaic images. Effective exploration of massive scientific models demands the combination of data management, analysis, and visualization techniques, working together in an interactive setting. The ViSUS application framework has been designed as an environment that allows the interactive exploration and analysis of massive scientific models in a cache-oblivious, hardware-agnostic manner, enabling processing and visualization of possibly geographically distributed data using many kinds of devices and platforms.
For general purpose feature segmentation and exploration we discuss a new paradigm based on topological analysis. This approach enables the extraction of summaries of features present in the data through abstract models that are orders of magnitude smaller than the raw data, providing enough information to support general queries and perform a wide range of analyses without access to the original data.
Keywords: Visualization, data analysis, topological data analysis, Parallel I/O
Y. Pathak, B.H. Kopell, A. Szabo, C. Rainey, H. Harsch, C.R. Butson.
“The role of electrode location and stimulation polarity in patient response to cortical stimulation for major depressive disorder,” In Brain Stimulation, Vol. 6, No. 3, Elsevier Ltd., pp. 254--260. July, 2013.
ISSN: 1935-861X
DOI: 10.1016/j.brs.2012.07.001

METHODS: Data were analyzed from eleven patients who received EpCS via a chronically implanted system. Estimates were generated of response probability as a function of duration of stimulation. The relative effectiveness of different stimulation modes was also evaluated. Lastly, a computational analysis of the pre- and post-operative imaging was performed to assess the effects of electrode location. The primary outcome measure was the change in Hamilton Depression Rating Scale (HDRS-28).
RESULTS: Significant improvement was observed in mixed mode stimulation (alternating cathodic and anodic) and continuous anodic stimulation (full power). The changes observed in HDRS-28 over time suggest that 20 weeks of stimulation are necessary to approach a 50\% response probability. Lastly, stimulation in the lateral and anterior regions of DLPFC was correlated with greatest degree of improvement.
CONCLUSIONS: A persistent problem in neuromodulation studies has been the selection of stimulation parameters and electrode location to provide optimal therapeutic response. The approach used in this paper suggests that insights can be gained by performing a detailed analysis of response while controlling for important details such as electrode location and stimulation settings.
Keywords: cortical stimulation
J.R. Peterson, C.A. Wight, M. Berzins.
“Applying high-performance computing to petascale explosive simulations,” In Procedia Computer Science, 2013.
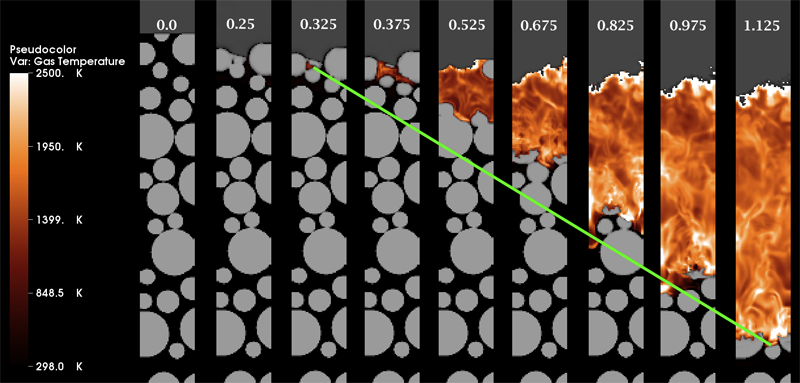
Keywords: Energetic Material Hazards, Uintah, MPM, ICE, MPMICE, Scalable Parallelism, C-SAFE
S. Philip, B. Summa, J. Tierny, P.-T. Bremer, V. Pascucci.
“Scalable Seams for Gigapixel Panoramas,” In Proceedings of the 2013 Eurographics Symposium on Parallel Graphics and Visualization, Note: Awarded Best Paper!, pp. 25--32. 2013.
DOI: 10.2312/EGPGV/EGPGV13/025-032

K. Potter, S. Gerber, E.W. Anderson.
“Visualization of Uncertainty without a Mean,” In IEEE Computer Graphics and Applications, Visualization Viewpoints, Vol. 33, No. 1, pp. 75--79. 2013.
N. Ramesh, T. Tasdizen.
“Three-dimensional alignment and merging of confocal microscopy stacks,” In 2013 IEEE International Conference on Image Processing, IEEE, September, 2013.
DOI: 10.1109/icip.2013.6738297
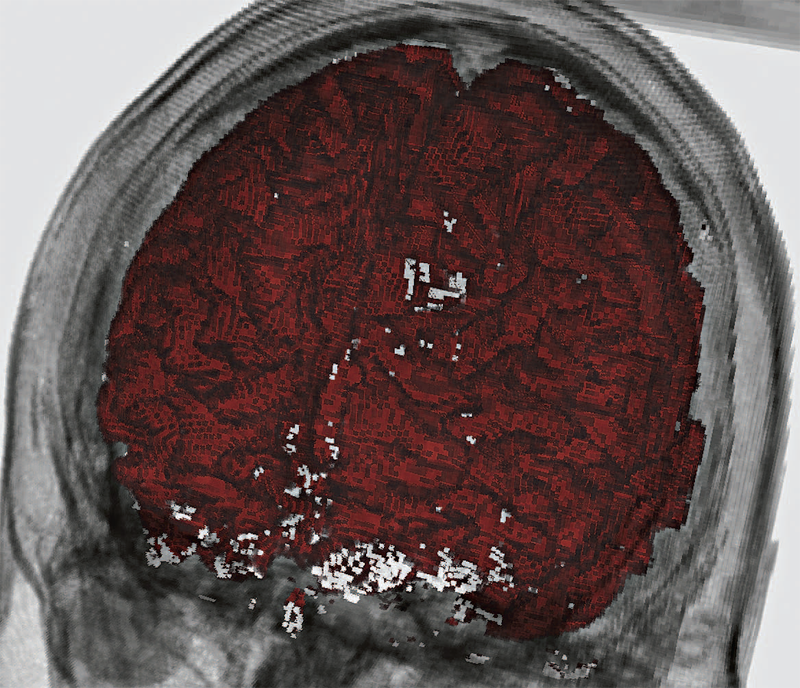
We describe an efficient, robust, automated method for image alignment and merging of translated, rotated and flipped con-focal microscopy stacks. The samples are captured in both directions (top and bottom) to increase the SNR of the individual slices. We identify the overlapping region of the two stacks by using a variable depth Maximum Intensity Projection (MIP) in the z dimension. For each depth tested, the MIP images gives an estimate of the angle of rotation between the stacks and the shifts in the x and y directions using the Fourier Shift property in 2D. We use the estimated rotation angle, shifts in the x and y direction and align the images in the z direction. A linear blending technique based on a sigmoidal function is used to maximize the information from the stacks and combine them. We get maximum information gain as we combine stacks obtained from both directions.
S.P. Reese, C.J. Underwood, J.A. Weiss.
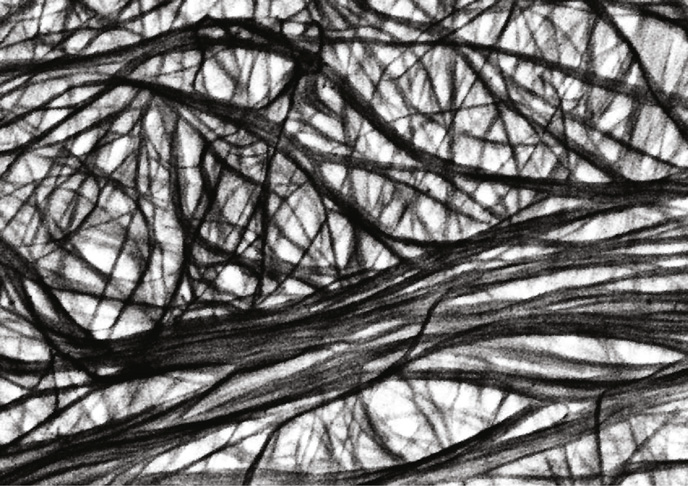
“Effects of decorin proteoglycan on fibrillogenesis, ultrastructure, and mechanics of type I collagen gels,” In Matrix Biology, pp. (in press). 2013.
DOI: 10.1016/j.matbio.2013.04.004
S.P. Reese, B.J. Ellis, J.A. Weiss.
“Micromechanical model of a surrogate for collagenous soft tissues: development, validation, and analysis of mesoscale size effects,” In Biomechanics and Modeling in Mechanobiology, pp. (in press). 2013.
DOI: 10.1007/s10237-013-0475-2

P. Rosen, B. Burton, K. Potter, C.R. Johnson.
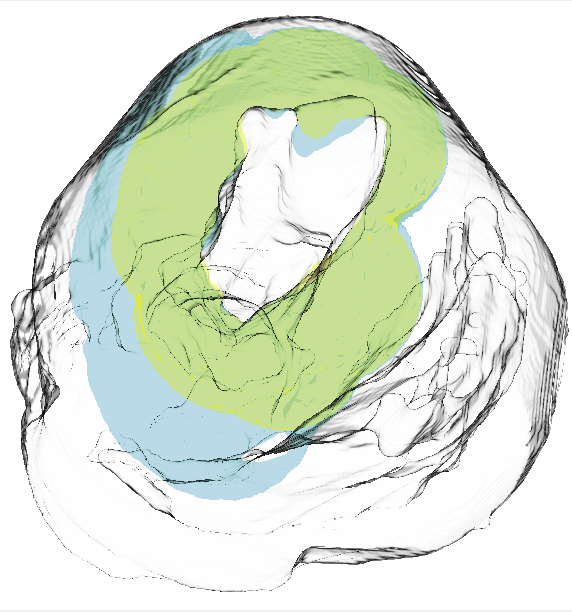
“Visualization for understanding uncertainty in the simulation of myocardial ischemia,” In Proceedings of the 2013 Workshop on Visualization in Medicine and Life Sciences, 2013.
P. Rosen.
“A Visual Approach to Investigating Shared and Global Memory Behavior of CUDA Kernels,” In Computer Graphics Forum, Vol. 32, No. 3, Wiley-Blackwell, pp. 161--170. June, 2013.
DOI: 10.1111/cgf.12103
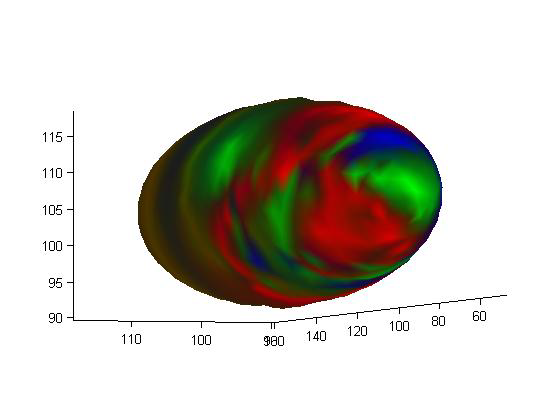
We present an approach to investigate the memory behavior of a parallel kernel executing on thousands of threads simultaneously within the CUDA architecture. Our top-down approach allows for quickly identifying any significant differences between the execution of the many blocks and warps. As interesting warps are identified, we allow further investigation of memory behavior by visualizing the shared memory bank conflicts and global memory coalescence, first with an overview of a single warp with many operations and, subsequently, with a detailed view of a single warp and a single operation. We demonstrate the strength of our approach in the context of a parallel matrix transpose kernel and a parallel 1D Haar Wavelet transform kernel.
A. Rungta, B. Summa, D. Demir, P.-T. Bremer, V. Pascucci.
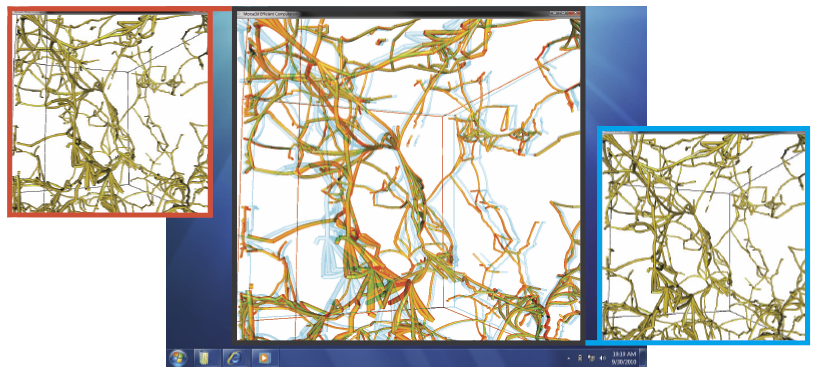
“ManyVis: Multiple Applications in an Integrated Visualization Environment,” In IEEE Transactions on Visualization and Computer Graphics (TVCG), Vol. 19, No. 12, pp. 2878--2885. December, 2013.
N. Sadeghi, M.W. Prastawa, P.T. Fletcher, C. Vachet, Bo Wang, J.H. Gilmore, G. Gerig.
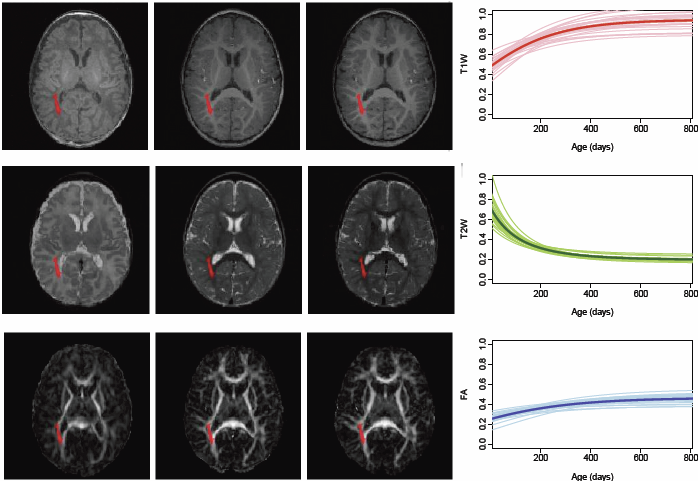
“Multivariate Modeling of Longitudinal MRI in Early Brain Development with Confidence Measures,” In Proceedings of the 2013 IEEE 10th International Symposium on Biomedical Imaging (ISBI), pp. 1400--1403. 2013.
DOI: 10.1109/ISBI.2013.6556795
N. Sadeghi, M.W. Prastawa, P.T. Fletcher, J. Wolff, J.H. Gilmore, G. Gerig.
“Regional characterization of longitudinal DT-MRI to study white matter maturation of the early developing brain,” In NeuroImage, Vol. 68, pp. 236--247. March, 2013.
DOI: 10.1016/j.neuroimage.2012.11.040
PubMed ID: 23235270
N. Sadeghi, C. Vachet, M. Prastawa, J. Korenberg, G. Gerig.
“Analysis of Diffusion Tensor Imaging for Subjects with Down Syndrome,” In Proceedings of the 19th Annual Meeting of the Organization for Human Brain Mapping OHBM, pp. (in print). 2013.
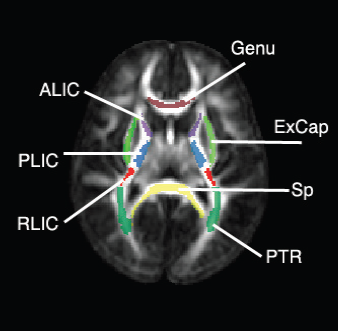
Down syndrome (DS) is the most common chromosome abnormality in humans. It is typically associated with delayed cognitive development and physical growth. DS is also associated with Alzheimer-like dementia [1]. In this study we analyze the white matter integrity of individuals with DS compared to control as is reflected in the diffusion parameters derived from Diffusion Tensor Imaging. DTI provides relevant information about the underlying tissue, which correlates with cognitive function [2]. We present a cross-sectional analysis of white matter tracts of subjects with DS compared to control.
N. Sadeghi.
“Modeling and Analysis of Longitudinal Multimodal Magnetic Resonance Imaging: Application to Early Brain Development,” Note: Ph.D. Thesis, Department of Bioengineering, University of Utah, December, 2013.

Many mental illnesses are thought to have their origins in early stages of development, encouraging increased research efforts related to early neurodevelopment. Magnetic resonance imaging (MRI) has provided us with an unprecedented view of the brain in vivo. More recently, diffusion tensor imaging (DTI/DT-MRI), a magnetic resonance imaging technique, has enabled the characterization of the microstrucutral organization of tissue in vivo. As the brain develops, the water content in the brain decreases while protein and fat content increases due to processes such as myelination and axonal organization. Changes of signal intensity in structural MRI and diffusion parameters of DTI reflect these underlying biological changes.
Longitudinal neuroimaging studies provide a unique opportunity for understanding brain maturation by taking repeated scans over a time course within individuals. Despite the availability of detailed images of the brain, there has been little progress in accurate modeling of brain development or creating predictive models of structure that could help identify early signs of illness. We have developed methodologies for the nonlinear parametric modeling of longitudinal structural MRI and DTI changes over the neurodevelopmental period to address this gap. This research provides a normative model of early brain growth trajectory as is represented in structural MRI and DTI data, which will be crucial to understanding the timing and potential mechanisms of atypical development. Growth trajectories are described via intuitive parameters related to delay, rate of growth and expected asymptotic values, all descriptive measures that can answer clinical questions related to quantitative analysis of growth patterns. We demonstrate the potential of the framework on two clinical studies: healthy controls (singletons and twins) and children at risk of autism. Our framework is designed not only to provide qualitative comparisons, but also to give researchers and clinicians quantitative parameters and a statistical testing scheme. Moreover, the method includes modeling of growth trajectories of individuals, resulting in personalized profiles. The statistical framework also allows for prediction and prediction intervals for subject-specific growth trajectories, which will be crucial for efforts to improve diagnosis for individuals and personalized treatment.
Keywords: autism, brain development, image analysis
Nazmus Saquib.
“Visualizing Intrinsic Isosurface Variation due to Uncertainty Through Heat Kernel Signatures,” Note: Master of Science Thesis, Computational Engineering and Science (CES) Program, University of Utah School of Computing, 2013.
M. Schott, T. Martin, A.V.P. Grosset, S.T. Smith, C.D. Hansen.
“Ambient Occlusion Effects for Combined Volumes and Tubular Geometry,” In IEEE Transactions on Visualization and Computer Graphics (TVCG), Vol. 19, No. 6, Note: Selected as Spotlight paper for June 2013 issue, pp. 913--926. 2013.
DOI: 10.1109/TVCG.2012.306
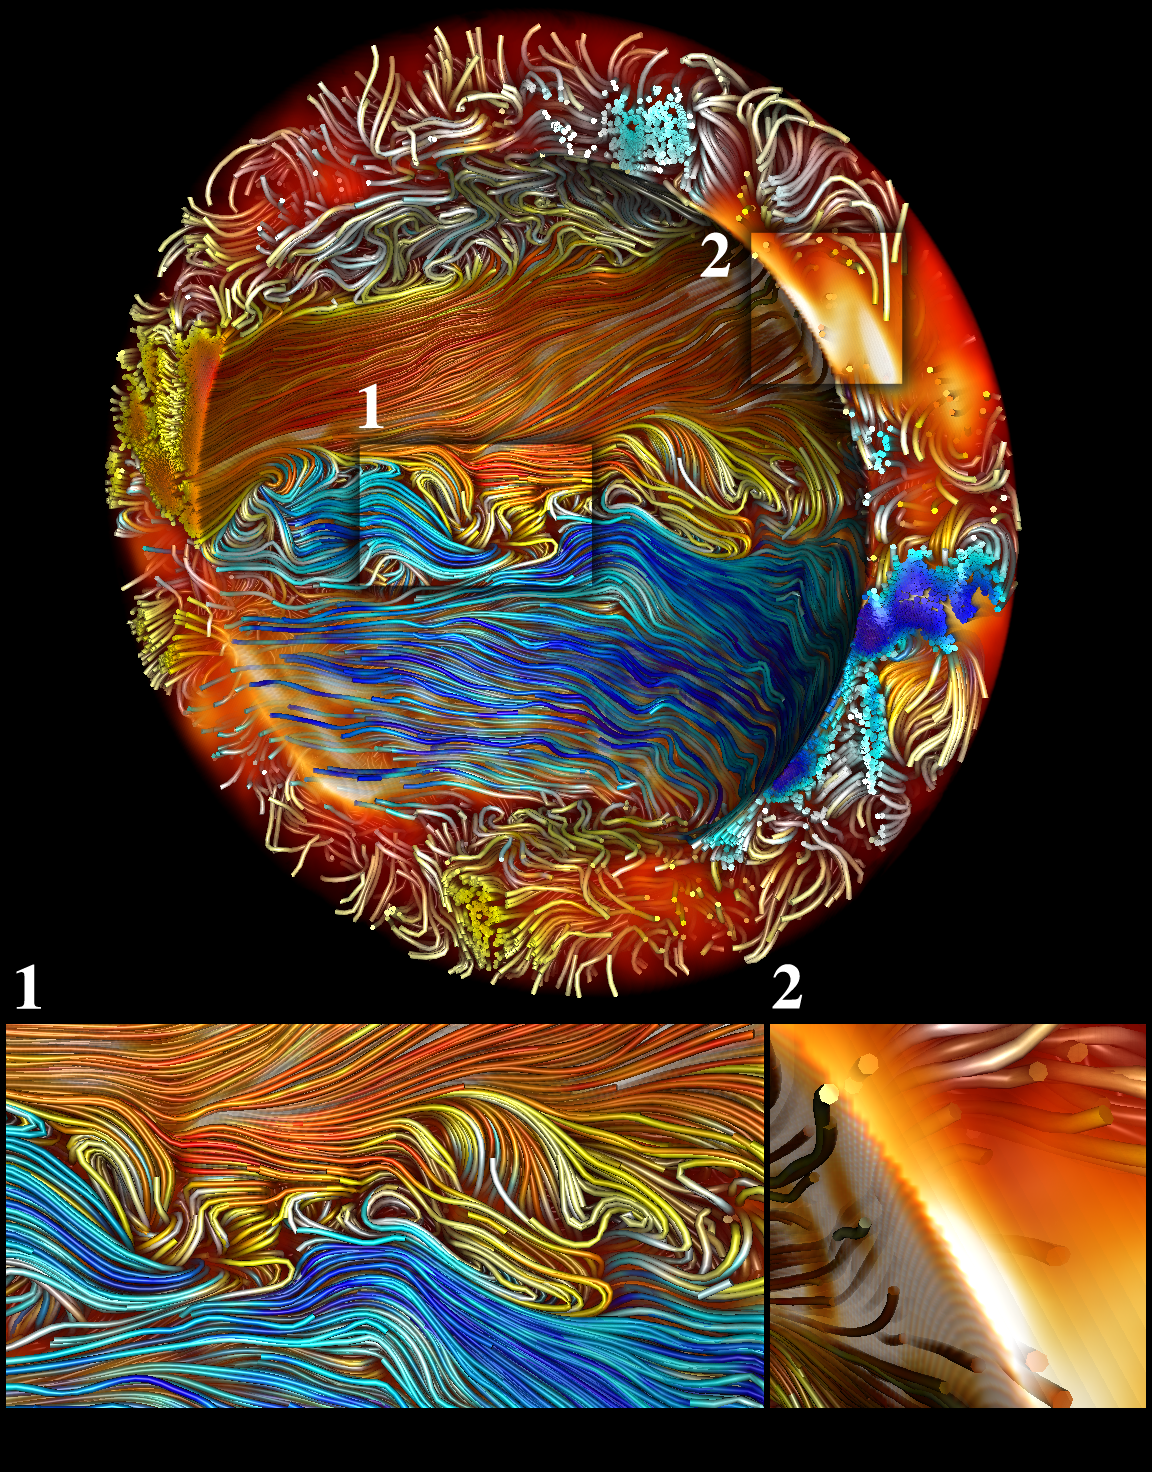
Keywords: Volume rendering, ambient occlusion, stream tubes
P.T. Scheffel, H.B. Henninger, R.T. Burks.
“Relationship of the intercondylar roof and the tibial footprint of the ACL: implications for ACL reconstruction,” In American Journal of Sports Medicine, Vol. 41, No. 2, pp. 396--401. 2013.
DOI: 10.1177/0363546512467955
Background: Debate exists on the proper relation of the anterior cruciate ligament (ACL) footprint with the intercondylar notch in anatomic ACL reconstructions. Patient-specific graft placement based on the inclination of the intercondylar roof has been proposed. The relationship between the intercondylar roof and native ACL footprint on the tibia has not previously been quantified.
Hypothesis: No statistical relationship exists between the intercondylar roof angle and the location of the native footprint of the ACL on the tibia.
Study Design: Case series; Level of evidence, 4.
Methods: Knees from 138 patients with both lateral radiographs and MRI, without a history of ligamentous injury or fracture, were reviewed to measure the intercondylar roof angle of the femur. Roof angles were measured on lateral radiographs. The MRI data of the same knees were analyzed to measure the position of the central tibial footprint of the ACL (cACL). The roof angle and tibial footprint were evaluated to determine if statistical relationships existed.
Results: Patients had a mean ± SD age of 40 ± 16 years. Average roof angle was 34.7° ± 5.2° (range, 23°-48°; 95% CI, 33.9°-35.5°), and it differed by sex but not by side (right/left). The cACL was 44.1% ± 3.4% (range, 36.1%-51.9%; 95% CI, 43.2%-45.0%) of the anteroposterior length of the tibia. There was only a weak correlation between the intercondylar roof angle and the cACL (R = 0.106). No significant differences arose between subpopulations of sex or side.
Conclusion: The tibial footprint of the ACL is located in a position on the tibia that is consistent and does not vary according to intercondylar roof angle. The cACL is consistently located between 43.2% and 45.0% of the anteroposterior length of the tibia. Intercondylar roof–based guidance may not predictably place a tibial tunnel in the native ACL footprint. Use of a generic ACL footprint to place a tibial tunnel during ACL reconstruction may be reliable in up to 95% of patients.
J. Schmidt, M. Berzins, J. Thornock, T. Saad, J. Sutherland.
“Large Scale Parallel Solution of Incompressible Flow Problems using Uintah and hypre,” In 2013 13th IEEE/ACM International Symposium on Cluster, Cloud and Grid Computing (CCGrid), pp. 458--465. 2013.
The Uintah Software framework was developed to provide an environment for solving fluid-structure interaction problems on structured adaptive grids on large-scale, longrunning, data-intensive problems. Uintah uses a combination of fluid-flow solvers and particle-based methods for solids together with a novel asynchronous task-based approach with fully automated load balancing. As Uintah is often used to solve incompressible flow problems in combustion applications it is important to have a scalable linear solver. While there are many such solvers available, the scalability of those codes varies greatly. The hypre software offers a range of solvers and preconditioners for different types of grids. The weak scalability of Uintah and hypre is addressed for particular examples of both packages when applied to a number of incompressible flow problems. After careful software engineering to reduce startup costs, much better than expected weak scalability is seen for up to 100K cores on NSFs Kraken architecture and up to 260K cpu cores, on DOEs new Titan machine. The scalability is found to depend in a crtitical way on the choice of algorithm used by hypre for a realistic application problem.
Keywords: Uintah, hypre, parallelism, scalability, linear equations
M. Seyedhosseini, M. Ellisman, T. Tasdizen.
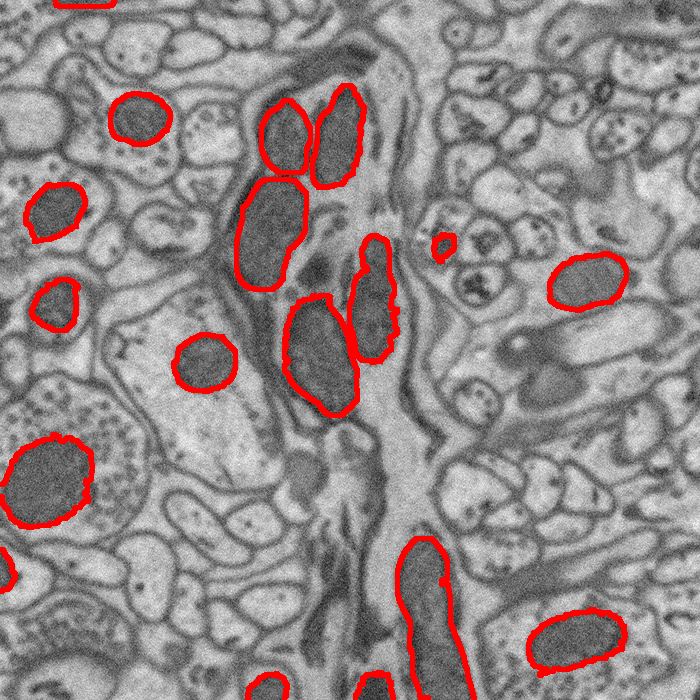
“Segmentation of Mitochondria in Electron Microscopy Images using Algebraic Curves,” In Proceedings of the 2013 IEEE 10th International Symposium on Biomedical Imaging (ISBI), pp. 860--863. 2013.
DOI: 10.1109/ISBI.2013.6556611
Page 48 of 144
