
SCI Publications
2013
![]()
M.D. Harris.
“The geometry and biomechanics of normal and pathomorphologic human hips,” Note: Ph.D. Thesis, Department of Bioengineering, University of Utah, 2013.
C.R. Henak, A.E. Anderson, J.A. Weiss.
“Subject-specific analysis of joint contact mechanics: application to the study of osteoarthritis and surgical planning,” In Journal of Biomechanical Engineering, Vol. 135, No. 2, 2013.
DOI: 10.1115/1.4023386
PubMed ID: 23445048
Advances in computational mechanics, constitutive modeling, and techniques for subject-specific modeling have opened the door to patient-specific simulation of the relationships between joint mechanics and osteoarthritis (OA), as well as patient-specific preoperative planning. This article reviews the application of computational biomechanics to the simulation of joint contact mechanics as relevant to the study of OA. This review begins with background regarding OA and the mechanical causes of OA in the context of simulations of joint mechanics. The broad range of technical considerations in creating validated subject-specific whole joint models is discussed. The types of computational models available for the study of joint mechanics are reviewed. The types of constitutive models that are available for articular cartilage are reviewed, with special attention to choosing an appropriate constitutive model for the application at hand. Issues related to model generation are discussed, including acquisition of model geometry from volumetric image data and specific considerations for acquisition of computed tomography and magnetic resonance imaging data. Approaches to model validation are reviewed. The areas of parametric analysis, factorial design, and probabilistic analysis are reviewed in the context of simulations of joint contact mechanics. Following the review of technical considerations, the article details insights that have been obtained from computational models of joint mechanics for normal joints; patient populations; the study of specific aspects of joint mechanics relevant to OA, such as congruency and instability; and preoperative planning. Finally, future directions for research and application are summarized.
![]()
H.B. Henninger, C.J. Underwood, S.J. Romney, G.L. Davis, J.A. Weiss.
“Effect of Elastin Digestion on the Quasi-Static Tensile Response of Medial Collateral Ligament,” In Journal of Orthopaedic Research, pp. (published online). 2013.
DOI: 10.1002/jor.22352
Elastin is a structural protein that provides resilience to biological tissues. We examined the contributions of elastin to the quasi-static tensile response of porcine medial collateral ligament through targeted disruption of the elastin network with pancreatic elastase. Elastase concentration and treatment time were varied to determine a dose response. Whereas elastin content decreased with increasing elastase concentration and treatment time, the change in peak stress after cyclic loading reached a plateau above 1 U/ml elastase and 6 h treatment. For specimens treated with 2 U/ml elastase for 6 h, elastin content decreased approximately 35%. Mean peak tissue strain after cyclic loading (4.8%, p ≥ 0.300), modulus (275 MPa, p ≥ 0.114) and hysteresis (20%, p ≥ 0.553) were unaffected by elastase digestion, but stress decreased significantly after treatment (up to 2 MPa, p ≤ 0.049). Elastin degradation had no effect on failure properties, but tissue lengthened under the same pre-stress. Stiffness in the linear region was unaffected by elastase digestion, suggesting that enzyme treatment did not disrupt collagen. These results demonstrate that elastin primarily functions in the toe region of the stress–strain curve, yet contributes load support in the linear region. The increase in length after elastase digestion suggests that elastin may pre-stress and stabilize collagen crimp in ligaments
![]()
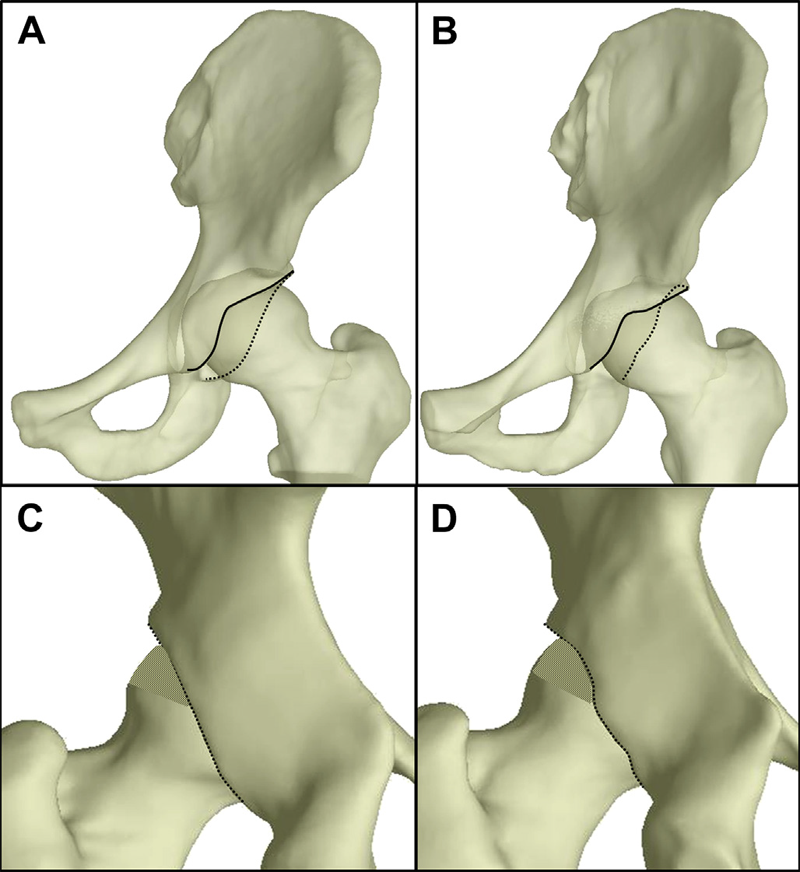
C.R. Henak, Carruth E, A.E. Anderson, M.D. Harris, B.J. Ellis, C.L. Peters, J.A. Weiss.
“Finite element predictions of cartilage contact mechanics in hips with retroverted acetabula,” In Osteoarthritis and Cartilage, Vol. 21, pp. 1522-1529. 2013.
DOI: 10.1016/j.joca.2013.06.008
Background
A contributory factor to hip osteoarthritis (OA) is abnormal cartilage mechanics. Acetabular retroversion, a version deformity of the acetabulum, has been postulated to cause OA via decreased posterior contact area and increased posterior contact stress. Although cartilage mechanics cannot be measured directly in vivo to evaluate the causes of OA, they can be predicted using finite element (FE) modeling.
Objective
The objective of this study was to compare cartilage contact mechanics between hips with normal and retroverted acetabula using subject-specific FE modeling.
Methods
Twenty subjects were recruited and imaged: 10 with normal acetabula and 10 with retroverted acetabula. FE models were constructed using a validated protocol. Walking, stair ascent, stair descent and rising from a chair were simulated. Acetabular cartilage contact stress and contact area were compared between groups.
Results
Retroverted acetabula had superomedial cartilage contact patterns, while normal acetabula had widely distributed cartilage contact patterns. In the posterolateral acetabulum, average contact stress and contact area during walking and stair descent were 2.6–7.6 times larger in normal than retroverted acetabula (P ≤ 0.017). Conversely, in the superomedial acetabulum, peak contact stress during walking was 1.2–1.6 times larger in retroverted than normal acetabula (P ≤ 0.044). Further differences varied by region and activity.
Conclusions
This study demonstrated superomedial contact patterns in retroverted acetabula vs widely distributed contact patterns in normal acetabula. Smaller posterolateral contact stress in retroverted acetabula than in normal acetabula suggests that increased posterior contact stress alone may not be the link between retroversion and OA.
C.R. Henak, A.K. Kapron, B.J. Ellis, S.A. Maas, A.E. Anderson, J.A. Weiss.
“Specimen-specific predictions of contact stress under physiological loading in the human hip: validation and sensitivity studies,” In Biomechanics and Modeling in Mechanobiology, pp. 1-14. 2013.
DOI: 10.1007/s10237-013-0504-1
Hip osteoarthritis may be initiated and advanced by abnormal cartilage contact mechanics, and finite element (FE) modeling provides an approach with the potential to allow the study of this process. Previous FE models of the human hip have been limited by single specimen validation and the use of quasi-linear or linear elastic constitutive models of articular cartilage. The effects of the latter assumptions on model predictions are unknown, partially because data for the instantaneous behavior of healthy human hip cartilage are unavailable. The aims of this study were to develop and validate a series of specimen-specific FE models, to characterize the regional instantaneous response of healthy human hip cartilage in compression, and to assess the effects of material nonlinearity, inhomogeneity and specimen-specific material coefficients on FE predictions of cartilage contact stress and contact area. Five cadaveric specimens underwent experimental loading, cartilage material characterization and specimen-specific FE modeling. Cartilage in the FE models was represented by average neo-Hookean, average Veronda Westmann and specimen- and region-specific Veronda Westmann hyperelastic constitutive models. Experimental measurements and FE predictions compared well for all three cartilage representations, which was reflected in average RMS errors in contact stress of less than 25 %. The instantaneous material behavior of healthy human hip cartilage varied spatially, with stiffer acetabular cartilage than femoral cartilage and stiffer cartilage in lateral regions than in medial regions. The Veronda Westmann constitutive model with average material coefficients accurately predicted peak contact stress, average contact stress, contact area and contact patterns. The use of subject- and region-specific material coefficients did not increase the accuracy of FE model predictions. The neo-Hookean constitutive model underpredicted peak contact stress in areas of high stress. The results of this study support the use of average cartilage material coefficients in predictions of cartilage contact stress and contact area in the normal hip. The regional characterization of cartilage material behavior provides the necessary inputs for future computational studies, to investigate other mechanical parameters that may be correlated with OA and cartilage damage in the human hip. In the future, the results of this study can be applied to subject-specific models to better understand how abnormal hip contact stress and contact area contribute to OA.
![]()
C.R. Henak.
“Cartilage and labrum mechanics in the normal and pathomorphologic human hip,” Note: Ph.D. Thesis, Department of Bioengineering, University of Utah, 2013.
![]()
H. Hernandez, J. Knezevic, T. Fogal, T. Sherman, T. Jevremovic.
“Visual numerical steering in 3D AGENT code system for advanced nuclear reactor modeling and design,” In Annals of Nuclear Energy, Vol. 55, pp. 248--257. 2013.
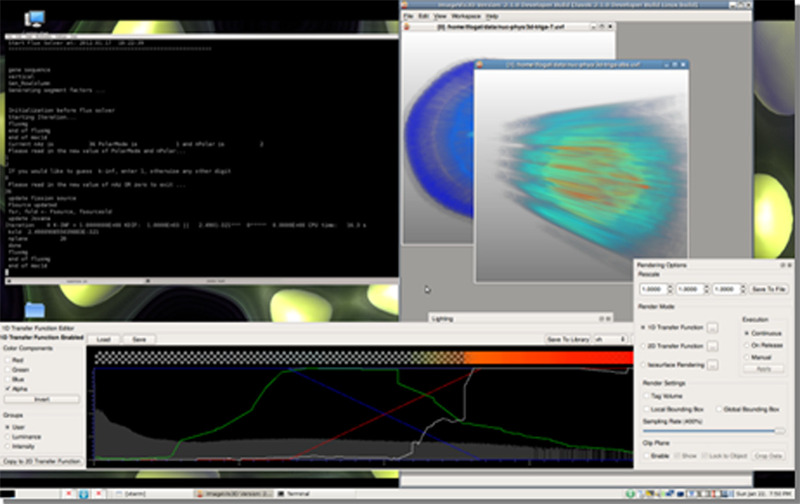
Keywords: Numerical steering, AGENT code, Deterministic neutron transport codes, Method of Characteristics, R-functions, Numerical visualizations
![]()
K. Higuchi, M. Akkaya, M. Koopmann, J.J. Blauer, N.S. Burgon, K. Damal, R. Ranjan, E. Kholmovski, R.S. Macleod, N.F. Marrouche..
“The Effect of Fat Pad Modification during Ablation of Atrial Fibrillation: Late Gadolinium Enhancement MRI Analysis,” In Pacing and Clinical Electrophysiology (PACE), Vol. 36, No. 4, pp. 467--476. April, 2013.
DOI: 10.1111/pace.12084
PubMed ID: 23356963
PubMed Central ID: PMC3651513
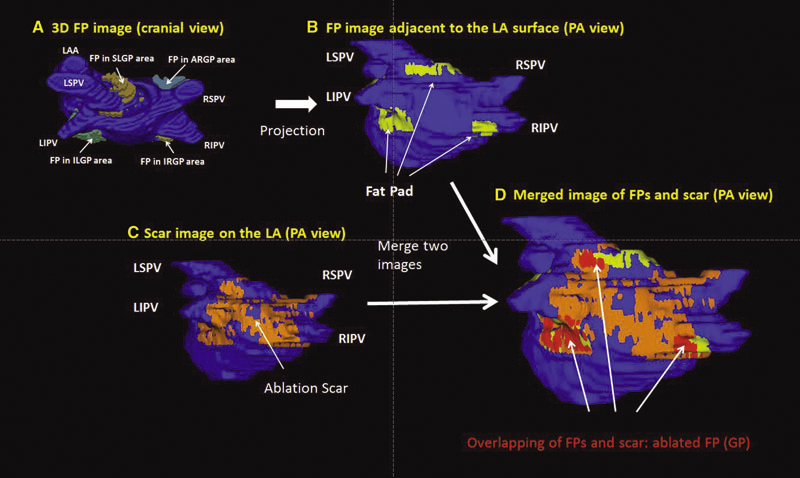
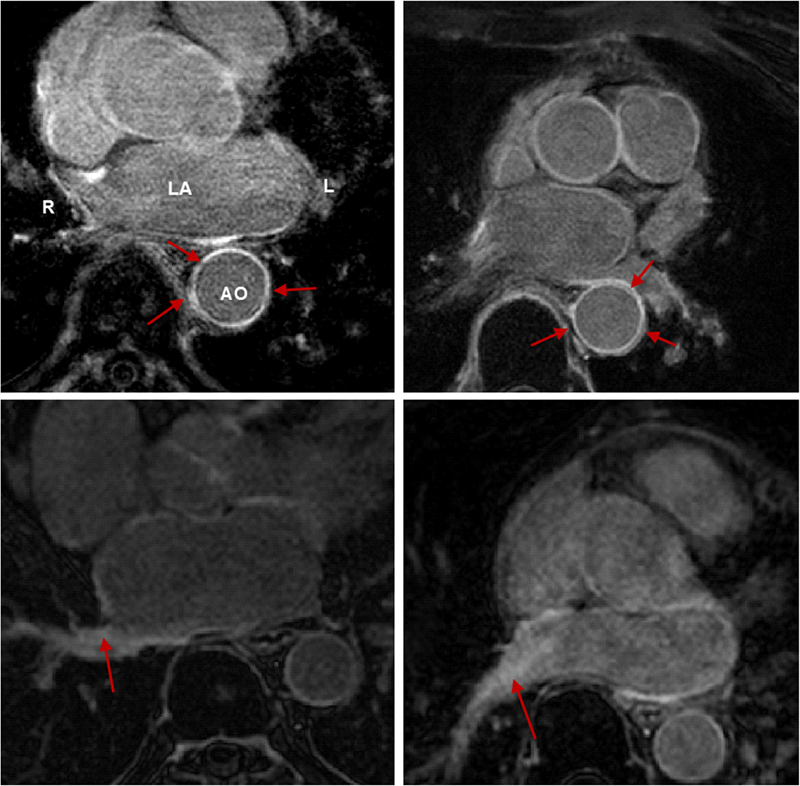
Background: Magnetic resonance imaging (MRI) can visualize locations of both the ablation scar on the left atrium (LA) after atrial fibrillation (AF) ablation and epicardial fat pads (FPs) containing ganglionated plexi (GP).
Methods: We investigated 60 patients who underwent pulmonary vein antrum (PVA) isolation along with LA posterior wall and septal debulking for AF. FPs around the LA surface in well-known GP areas (which were considered as the substitution of GP areas around the LA) were segmented from the dark-blood MRI. Then the FP and the ablation scar image visualized by late gadolinium enhancement (LGE)-MRI on the LA were merged together. Overlapping areas of FP and the ablation scar image were considered as the ablated FP areas containing GP. Patients underwent 24-hour Holter monitoring after ablation for the analysis of heart rate variability.
Results: Ablated FP area was significantly wider in patients without AF recurrence than those in patients with recurrence (5.6 ± 3.1 cm2 vs 4.2 ± 2.7 cm2 ,P = 0.03). The mean values of both percentage of differences greater than 50 ms in the RR intervals (pRR > 50) and standard deviation of RR intervals over the entire analyzed period (SDNN), which were obtained from 24-hour Holter monitoring 1-day post-AF ablation, were significantly lower in patients without recurrence than those in patients with recurrence (5.8 ± 6.0% vs 14.0 ± 10.1%; P = 0.0005, 78.7 ± 32.4 ms vs 109.2 ± 43.5 ms; P = 0.005). There was a significant negative correlation between SDNN and the percentage of ablated FP area (Y =- 1.3168X + 118.96, R2 = 0.1576, P = 0.003).
Conclusion: Extensively ablating LA covering GP areas along with PVA isolation enhanced the denervation of autonomic nerve system and seemed to improve procedural outcome in patients with AF.
Keywords: ganglionated plexi, fat pad, atrial fibrillation, catheter ablation, LGE-MRI
![]()
J. Hinkle, S. Joshi.
“PDiff: Irrotational Diffeomorphisms for Computational Anatomy,” In Proceedings of the International Conference on Information Processing in Medical Imaging (IPMI), Lecture Notes in Computer Science (LNCS), pp. (accepted). 2013.
![]()
T. Höllt, A. Magdy, G. Chen, G. Gopalakrishnan, I. Hoteit, C.D. Hansen, M. Hadwiger.
“Visual Analysis of Uncertainties in Ocean Forecasts for Planning and Operation of Off-Shore Structures,” In Proceedings of 2013 IEEE Pacific Visualization Symposium (PacificVis), Note: Received Honerable Mention, pp. 185--192. 2013.
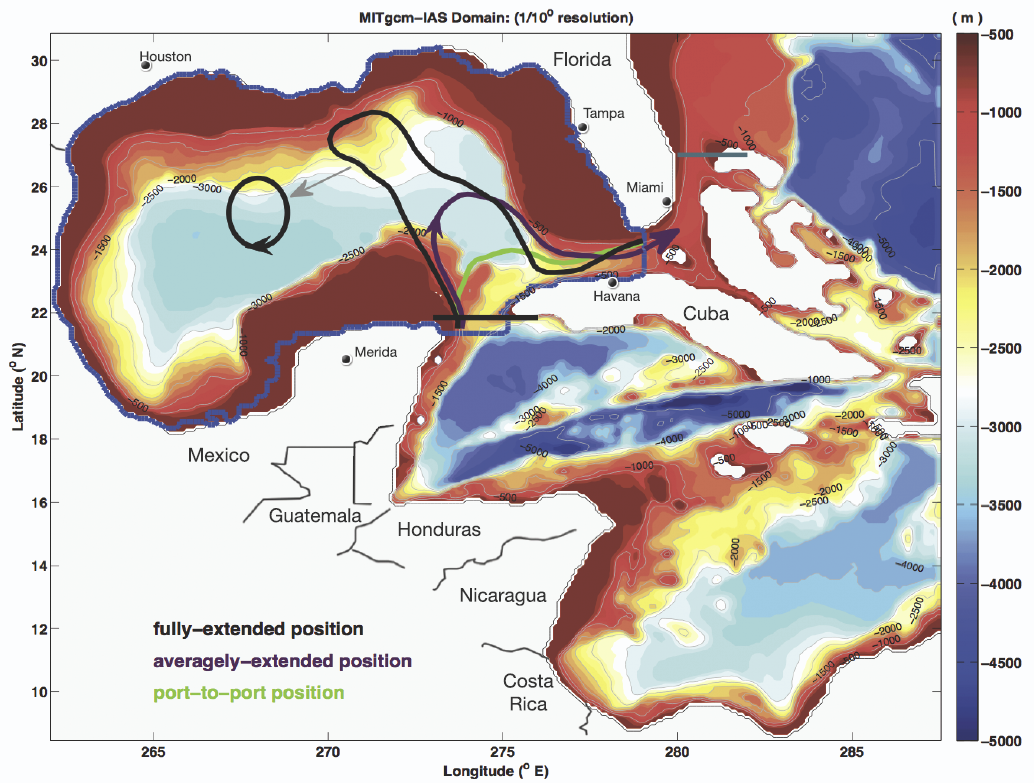
Keywords: Uncertainty, Ensemble Simulation, Risk Estimate
![]()
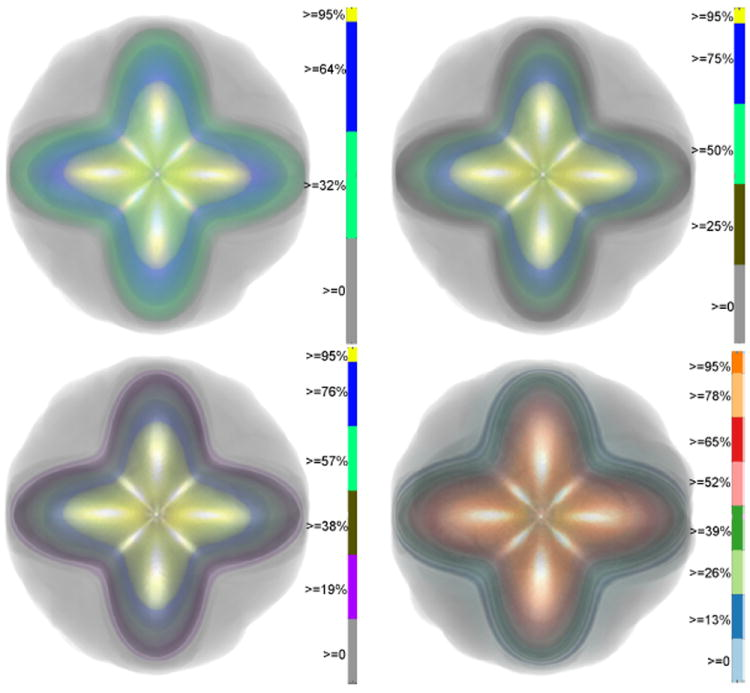
F. Jiao, J.M. Phillips, Y. Gur, C.R. Johnson.
“Uncertainty Visualization in HARDI based on Ensembles of ODFs,” In Proceedings of 2013 IEEE Pacific Visualization Symposium, pp. 193--200. 2013.
PubMed ID: 24466504
PubMed Central ID: PMC3898522
C.R. Johnson, A. Pang (Eds.).
“International Journal for Uncertainty Quantification,” Subtitled “Special Issue on Working with Uncertainty: Representation, Quantification, Propagation, Visualization, and Communication of Uncertainty,” In Int. J. Uncertainty Quantification, Vol. 3, No. 2, Begell House, Inc., pp. vii--viii. 2013.
ISSN: 2152-5080
DOI: 10.1615/Int.J.UncertaintyQuantification.v3.i2
C.R. Johnson, A. Pang (Eds.).
“International Journal for Uncertainty Quantification,” Subtitled “Special Issue on Working with Uncertainty: Representation, Quantification, Propagation, Visualization, and Communication of Uncertainty,” In Int. J. Uncertainty Quantification, Vol. 3, No. 3, Begell House, Inc., 2013.
ISSN: 2152-5080
DOI: 10.1615/Int.J.UncertaintyQuantification.v3.i3
![]()
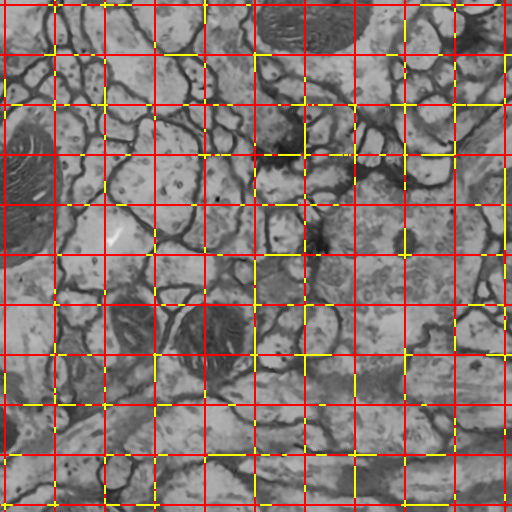
C. Jones, T. Liu, M. Ellisman, T. Tasdizen.
“Semi-Automatic Neuron Segmentation in Electron Microscopy Images Via Sparse Labeling,” In Proceedings of the 2013 IEEE 10th International Symposium on Biomedical Imaging (ISBI), pp. 1304--1307. April, 2013.
DOI: 10.1109/ISBI.2013.6556771
![]()
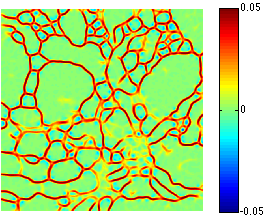
C. Jones, M. Seyedhosseini, M. Ellisman, T. Tasdizen.
“Neuron Segmentation in Electron Microscopy Images Using Partial Differential Equations,” In Proceedings of 2013 IEEE 10th International Symposium on Biomedical Imaging (ISBI), pp. 1457--1460. April, 2013.
DOI: 10.1109/ISBI.2013.6556809
![]()
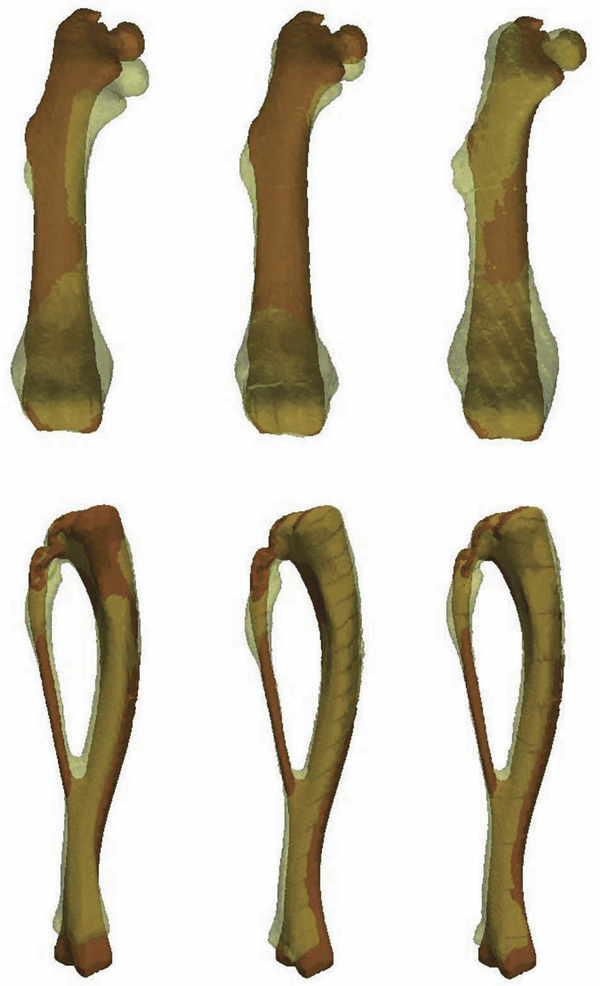
K.B. Jones, M. Datar, S. Ravichandran, H. Jin, E. Jurrus, R.T. Whitaker, M.R. Capecchi.
“Toward an Understanding of the Short Bone Phenotype Associated with Multiple Osteochondromas,” In Journal of Orthopaedic Research, Vol. 31, No. 4, pp. 651--657. 2013.
DOI: 10.1002/jor.22280
PubMed ID: 23192691
PubMed Central ID: PMC3683979
![]()
R. Karim, R.J. Housden, M. Balasubramaniam, Z. Chen, D. Perry, A. Uddin, Y. Al-Beyatti, E. Palkhi, P. Acheampong, S. Obom, A. Hennemuth, Y. Lu, W. Bai, W. Shi, Y. Gao, H.-O. Peitgen, P. Radau, R. Razavi, A. Tannenbaum, D. Rueckert, J. Cates, T. Schaeffter, D. Peters, R.S. MacLeod, K. Rhode.
“Evaluation of Current Algorithms for Segmentation of Scar Tissue from Late Gadolinium Enhancement Cardiovascular Magnetic Resonance of the Left Atrium: An Open-Access Grand Challenge,” In Journal of Cardiovascular Magnetic Resonance, Vol. 15, No. 105, 2013.
DOI: 10.1186/1532-429X-15-105
Background: Late Gadolinium enhancement (LGE) cardiovascular magnetic resonance (CMR) imaging can be used to visualise regions of fibrosis and scarring in the left atrium (LA) myocardium. This can be important for treatment stratification of patients with atrial fibrillation (AF) and for assessment of treatment after radio frequency catheter ablation (RFCA). In this paper we present a standardised evaluation benchmarking framework for algorithms segmenting fibrosis and scar from LGE CMR images. The algorithms reported are the response to an open challenge that was put to the medical imaging community through an ISBI (IEEE International Symposium on Biomedical Imaging) workshop.
Methods: The image database consisted of 60 multicenter, multivendor LGE CMR image datasets from patients with AF, with 30 images taken before and 30 after RFCA for the treatment of AF. A reference standard for scar and fibrosis was established by merging manual segmentations from three observers. Furthermore, scar was also quantified using 2, 3 and 4 standard deviations (SD) and full-width-at-half-maximum (FWHM) methods. Seven institutions responded to the challenge: Imperial College (IC), Mevis Fraunhofer (MV), Sunnybrook Health Sciences (SY), Harvard/Boston University (HB), Yale School of Medicine (YL), King’s College London (KCL) and Utah CARMA (UTA, UTB). There were 8 different algorithms evaluated in this study.
Results: Some algorithms were able to perform significantly better than SD and FWHM methods in both pre- and post-ablation imaging. Segmentation in pre-ablation images was challenging and good correlation with the reference standard was found in post-ablation images. Overlap scores (out of 100) with the reference standard were as follows: Pre: IC = 37, MV = 22, SY = 17, YL = 48, KCL = 30, UTA = 42, UTB = 45; Post: IC = 76, MV = 85, SY = 73, HB = 76, YL = 84, KCL = 78, UTA = 78, UTB = 72.
Conclusions: The study concludes that currently no algorithm is deemed clearly better than others. There is scope for further algorithmic developments in LA fibrosis and scar quantification from LGE CMR images. Benchmarking of future scar segmentation algorithms is thus important. The proposed benchmarking framework is made available as open-source and new participants can evaluate their algorithms via a web-based interface.
Keywords: Late gadolinium enhancement, Cardiovascular magnetic resonance, Atrial fibrillation, Segmentation, Algorithm benchmarking
![]()
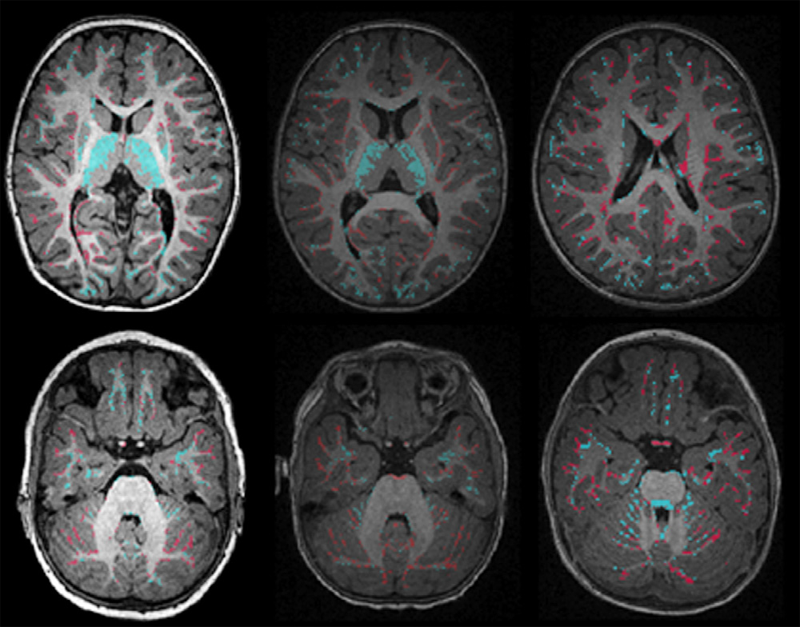
S.H. Kim, V. Fonov, C. Dietrich, C. Vachet, H.C. Hazlett, R.G. Smith, M. Graves, J. Piven, J.H. Gilmore, D.L. Collins, G. Gerig, M. Styner, The IBIS network.
“Adaptive prior probability and spatial temporal intensity change estimation for segmentation of the one-year-old human brain,” In Journal of Neuroscience Methods, Vol. 212, No. 1, Note: Published online Sept. 29, pp. 43--55. January, 2013.
DOI: 10.1016/j.jneumeth.2012.09.01
PubMed Central ID: PMC3513941
![]()
R.M. Kirby, M.D. Meyer.
“Visualization Collaborations: What Works and Why,” In IEEE Computer Graphics and Applications: Visualization Viewpoints, Vol. 33, No. 6, pp. 82--88. 2013.
Of particular interest to us is their vision for collaboration. McCormick and his colleagues envisioned an interdisciplinary team that through close interaction would develop visualization tools that not only were effective in the context of their immediate collaborative environment but also could be reused by scientists and engineers in other fields. McCormick and his colleagues categorized the types of researchers they imagined constituting these teams, one type being the "visualization scientist/engineer." They even commented on the skills these individuals might have. However, they provided little guidance on how to make such teams successful.
In the more than 25 years since the report, researchers have refined the concepts of interaction versus collaboration,3 interdisciplinary versus multidisciplinary teams,4,5 and independence versus interdependence.6 Here, we use observations from our collective 18 years of collaborative visualization research to help shed light on not just the composition of current and future visualization collaborative teams but also pitfalls and recommendations for successful collaboration. Although our statements might reflect what seasoned visualization researchers are already doing, we believe that reexpressing and possibly reaffirming basic collaboration principles provide benefits.
![]()
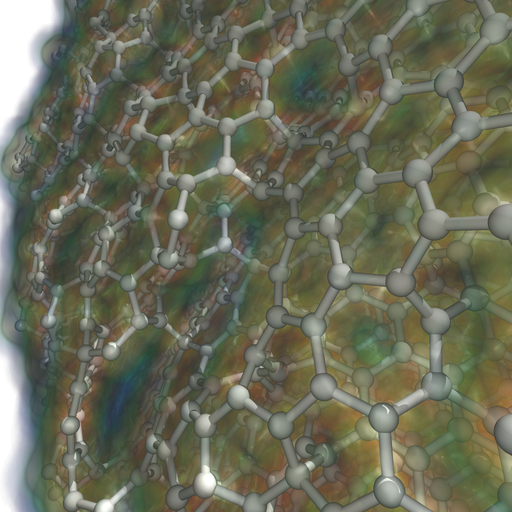
A. Knoll, I. Wald, P. Navratil, M. E Papka,, K. P Gaither.
“Ray Tracing and Volume Rendering Large Molecular Data on Multi-core and Many-core Architectures.,” In Proc. 8th International Workshop on Ultrascale Visualization at SC13 (Ultravis), 2013, 2013.
Page 46 of 144