SCIx to showcase experts and resources at the University of Utah
 University of Utah Media Release
Internationally Recognized Scientific Computing and Imaging (SCI) Institute to Hold Court at Home
SCIx to showcase experts and resources at the University of Utah
October 31, 2011 – People living in the Beehive State might easily pair the words “Utah” and “ski” in a word association game, but not so much for “Utah” and “SCI.” --something organizers of the new open house called SCIx hope to change. SCIx will take place on November 4th. For a list of presentations and full schedule.
SCI Helps New Businesses Develop Software

September 20, 2010 -- University of Utah faculty develop a wealth of software, and they now have a resource that will help them organize, refine and make it more commercially viable. That resource is the Software Development Center, which will open its doors this month in a newly remodeled space in the Technology Commercialization Office located at 615 Arapeen Drive in Research Park. The Software Development Center is a joint effort between the University of Utah's Technology Commercialization Office (TCO), which manages all intellectual property on campus, and the Scientific Computing and Imaging (SCI) Institute.
SCI to Hold Open House During VisWeek
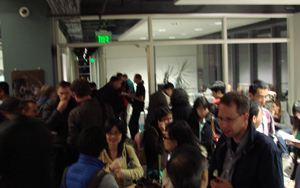 SCI will host an open house for Vis Week conference attendees October 28th from 6:30 pm to 9:00pm. Busses will be available to transport guests from the conference to the SCI Institute. Boarding will begin at 6:15pm and will run continuously with the last bus leaving SCI at about 8:45 or 9:00.
Chuck Hansen features prominently in College research report
 SCI faculty Chuck Hansen's career in visualization is prominently featured in the 2010 College of Engineering Research Report.
 See: Scientific Visualization: Analyzing and Understanding Complex Data (pdf).
Orly Alter Joins the Scientific Computing and Imaging Institute as a USTAR Associate Professor of Bioengineering
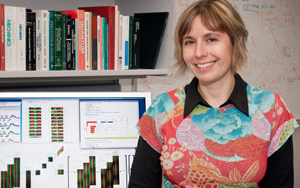 Orly Alter has joined the University of Utah’s Scientific Computing and Imaging (SCI) Institute as a USTAR Associate Professor of Bioengineering. The SCI Institute focuses on solving important problems in biomedicine, science, and engineering using computation and is an international research leader in the areas of scientific computing, visualization, and image analysis.
SCI Starts New Phase in the Warnock Engineering Building
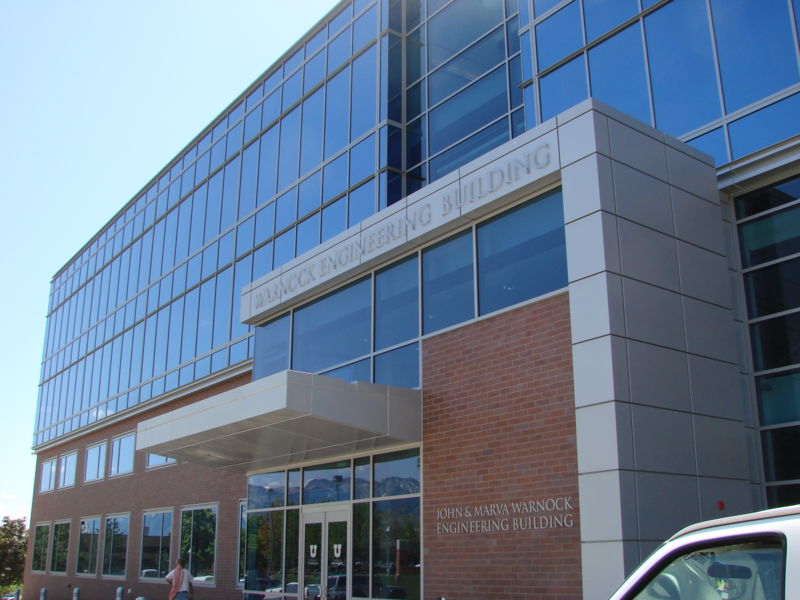 The Scientific Computing and Imaging Institute has begun a new phase of life in the John E. and Marva M. Warnock Engineering Building, a newly constructed, state of the art research facility.
The building is named for two primary donors who helped make it possible. John E. and Marva M. Warnock are both University of Utah alumni and founding pioneers of the information age. John Warnock is a co-founder of Adobe Systems, Inc., an industry leader in the area of graphics, publishing, web, and electronic document technologies. Marva Warnock is a designer and partner with Marsh Design in Palo Alto and also serves on the National Leadership Council for the Utah Museum of Fine Arts at the University of Utah. The project also benefited by a major contribution from Ed Catmull, another University of Utah alumnus who has been a major pioneer in computer technology. Dr. Catmull developed a series of fundamental technologies that made 3D computer graphics possible. He went on to found Pixar Animation Studios and now serves as President of both Pixar and Walt Disney Animation Studios. The Scientific Computing and Imaging Institute is very thankful for the generous contributions by the Warnock family, Ed Catmull and others who made our new home possible.
SCI Welcomes Juliana Freire
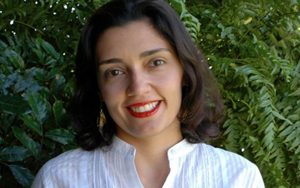 Juliana Freire joins the SCI Institute from the School of Computing at the University of Utah where she is an Associate Professor. Before joining the University of Utah, she was member of the technical staff at the Database Systems Research Department at Bell Laboratories (Lucent Technologies) and an Assistant Professor at OGI/OHSU. An important theme in Professor Freire’s work is the development of data management technology to address new problems introduced by emerging applications, including the Web and scientific applications. Her recent research has focused on two main topics: Provenance management for computational tasks and Web mining. Professor Freire is an active member of the database community, having co-authored over 80 technical papers and holding 4 U.S. patents. She is a recipient of an NSF CAREER and an IBM Faculty award. She has chaired or co-chaired several workshops and conferences, and she has participated as a program committee member in over 50 events. Her research has been funded by grants from the National Science Foundation, Department of Energy, the University of Utah and the State of Utah.
NSF Open Wildland Fire Modeling
 SCI, in collaboration with the National Center for Atmospheric Research (NCAR) and the University of Colorado at Denver have teamed up to tackle the challenges associated with modeling the complexities of wildfires.
www.openwfm.org
The losses associated with wildfires and the wish to understand, predict, and control wildfires have driven researchers to create ever more detailed and powerful computational models. However, the necessary sophistication and realism requires scientific computing and analysis processes of a complexity that has itself become a hindrance to further progress and education. In addition, the research is done by geographically disperse interdisciplinary groups, and making their models interoperate is a challenge. This project strives to overcome this complexity and challenges to collaboration by state-of-the-art software engineering, visualization, and collaboration tools. The results will find applications in wildfire research, education, training, and management.
SCI Research on Display at SLC Library
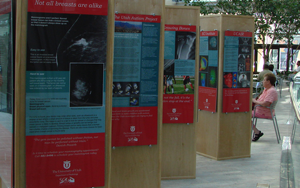 The SCI Institute, in partnership with the Department of Radiology has been working towards new goals in public outreach. A three-part exhibit is now on display at the Salt Lake Public Library and includes hands-on multi-media, Q and A from the University's leading radiologists, a four lecture series, and a 20 piece gallery display which will run through December. Overall, it has been a great success and has opened the public eye to a glimpse of what we are working on.
Greg Jones Named Associate Director of Scientific Computing and Imaging Institute
 The Scientific Computing and Imaging Institute is delighted to welcome Dr. Greg Jones back to the SCI Institute as our Associate Director. Dr. Jones previously served as our Associate Director from 2000 to 2005. He was then called by Governor Jon M. Huntsman to serve as the State Science Adviser to the Governor of Utah and Director of the Utah Economic Clusters Initiative from 2005 to 2007. He was awarded the 2007 Medal for Science and Technology by Utah Governor Jon M. Huntsman for his science leadership to the State of Utah. Most recently, he served as the Executive Director of Research at the Moran Eye Center.
