


SCI Publications
2008


T. Ize, I. Wald, S.G. Parker.
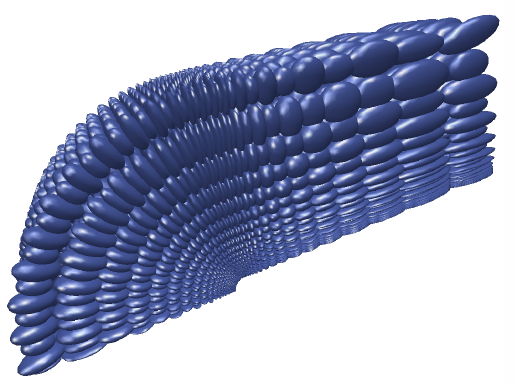
“Ray Tracing with the BSP Tree,” In Proceedings of the IEEE Symposium on Interactive Ray Tracing, 2008, pp. 159--166. 2008.
DOI: 10.1109/RT.2008.4634637
One of the most fundamental concepts in computer graphics is binary space subdivision. In its purest form, this concept leads to binary space partitioning trees (BSP trees) with arbitrarily oriented space partitioning planes. In practice, however, most algorithms use kd-trees-a special case of BSP trees that restrict themselves to axis-aligned planes-since BSP trees are believed to be numerically unstable, costly to traverse, and intractable to build well. In this paper, we show that this is not true. Furthermore, after optimizing our general BSP traversal to also have a fast kd-tree style traversal path for axis-aligned splitting planes, we show it is indeed possible to build a general BSP based ray tracer that is highly competitive with state of the art BVH and kd-tree based systems. We demonstrate our ray tracer on a variety of scenes, and show that it is always competitive with-and often superior to-state of the art BVH and kd-tree based ray tracers.
Keywords: rt, ray tracing, bsp tree
W.-K. Jeong, R.T. Whitaker.
“A Fast Iterative Method for Eikonal Equations,” In SIAM Journal on Scientific Computing, Vol. 30, No. 5, pp. 2512-2534. 2008.
DOI: 10.1137/060670298
C.R. Johnson, X. Tricoche.
“Biomedical Visualization,” In Advances in Biomedical Engineering, Ch. 6, Edited by Pascal Verdonck, Elsvier Science, pp. 209--272. 2008.
M. Jolley, J.G. Stinstra, S. Pieper, R.S. MacLeod, D.H. Brooks, F. Cecchin, J.K. Triedman.
“A Computer Modeling Tool for Comparing Novel ICD Electrode Orientations in Children and Adults,” In Heart Rhythm, Vol. 5, No. 4, pp. 565--572. April, 2008.
PubMed ID: 18362024
E. Jurrus, R.T. Whitaker, B. Jones, R. Marc, T. Tasdizen.
“An Optimal-Path Approach for Neural Circuit Reconstruction,” In Proceedings of the 5th IEEE International Symposium on Biomedical Imaging: From Nano to Macro, pp. 1609--1612. 2008.
PubMed ID: 19172170
R. Kashani, M. Hub, J.M. Balter, M.L. Kessler, L. Dong, L. Zhang, L. Xing, Y. Xie, D. Hawkes, J.A. Schnabel, J. McClelland, S. Joshi, Q. Chen, W. Lu.
“Objective assessment of deformable image registration in radiotherapy: a multi-institution study,” In Medical Physics, Vol. 35, No. 12, pp. 5944--5953. 2008.
PubMed ID: 19175149
A. Kensler, A. Knoll, P. Shirley.
“Better Gradient Noise,” SCI Institute Technical Report, No. UUSCI-2008-001, University of Utah, 2008.
A. Kensler.
“Tree Rotations for Improving Bounding Volume Heirarchies,” In Proceedings of the 2008 IEEE Symposium on Interactive Ray Tracing, pp. 73--76. 2008.
R.M. Kirby, C.T. Silva.
“The Need For Verifiable Visualization,” In IEEE Computer Graphics and Applications, Vol. 28, No. 5, pp. 78--83. 2008.
DOI: 10.1109/MCG.2008.103
Visualization is often employed as part of the simulation science pipeline, it's the window through which scientists examine their data for deriving new science, and the lens used to view modeling and discretization interactions within their simulations. We advocate that as a component of the simulation science pipeline, visualization must be explicitly considered as part of the validation and verification (V&V) process. In this article, the authors define V&V in the context of computational science, discuss the role of V&V in the scientific process, and present arguments for the need for verifiable visualization.
S. Klasky, M. Vouk, M. Parashar, A. Khan, N. Podhorszki, R. Barreto, D. Silver, S.G. Parker.
“Collaborative Visualization Spaces for Petascale Simulations,” In Proceedings of 2008 International Symposium on Collaborative Technologies and Systems (CTS 2008), pp. 203--211. 2008.
DOI: 10.1109/CTS.2008.4543933
R.C. Knickmeyer, S. Gouttard, C. Kang, D. Evans, K. Wilber, K.J. Smith, R.M. Hamer, W. Lin, G. Gerig, J.H. Gilmore.
“A Structural MRI Study of Human Brain Development from Birth to Two Years,” In The Journal of Neuroscience, Vol. 28, No. 47, pp. 12176--12182. Nov, 2008.
PubMed ID: 19020011
D. Koop, C.E. Scheidegger, S.P. Callahan, J. Freire, C.T. Silva.
“VisComplete: Automating Suggestions for Visualization Systems,” In IEEE Transactions on Visualization and Computer Graphics (Proceedings of IEEE Visualization 2008), Vol. 14, No. 6, pp. 1691--1698. 2008.
L. Krishnan, C.J. Underwood, S.A. Maas, B.J. Ellis, T.C. Kode, J.B. Hoying, J.A. Weiss.
“Effect of Mechanical Boundary Conditions on Orientation of Angiogenic Microvessels,” In Cardiovascular Research, Vol. 78, No. 2, pp. 324--332. 2008.
J. Krüger.
“A GPU Framework for Interactive Simulation and Rendering of Fluid Effects,” In IT - Information Technology, Vol. 4, pp. 265--268. 2008.
J. Krüger, K. Potter, R.S. MacLeod, C.R. Johnson.
“Unified Volume Format: A General System For Efficient Handling Of Large Volumetric Datasets,” In Proceedings of IADIS Computer Graphics and Visualization 2008 (CGV 2008), pp. 19--26. 2008.
PubMed ID: 20953270
With the continual increase in computing power, volumetric datasets with sizes ranging from only a few megabytes to petascale are generated thousands of times per day. Such data may come from an ordinary source such as simple everyday medical imaging procedures, while larger datasets may be generated from cluster-based scientific simulations or measurements of large scale experiments. In computer science an incredible amount of work worldwide is put into the efficient visualization of these datasets. As researchers in the field of scientific visualization, we often have to face the task of handling very large data from various sources. This data usually comes in many different data formats. In medical imaging, the DICOM standard is well established, however, most research labs use their own data formats to store and process data. To simplify the task of reading the many different formats used with all of the different visualization programs, we present a system for the efficient handling of many types of large scientific datasets (see Figure 1 for just a few examples). While primarily targeted at structured volumetric data, UVF can store just about any type of structured and unstructured data. The system is composed of a file format specification with a reference implementation of a reader. It is not only a common, easy to implement format but also allows for efficient rendering of most datasets without the need to convert the data in memory.
M. Kubicki, M. Styner, S. Bouix, G. Gerig, D. Markant, K. Smith, R. Kikinis, R.W. McCarley, M.E. Shenton.
“Reduced Interhemispheric Connectivity in Schizophrenia- Tractography Based Segmentation of the Corpus Callosum,” In Schizophrenia Research, Vol. 106, No. 2-3, pp. 125--131. December, 2008.
C. Ledergerber, G. Guennebaud, M.D. Meyer, M. Bacher, H. Pfister.
“Volume MLS Ray Casting,” In IEEE Transactions on Visualization and Computer Graphics (Proceedings of Visualization 2008), Vol. 14, No. 6, pp. 1539--1546. 2008.
S. Lew, C.H. Wolters, A. Anwander, S. Makeig, R.S. Macleod.
“Improved EEG Source Analysis Using Low-Resolution Conductivity Estimation in a Four-Compartment Finite Element Head Model,” In Human Brain Mapping, Vol. 31, December, 2008.
G.-S. Li, X. Tricoche, D. Weiskopf, C.D. Hansen.
“Flow Charts: Visualization of Vector Fields on Arbitrary Surfaces,” In IEEE Transactions on Visualization and Computer Graphics, Vol. 14, No. 5, pp. 1--14. September/October, 2008.
G.-S. Li, X. Tricoche, C.D. Hansen.
“Physically-based Dye Advection for Flow Visualization,” In Computer Graphics Forum, Vol. 27, No. 3, Edited by A. Vilanova and A. Telea and G. Scheuermann and T. Moeller, Wiley-Blackwell, pp. 727--734. May, 2008.
DOI: 10.1111/j.1467-8659.2008.01201.x