


SCI Publications
2012


Q. Meng, A. Humphrey, M. Berzins.
“The Uintah Framework: A Unified Heterogeneous Task Scheduling and Runtime System,” In Digital Proceedings of The International Conference for High Performance Computing, Networking, Storage and Analysis, Note: SC’12 –2nd International Workshop on Domain-Specific Languages and High-Level Frameworks for High Performance Computing, WOLFHPC 2012, pp. 2441--2448. 2012.
DOI: 10.1109/SCC.2012.6674233
The development of a new unified, multi-threaded runtime system for the execution of asynchronous tasks on heterogeneous systems is described in this work. These asynchronous tasks arise from the Uintah framework, which was developed to provide an environment for solving a broad class of fluid-structure interaction problems on structured adaptive grids. Uintah has a clear separation between its MPI-free user-coded tasks and its runtime system that ensures these tasks execute efficiently. This separation also allows for complete isolation of the application developer from the complexities involved with the parallelism Uintah provides. While we have designed scalable runtime systems for large CPU core counts, the emergence of heterogeneous systems, with additional on-node accelerators and co-processors presents additional design challenges in terms of effectively utilizing all computational resources on-node and managing multiple levels of parallelism. Our work addresses these challenges for Uintah by the development of new hybrid runtime system and Unified multi-threaded MPI task scheduler, enabling Uintah to fully exploit current and emerging architectures with support for asynchronous, out-of-order scheduling of both CPU and GPU computational tasks. This design coupled with an approach that uses MPI to communicate between nodes, a shared memory model on-node and the use of novel lock-free data structures, has made it possible for Uintah to achieve excellent scalability for challenging fluid-structure problems using adaptive mesh refinement on as many as 256K cores on the DoE Jaguar XK6 system. This design has also demonstrated an ability to run capability jobs on the heterogeneous systems, Keeneland and TitanDev. In this work, the evolution of Uintah and its runtime system is examined in the context of our new Unified multi-threaded scheduler design. The performance of the Unified scheduler is also tested against previous Uintah scheduler and runtime designs over a range of processor core and GPU counts.
Q. Meng, J. Hall, H. Rutigliano, X. Zhou, B.R. Sessions, R. Stott, K. Panter, C.J. Davies, R. Ranjan, D. Dosdall, R.S. MacLeod, N. Marrouche, K.L. White, Z. Wang, I.A. Polejaeva.
“30 Generation of Cloned Transgenic Goats with Cardiac Specific Overexpression of Transforming Growth Factor β1,” In Reproduction, Fertility and Development, Vol. 25, No. 1, pp. 162--163. 2012.
DOI: 10.1071/RDv25n1Ab30
Transforming growth factor β1 (TGF-β1) has a potent profibrotic function and is central to signaling cascades involved in interstitial fibrosis, which plays a critical role in the pathobiology of cardiomyopathy and contributes to diastolic and systolic dysfunction. In addition, fibrotic remodeling is responsible for generation of re-entry circuits that promote arrhythmias (Bujak and Frangogiannis 2007 Cardiovasc. Res. 74, 184–195). Due to the small size of the heart, functional electrophysiology of transgenic mice is problematic. Large transgenic animal models have the potential to offer insights into conduction heterogeneity associated with fibrosis and the role of fibrosis in cardiovascular diseases. The goal of this study was to generate transgenic goats overexpressing an active form of TGFβ-1 under control of the cardiac-specific α-myosin heavy chain promoter (α-MHC). A pcDNA3.1DV5-MHC-TGF-β1cys33ser vector was constructed by subcloning the MHC-TGF-β1 fragment from the plasmid pUC-BM20-MHC-TGF-β1 (Nakajima et al. 2000 Circ. Res. 86, 571–579) into the pcDNA3.1D V5 vector. The Neon transfection system was used to electroporate primary goat fetal fibroblasts. After G418 selection and PCR screening, transgenic cells were used for SCNT. Oocytes were collected by slicing ovaries from an abattoir and matured in vitro in an incubator with 5\% CO2 in air. Cumulus cells were removed at 21 to 23 h post-maturation. Oocytes were enucleated by aspirating the first polar body and nearby cytoplasm by micromanipulation in Hepes-buffered SOF medium with 10 µg of cytochalasin B mL–1. Transgenic somatic cells were individually inserted into the perivitelline space and fused with enucleated oocytes using double electrical pulses of 1.8 kV cm–1 (40 µs each). Reconstructed embryos were activated by ionomycin (5 min) and DMAP and cycloheximide (CHX) treatments. Cloned embryos were cultured in G1 medium for 12 to 60 h in vitro and then transferred into synchronized recipient females. Pregnancy was examined by ultrasonography on day 30 post-transfer. A total of 246 cloned embryos were transferred into 14 recipients that resulted in production of 7 kids. The pregnancy rate was higher in the group cultured for 12 h compared with those cultured 36 to 60 h [44.4\% (n = 9) v. 20\% (n = 5)]. The kidding rates per embryo transferred of these 2 groups were 3.8\% (n = 156) and 1.1\% (n = 90), respectively. The PCR results confirmed that all the clones were transgenic. Phenotype characterization [e.g. gene expression, electrocardiogram (ECG), and magnetic resonance imaging (MRI)] is underway. We demonstrated successful production of transgenic goat via SCNT. To our knowledge, this is the first transgenic goat model produced for cardiovascular research.
M.D. Meyer, M. Sedlmair, T. Munzner.
“The Four-Level Nested Model Revisited: Blocks and Guidelines,” In Workshop on BEyond time and errors: novel evaLuation methods for Information Visualization (BELIV), IEEE VisWeek 2012, 2012.
P. Muralidharan, P.T. Fletcher.
“Sasaki Metrics for Analysis of Longitudinal Data on Manifolds,” In Proceedings of the 2012 IEEE conference on Computer Vision and Pattern Recognition (CVPR), pp. 1027--1034. 2012.
DOI: 10.1109/CVPR.2012.6247780
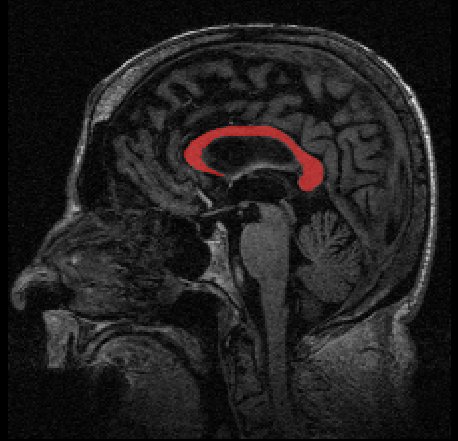
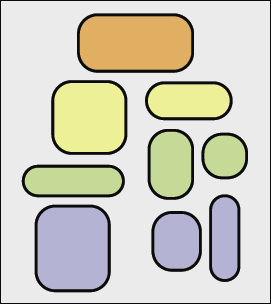
Longitudinal data arises in many applications in which the goal is to understand changes in individual entities over time. In this paper, we present a method for analyzing longitudinal data that take values in a Riemannian manifold. A driving application is to characterize anatomical shape changes and to distinguish between trends in anatomy that are healthy versus those that are due to disease. We present a generative hierarchical model in which each individual is modeled by a geodesic trend, which in turn is considered as a perturbation of the mean geodesic trend for the population. Each geodesic in the model can be uniquely parameterized by a starting point and velocity, i.e., a point in the tangent bundle. Comparison between these parameters is achieved through the Sasaki metric, which provides a natural distance metric on the tangent bundle. We develop a statistical hypothesis test for differences between two groups of longitudinal data by generalizing the Hotelling T2 statistic to manifolds. We demonstrate the ability of these methods to distinguish differences in shape changes in a comparison of longitudinal corpus callosum data in subjects with dementia versus healthily aging controls.
A. Narayan, D. Xiu.
“Stochastic Collocation Methods on Unstructured Grids in High Dimensions via Interpolation,” In SIAM Journal on Scientific Computing, Vol. 34, No. 3, pp. A1729–-A1752. 2012.
DOI: 10.1137/110854059
Keywords: stochastic collocation, polynomial chaos, interpolation, orthogonal polynomials
A. Narayan, Y. Marzouk, D. Xiu.
“Sequential Data Assimilation with Multiple Models,” In Journal of Computational Physics, Vol. 231, No. 19, pp. 6401--6418. 2012.
DOI: 10.1016/j.jcp.2012.06.002
Data assimilation is an essential tool for predicting the behavior of real physical systems given approximate simulation models and limited observations. For many complex systems, there may exist several models, each with different properties and predictive capabilities. It is desirable to incorporate multiple models into the assimilation procedure in order to obtain a more accurate prediction of the physics than any model alone can provide. In this paper, we propose a framework for conducting sequential data assimilation with multiple models and sources of data. The assimilated solution is a linear combination of all model predictions and data. One notable feature is that the combination takes the most general form with matrix weights. By doing so the method can readily utilize different weights in different sections of the solution state vectors, allow the models and data to have different dimensions, and deal with the case of a singular state covariance. We prove that the proposed assimilation method, termed direct assimilation, minimizes a variational functional, a generalized version of the one used in the classical Kalman filter. We also propose an efficient iterative assimilation method that assimilates two models at a time until all models and data are assimilated. The mathematical equivalence of the iterative method and the direct method is established. Numerical examples are presented to demonstrate the effectiveness of the new method.
Keywords: Uncertainty quantification, Data assimilation, Kalman filter, Model averaging
B. Nelson, E. Liu, R.M. Kirby, R. Haimes.
“ElVis: A System for the Accurate and Interactive Visualization of High-Order Finite Element Solutions,” In IEEE Transactions on Visualization and Computer Graphics (TVCG), Vol. 18, No. 12, pp. 2325--2334. Dec, 2012.
DOI: 10.1109/TVCG.2012.218
P.K. Notz, R. Pawlowski, J. Sutherland.
“Graph-Based Software Design for Managing Complexity and Enabling Concurrency in Multiphysics PDE Software,” In ACM Transactions on Mathematical Software, Vol. 39, No. 1, November, 2012.
DOI: 10.1145/2382585.2382586
Multiphysics simulation software is plagued by complexity stemming from nonlinearly coupled systems of Partial Differential Equations (PDEs). Such software typically supports many models, which may require different transport equations, constitutive laws, and equations of state. Strong coupling and a multiplicity of models leads to complex algorithms (i.e., the properly ordered sequence of steps to assemble a discretized set of coupled PDEs) and rigid software.
This work presents a design strategy that shifts focus away from high-level algorithmic concerns to low- level data dependencies. Mathematical expressions are represented as software objects that directly expose data dependencies. The entire system of expressions forms a directed acyclic graph and the high-level as- sembly algorithm is generated automatically through standard graph algorithms. This approach makes problems with complex dependencies entirely tractable, and removes virtually all logic from the algorithm itself. Changes are highly localized, allowing developers to implement models without detailed understand- ing of any algorithms (i.e., the overall assembly process). Furthermore, this approach complements existing MPI-based frameworks and can be implemented within them easily.
Finally, this approach enables algorithmic parallelization via threads. By exposing dependencies in the algorithm explicitly, thread-based parallelism is implemented through algorithm decomposition, providing a basis for exploiting parallelism independent from domain decomposition approaches.
A.R.C. Paiva, T. Tasdizen.
“Fingerprint Image Segmentation using Data Manifold Characteristic Features,” In International Journal of Pattern Recognition and Artificial Intelligence, Vol. 26, No. 4, pp. (23 pages). 2012.
DOI: 10.1142/S0218001412560101

Keywords: Fingerprint segmentation, manifold characterization, feature extraction, dimensionality reduction
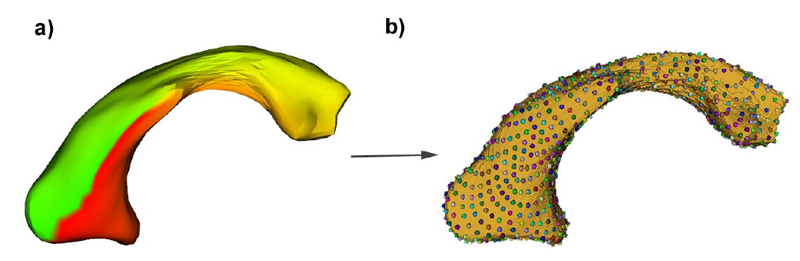
B. Paniagua, L. Bompard, J. Cates, R.T. Whitaker, M. Datar, C. Vachet, M. Styner.
“Combined SPHARM-PDM and entropy-based particle systems shape analysis framework,” In Medical Imaging 2012: Biomedical Applications in Molecular, Structural, and Functional Imaging, SPIE Intl Soc Optical Eng, March, 2012.
DOI: 10.1117/12.911228
PubMed ID: 24027625
PubMed Central ID: PMC3766973
C Partl, A Lex, M Streit, D Kalkofen, K Kashofer, D Schmalstieg.
“enRoute: Dynamic Path Extraction from Biological Pathway Maps for In-Depth Experimental Data Analysis,” In Proceedings of the IEEE Symposium on Biological Data Visualization (BioVis '12), IEEE, pp. 107--114. 2012.
DOI: 10.1109/BioVis.2012.6378600
Pathway maps are an important source of information when analyzing functional implications of experimental data on biological processes. However, associating large quantities of data with nodes on a pathway map and allowing in depth-analysis at the same time is a challenging task. While a wide variety of approaches for doing so exist, they either do not scale beyond a few experiments or fail to represent the pathway appropriately. To remedy this, we introduce enRoute, a new approach for interactively exploring experimental data along paths that are dynamically extracted from pathways. By showing an extracted path side-by-side with experimental data, enRoute can present large amounts of data for every pathway node. It can visualize hundreds of samples, dozens of experimental conditions, and even multiple datasets capturing different aspects of a node at the same time. Another important property of this approach is its conceptual compatibility with arbitrary forms of pathways. Most notably, enRoute works well with pathways that are manually created, as they are available in large, public pathway databases. We demonstrate enRoute with pathways from the well-established KEGG database and expression as well as copy number datasets from humans and mice with more than 1,000 experiments. We validate enRoute using case studies with domain experts, who used enRoute to explore data for glioblastoma multiforme in humans and a model of steatohepatitis in mice.
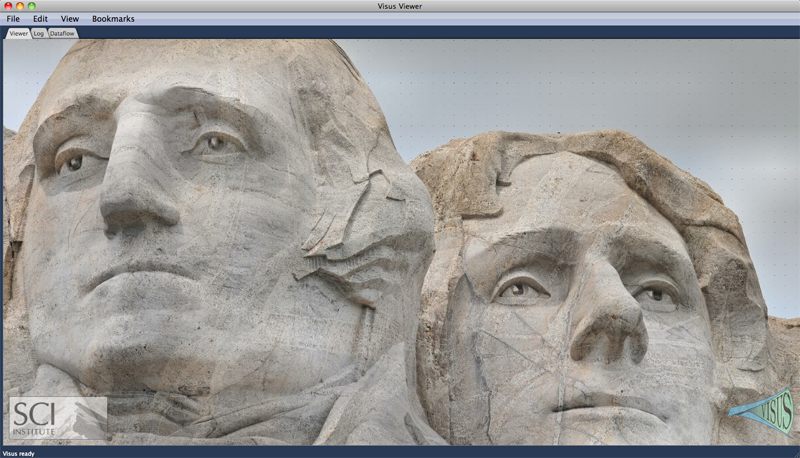
V. Pascucci, G. Scorzelli, B. Summa, P.-T. Bremer, A. Gyulassy, C. Christensen, S. Philip, S. Kumar.
“The ViSUS Visualization Framework,” In High Performance Visualization: Enabling Extreme-Scale Scientific Insight, Chapman and Hall/CRC Computational Science, Ch. 19, Edited by E. Wes Bethel and Hank Childs (LBNL) and Charles Hansen (UofU), Chapman and Hall/CRC, 2012.
Z. Peng, E. Grundy, R.S. Laramee, G. Chen, N. Croft.
“Mesh-Driven Vector Field Clustering and Visualization: An Image-Based Approach,” In IEEE Transactions on Visualization and Computer Graphics, 2011, Vol. 18, No. 2, pp. 283--298. February, 2012.
DOI: 10.1109/TVCG.2011.25
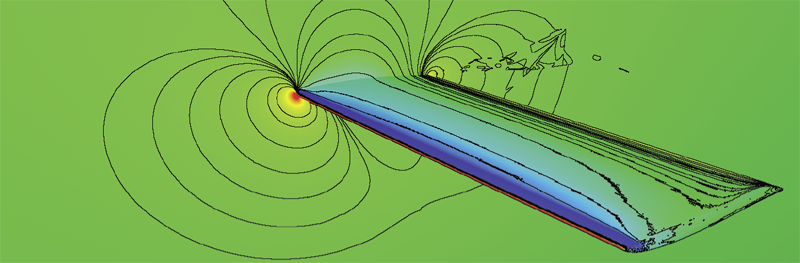
Vector field visualization techniques have evolved very rapidly over the last two decades, however, visualizing vector fields on complex boundary surfaces from computational flow dynamics (CFD) still remains a challenging task. In part, this is due to the large, unstructured, adaptive resolution characteristics of the meshes used in the modeling and simulation process. Out of the wide variety of existing flow field visualization techniques, vector field clustering algorithms offer the advantage of capturing a detailed picture of important areas of the domain while presenting a simplified view of areas of less importance. This paper presents a novel, robust, automatic vector field clustering algorithm that produces intuitive and insightful images of vector fields on large, unstructured, adaptive resolution boundary meshes from CFD. Our bottom-up, hierarchical approach is the first to combine the properties of the underlying vector field and mesh into a unified error-driven representation. The motivation behind the approach is the fact that CFD engineers may increase the resolution of model meshes according to importance. The algorithm has several advantages. Clusters are generated automatically, no surface parameterization is required, and large meshes are processed efficiently. The most suggestive and important information contained in the meshes and vector fields is preserved while less important areas are simplified in the visualization. Users can interactively control the level of detail by adjusting a range of clustering distance measure parameters. We describe two data structures to accelerate the clustering process. We also introduce novel visualizations of clusters inspired by statistical methods. We apply our method to a series of synthetic and complex, real-world CFD meshes to demonstrate the clustering algorithm results.
Keywords: Vector Field Visualization, Clustering, Feature-based, Surfaces
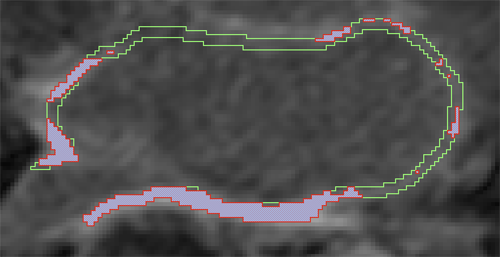
D. Perry, A. Morris, N. Burgon, C. McGann, R.S. MacLeod, J. Cates.
“Automatic classification of scar tissue in late gadolinium enhancement cardiac MRI for the assessment of left-atrial wall injury after radiofrequency ablation,” In SPIE Proceedings, Vol. 8315, pp. (published online). 2012.
DOI: 10.1117/12.910833
PubMed ID: 24236224
PubMed Central ID: PMC3824273
J.R. Peterson, J.C. Beckvermit, T. Harman, M. Berzins, C.A. Wight.
“Multiscale Modeling of High Explosives for Transportation Accidents,” In Proceedings of the 1st Conference of the Extreme Science and Engineering Discovery Environment: Bridging from the eXtreme to the campus and beyond, 2012.
DOI: 10.1145/2335755.2335828
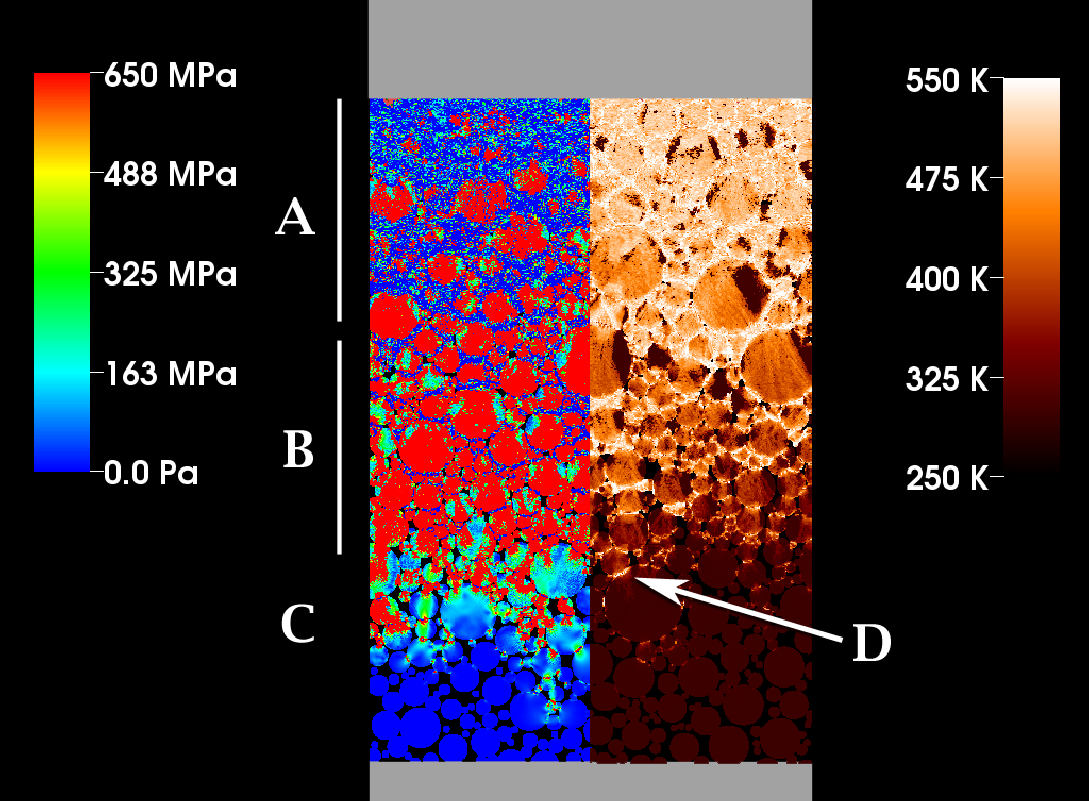
J. Peterson, C. Wight.
“An Eulerian-Lagrangian Computational Model for Deagration and Detonation of High Explosives,” In Combustion and Flame, Vol. 159, No. 7, pp. 2491--2499. 2012.
DOI: 10.1016/j.combustflame.2012.02.006
A solid phase explosives deflagration and detonation model capable of surface burning, convective bulk burning and detonation is formulated in the context of Eulerian–Lagrangian material mechanics. Well-validated combustion and detonation models, WSB and JWL++, are combined with two simple, experimentally indicated transition thresholds partitioning the three reaction regimes. Standard experiments are simulated, including the Aluminum Flyer Plate test, the Cylinder test, the rate stick test and the Steven test in order to validate the model. Cell and particle resolution dependence of simulation metrics are presented and global uncertainties assigned. Error quantification comparisons with experiments led to values generally below 7% (1σ). Finally, gas flow through porous media is implicated as the driving force behind the deflagration to detonation transition.
S.P. Ponnapalli, M.A. Saunders, C.F. Van Loan, O. Alter.
“A Higher-Order Generalized Singular Value Decomposition for Comparison of Global mRNA Expression from Multiple Organisms,” In PLoS One, Vol. 6, No. 12, pp. e28072. 2012.
DOI: 10.1371/journal.pone.0028072
K. Potter, R.M. Kirby, D. Xiu, C.R. Johnson.
“Interactive visualization of probability and cumulative density functions,” In International Journal of Uncertainty Quantification, Vol. 2, No. 4, pp. 397--412. 2012.
DOI: 10.1615/Int.J.UncertaintyQuantification.2012004074
PubMed ID: 23543120
PubMed Central ID: PMC3609671
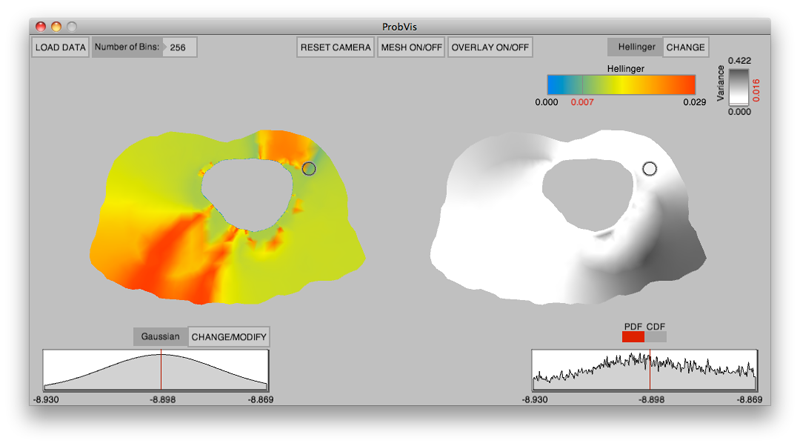
Keywords: visualization, probability density function, cumulative density function, generalized polynomial chaos, stochastic Galerkin methods, stochastic collocation methods
K. Potter, P. Rosen, C.R. Johnson.
“From Quantification to Visualization: A Taxonomy of Uncertainty Visualization Approaches,” In Uncertainty Quantification in Scientific Computing, IFIP Advances in Information and Communication Technology Series, Vol. 377, Edited by Andrew Dienstfrey and Ronald Boisvert, Springer, pp. 226--249. 2012.
DOI: 10.1007/978-3-642-32677-6_15
Keywords: scidac, netl, uncertainty visualization
M.W. Prastawa, S.P. Awate, G. Gerig.
“Building Spatiotemporal Anatomical Models using Joint 4-D Segmentation, Registration, and Subject-Speci fic Atlas Estimation,” In Proceedings of the 2012 IEEE Mathematical Methods in Biomedical Image Analysis (MMBIA) Conference, pp. 49--56. 2012.
DOI: 10.1109/MMBIA.2012.6164740
PubMed ID: 23568185
PubMed Central ID: PMC3615562
Keywords: namic, adni, autism