SCI Publications
2013


K. Higuchi, M. Akkaya, M. Koopmann, J.J. Blauer, N.S. Burgon, K. Damal, R. Ranjan, E. Kholmovski, R.S. Macleod, N.F. Marrouche..
“The Effect of Fat Pad Modification during Ablation of Atrial Fibrillation: Late Gadolinium Enhancement MRI Analysis,” In Pacing and Clinical Electrophysiology (PACE), Vol. 36, No. 4, pp. 467--476. April, 2013.
DOI: 10.1111/pace.12084
PubMed ID: 23356963
PubMed Central ID: PMC3651513
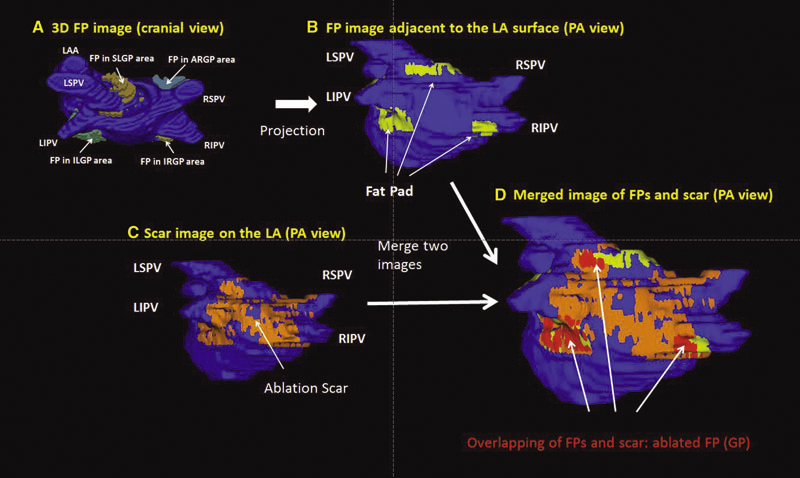
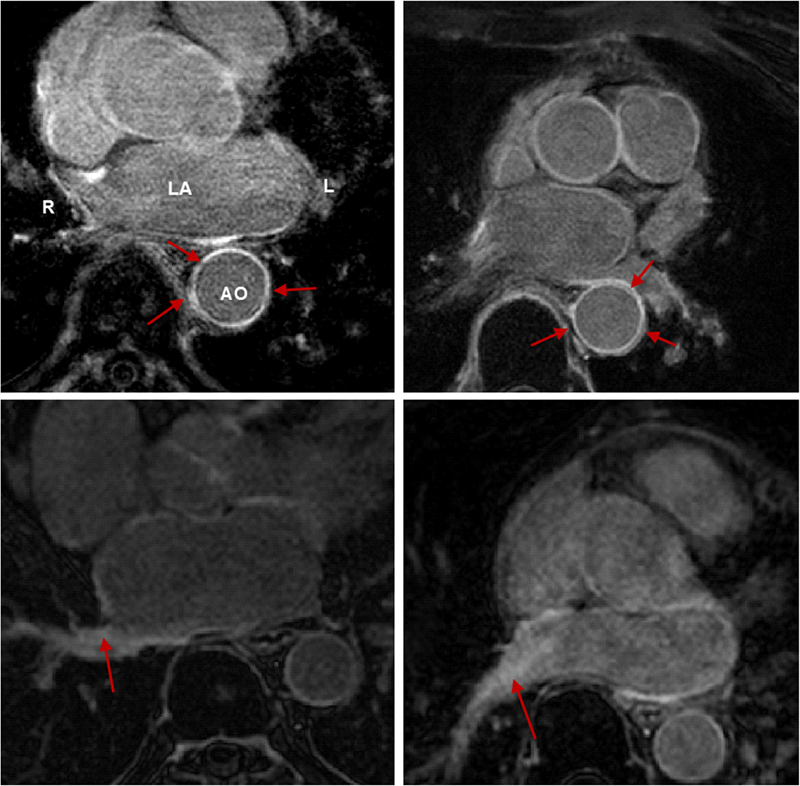
Background: Magnetic resonance imaging (MRI) can visualize locations of both the ablation scar on the left atrium (LA) after atrial fibrillation (AF) ablation and epicardial fat pads (FPs) containing ganglionated plexi (GP).
Methods: We investigated 60 patients who underwent pulmonary vein antrum (PVA) isolation along with LA posterior wall and septal debulking for AF. FPs around the LA surface in well-known GP areas (which were considered as the substitution of GP areas around the LA) were segmented from the dark-blood MRI. Then the FP and the ablation scar image visualized by late gadolinium enhancement (LGE)-MRI on the LA were merged together. Overlapping areas of FP and the ablation scar image were considered as the ablated FP areas containing GP. Patients underwent 24-hour Holter monitoring after ablation for the analysis of heart rate variability.
Results: Ablated FP area was significantly wider in patients without AF recurrence than those in patients with recurrence (5.6 ± 3.1 cm2 vs 4.2 ± 2.7 cm2 ,P = 0.03). The mean values of both percentage of differences greater than 50 ms in the RR intervals (pRR > 50) and standard deviation of RR intervals over the entire analyzed period (SDNN), which were obtained from 24-hour Holter monitoring 1-day post-AF ablation, were significantly lower in patients without recurrence than those in patients with recurrence (5.8 ± 6.0% vs 14.0 ± 10.1%; P = 0.0005, 78.7 ± 32.4 ms vs 109.2 ± 43.5 ms; P = 0.005). There was a significant negative correlation between SDNN and the percentage of ablated FP area (Y =- 1.3168X + 118.96, R2 = 0.1576, P = 0.003).
Conclusion: Extensively ablating LA covering GP areas along with PVA isolation enhanced the denervation of autonomic nerve system and seemed to improve procedural outcome in patients with AF.
Keywords: ganglionated plexi, fat pad, atrial fibrillation, catheter ablation, LGE-MRI
J. Hinkle, S. Joshi.
“PDiff: Irrotational Diffeomorphisms for Computational Anatomy,” In Proceedings of the International Conference on Information Processing in Medical Imaging (IPMI), Lecture Notes in Computer Science (LNCS), pp. (accepted). 2013.
T. Höllt, A. Magdy, G. Chen, G. Gopalakrishnan, I. Hoteit, C.D. Hansen, M. Hadwiger.
“Visual Analysis of Uncertainties in Ocean Forecasts for Planning and Operation of Off-Shore Structures,” In Proceedings of 2013 IEEE Pacific Visualization Symposium (PacificVis), Note: Received Honerable Mention, pp. 185--192. 2013.
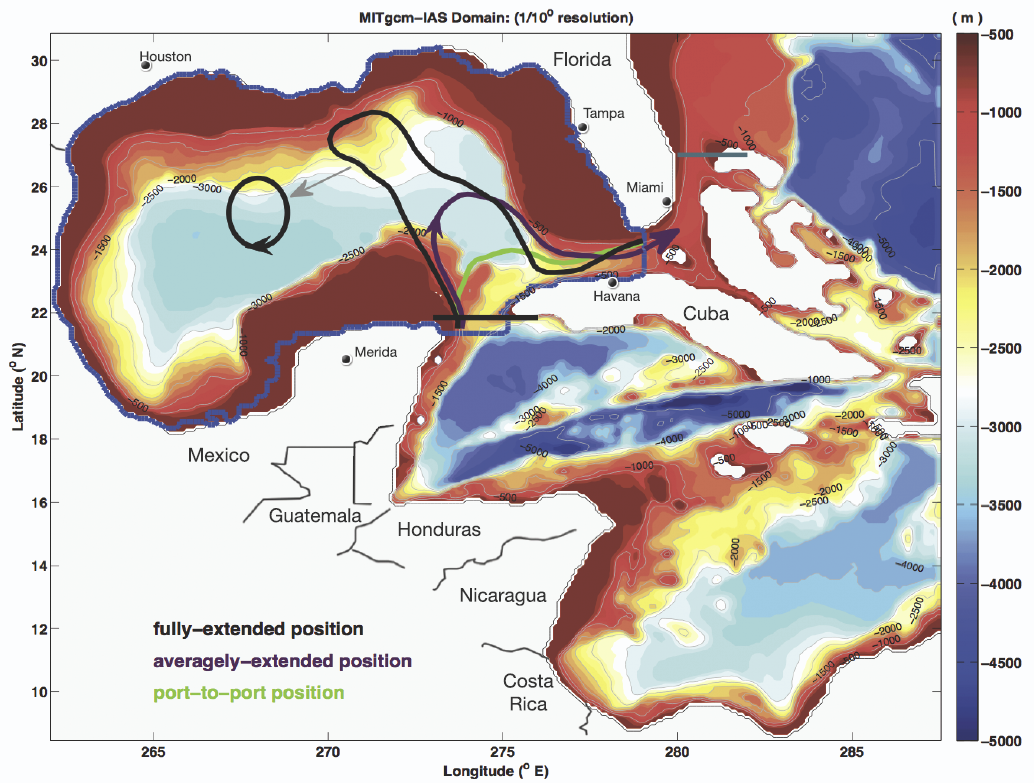
Keywords: Uncertainty, Ensemble Simulation, Risk Estimate
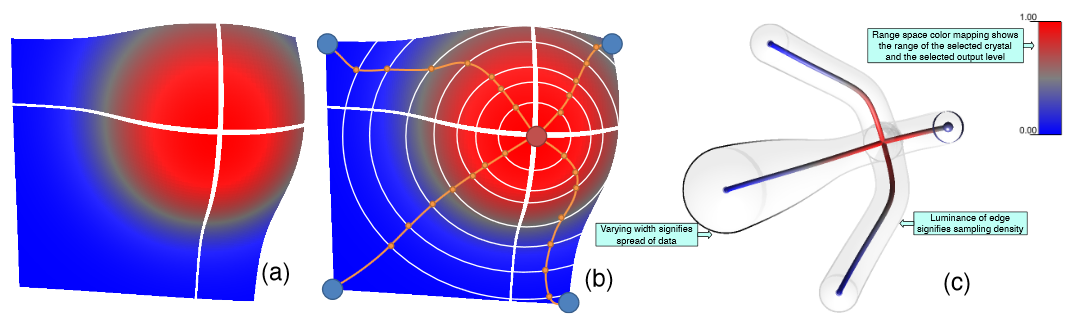
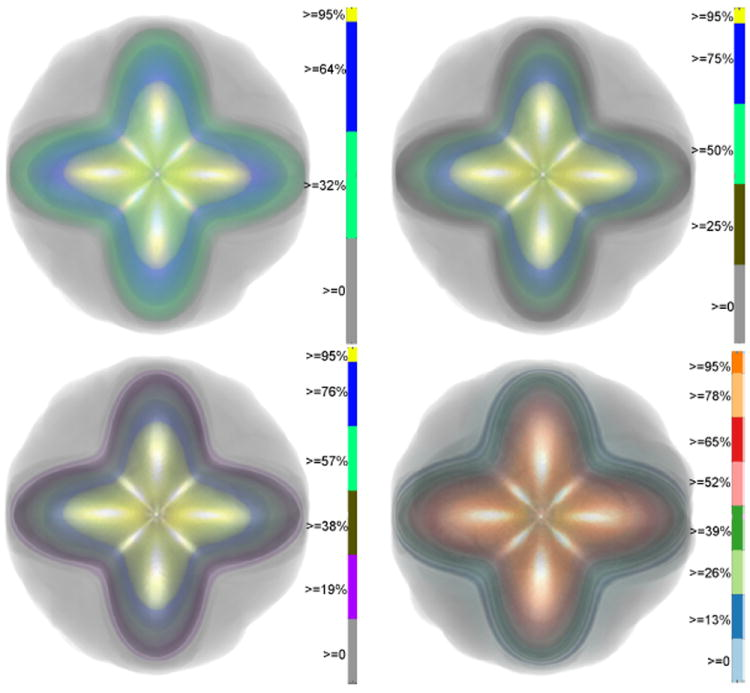
F. Jiao, J.M. Phillips, Y. Gur, C.R. Johnson.
“Uncertainty Visualization in HARDI based on Ensembles of ODFs,” In Proceedings of 2013 IEEE Pacific Visualization Symposium, pp. 193--200. 2013.
PubMed ID: 24466504
PubMed Central ID: PMC3898522
C.R. Johnson, A. Pang (Eds.).
“International Journal for Uncertainty Quantification,” Subtitled “Special Issue on Working with Uncertainty: Representation, Quantification, Propagation, Visualization, and Communication of Uncertainty,” In Int. J. Uncertainty Quantification, Vol. 3, No. 2, Begell House, Inc., pp. vii--viii. 2013.
ISSN: 2152-5080
DOI: 10.1615/Int.J.UncertaintyQuantification.v3.i2
C.R. Johnson, A. Pang (Eds.).
“International Journal for Uncertainty Quantification,” Subtitled “Special Issue on Working with Uncertainty: Representation, Quantification, Propagation, Visualization, and Communication of Uncertainty,” In Int. J. Uncertainty Quantification, Vol. 3, No. 3, Begell House, Inc., 2013.
ISSN: 2152-5080
DOI: 10.1615/Int.J.UncertaintyQuantification.v3.i3
C. Jones, T. Liu, M. Ellisman, T. Tasdizen.
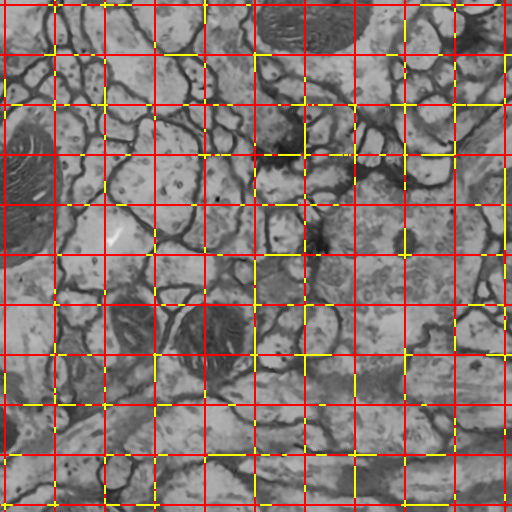
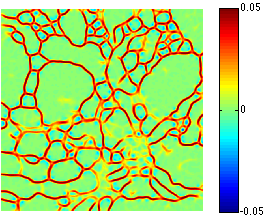
“Semi-Automatic Neuron Segmentation in Electron Microscopy Images Via Sparse Labeling,” In Proceedings of the 2013 IEEE 10th International Symposium on Biomedical Imaging (ISBI), pp. 1304--1307. April, 2013.
DOI: 10.1109/ISBI.2013.6556771
C. Jones, M. Seyedhosseini, M. Ellisman, T. Tasdizen.
“Neuron Segmentation in Electron Microscopy Images Using Partial Differential Equations,” In Proceedings of 2013 IEEE 10th International Symposium on Biomedical Imaging (ISBI), pp. 1457--1460. April, 2013.
DOI: 10.1109/ISBI.2013.6556809
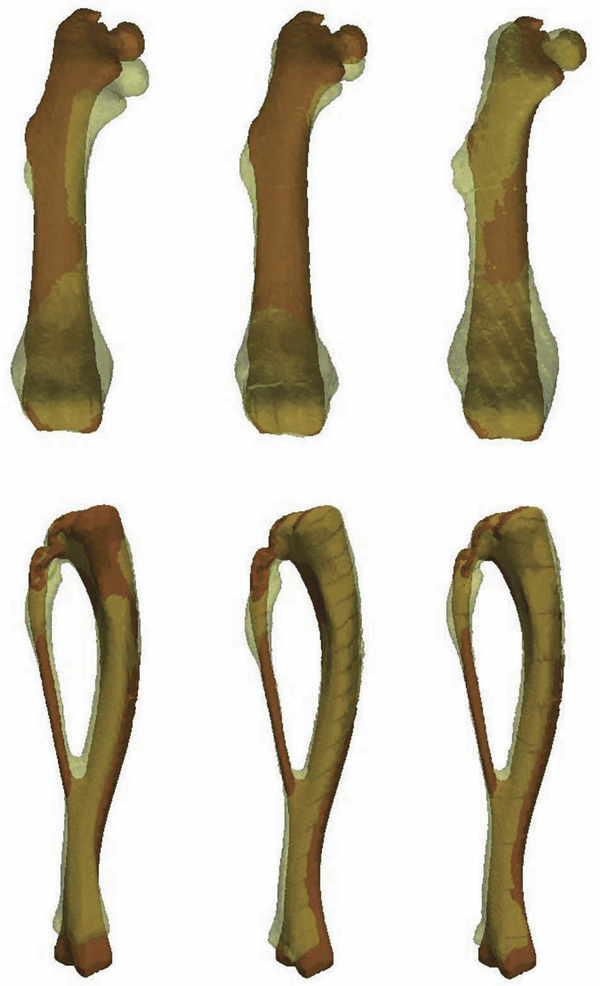
K.B. Jones, M. Datar, S. Ravichandran, H. Jin, E. Jurrus, R.T. Whitaker, M.R. Capecchi.
“Toward an Understanding of the Short Bone Phenotype Associated with Multiple Osteochondromas,” In Journal of Orthopaedic Research, Vol. 31, No. 4, pp. 651--657. 2013.
DOI: 10.1002/jor.22280
PubMed ID: 23192691
PubMed Central ID: PMC3683979
R. Karim, R.J. Housden, M. Balasubramaniam, Z. Chen, D. Perry, A. Uddin, Y. Al-Beyatti, E. Palkhi, P. Acheampong, S. Obom, A. Hennemuth, Y. Lu, W. Bai, W. Shi, Y. Gao, H.-O. Peitgen, P. Radau, R. Razavi, A. Tannenbaum, D. Rueckert, J. Cates, T. Schaeffter, D. Peters, R.S. MacLeod, K. Rhode.
“Evaluation of Current Algorithms for Segmentation of Scar Tissue from Late Gadolinium Enhancement Cardiovascular Magnetic Resonance of the Left Atrium: An Open-Access Grand Challenge,” In Journal of Cardiovascular Magnetic Resonance, Vol. 15, No. 105, 2013.
DOI: 10.1186/1532-429X-15-105
Background: Late Gadolinium enhancement (LGE) cardiovascular magnetic resonance (CMR) imaging can be used to visualise regions of fibrosis and scarring in the left atrium (LA) myocardium. This can be important for treatment stratification of patients with atrial fibrillation (AF) and for assessment of treatment after radio frequency catheter ablation (RFCA). In this paper we present a standardised evaluation benchmarking framework for algorithms segmenting fibrosis and scar from LGE CMR images. The algorithms reported are the response to an open challenge that was put to the medical imaging community through an ISBI (IEEE International Symposium on Biomedical Imaging) workshop.
Methods: The image database consisted of 60 multicenter, multivendor LGE CMR image datasets from patients with AF, with 30 images taken before and 30 after RFCA for the treatment of AF. A reference standard for scar and fibrosis was established by merging manual segmentations from three observers. Furthermore, scar was also quantified using 2, 3 and 4 standard deviations (SD) and full-width-at-half-maximum (FWHM) methods. Seven institutions responded to the challenge: Imperial College (IC), Mevis Fraunhofer (MV), Sunnybrook Health Sciences (SY), Harvard/Boston University (HB), Yale School of Medicine (YL), King’s College London (KCL) and Utah CARMA (UTA, UTB). There were 8 different algorithms evaluated in this study.
Results: Some algorithms were able to perform significantly better than SD and FWHM methods in both pre- and post-ablation imaging. Segmentation in pre-ablation images was challenging and good correlation with the reference standard was found in post-ablation images. Overlap scores (out of 100) with the reference standard were as follows: Pre: IC = 37, MV = 22, SY = 17, YL = 48, KCL = 30, UTA = 42, UTB = 45; Post: IC = 76, MV = 85, SY = 73, HB = 76, YL = 84, KCL = 78, UTA = 78, UTB = 72.
Conclusions: The study concludes that currently no algorithm is deemed clearly better than others. There is scope for further algorithmic developments in LA fibrosis and scar quantification from LGE CMR images. Benchmarking of future scar segmentation algorithms is thus important. The proposed benchmarking framework is made available as open-source and new participants can evaluate their algorithms via a web-based interface.
Keywords: Late gadolinium enhancement, Cardiovascular magnetic resonance, Atrial fibrillation, Segmentation, Algorithm benchmarking
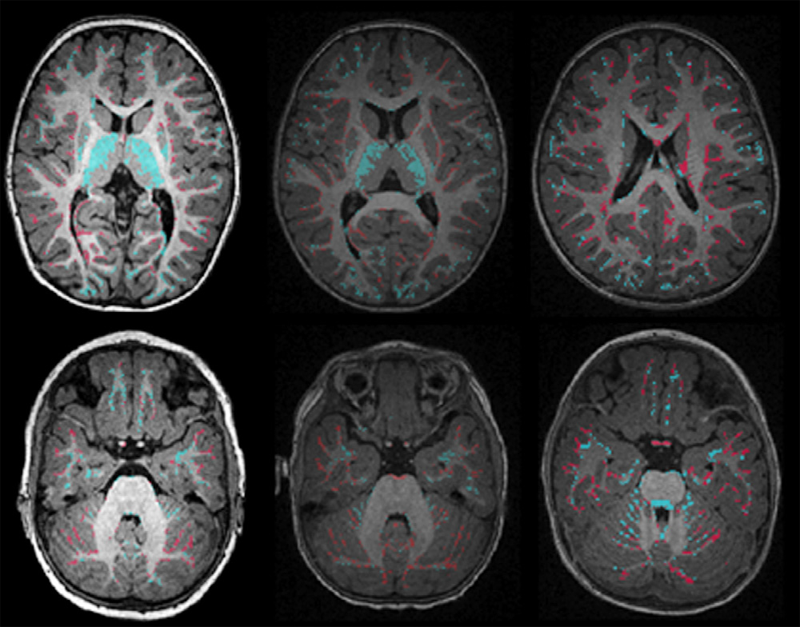
S.H. Kim, V. Fonov, C. Dietrich, C. Vachet, H.C. Hazlett, R.G. Smith, M. Graves, J. Piven, J.H. Gilmore, D.L. Collins, G. Gerig, M. Styner, The IBIS network.
“Adaptive prior probability and spatial temporal intensity change estimation for segmentation of the one-year-old human brain,” In Journal of Neuroscience Methods, Vol. 212, No. 1, Note: Published online Sept. 29, pp. 43--55. January, 2013.
DOI: 10.1016/j.jneumeth.2012.09.01
PubMed Central ID: PMC3513941
R.M. Kirby, M.D. Meyer.
“Visualization Collaborations: What Works and Why,” In IEEE Computer Graphics and Applications: Visualization Viewpoints, Vol. 33, No. 6, pp. 82--88. 2013.
Of particular interest to us is their vision for collaboration. McCormick and his colleagues envisioned an interdisciplinary team that through close interaction would develop visualization tools that not only were effective in the context of their immediate collaborative environment but also could be reused by scientists and engineers in other fields. McCormick and his colleagues categorized the types of researchers they imagined constituting these teams, one type being the "visualization scientist/engineer." They even commented on the skills these individuals might have. However, they provided little guidance on how to make such teams successful.
In the more than 25 years since the report, researchers have refined the concepts of interaction versus collaboration,3 interdisciplinary versus multidisciplinary teams,4,5 and independence versus interdependence.6 Here, we use observations from our collective 18 years of collaborative visualization research to help shed light on not just the composition of current and future visualization collaborative teams but also pitfalls and recommendations for successful collaboration. Although our statements might reflect what seasoned visualization researchers are already doing, we believe that reexpressing and possibly reaffirming basic collaboration principles provide benefits.
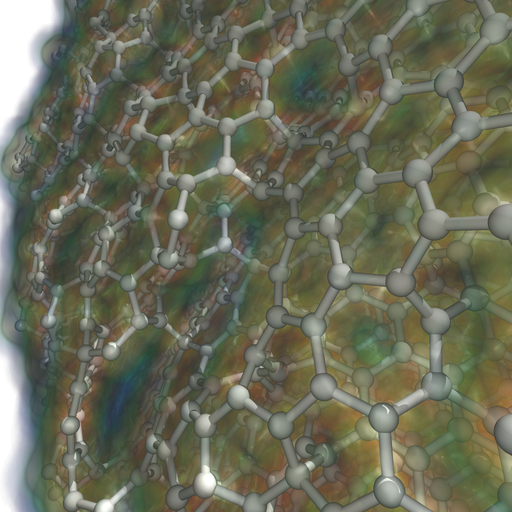
A. Knoll, I. Wald, P. Navratil, M. E Papka,, K. P Gaither.
“Ray Tracing and Volume Rendering Large Molecular Data on Multi-core and Many-core Architectures.,” In Proc. 8th International Workshop on Ultrascale Visualization at SC13 (Ultravis), 2013, 2013.
S. Kumar, A. Saha, V. Vishwanath, P. Carns, J.A. Schmidt, G. Scorzelli, H. Kolla, R. Grout, R. Latham, R. Ross, M.E. Papka, J. Chen, V. Pascucci.
“Characterization and modeling of PIDX parallel I/O for performance optimization,” In Proceedings of SC13: International Conference for High Performance Computing, Networking, Storage and Analysis, pp. 67. 2013.
Parallel I/O library performance can vary greatly in response to user-tunable parameter values such as aggregator count, file count, and aggregation strategy. Unfortunately, manual selection of these values is time consuming and dependent on characteristics of the target machine, the underlying file system, and the dataset itself. Some characteristics, such as the amount of memory per core, can also impose hard constraints on the range of viable parameter values. In this work we address these problems by using machine learning techniques to model the performance of the PIDX parallel I/O library and select appropriate tunable parameter values. We characterize both the network and I/O phases of PIDX on a Cray XE6 as well as an IBM Blue Gene/P system. We use the results of this study to develop a machine learning model for parameter space exploration and performance prediction.
Keywords: I/O, Network Characterization, Performance Modeling
A. Lex, C. Partl, D. Kalkofen, M. Streit, A. Wasserman, S. Gratzl, D. Schmalstieg, H. Pfister.
“Entourage: Visualizing Relationships between Biological Pathways using Contextual Subsets,” In IEEE Transactions on Visualization and Computer Graphics (InfoVis '13), Vol. 19, No. 12, pp. 2536--2545. 2013.
ISSN: 1077-2626
DOI: 10.1109/TVCG.2013.154
Biological pathway maps are highly relevant tools for many tasks in molecular biology. They reduce the complexity of the overall biological network by partitioning it into smaller manageable parts. While this reduction of complexity is their biggest strength, it is, at the same time, their biggest weakness. By removing what is deemed not important for the primary function of the pathway, biologists lose the ability to follow and understand cross-talks between pathways. Considering these cross-talks is, however, critical in many analysis scenarios, such as, judging effects of drugs.
In this paper we introduce Entourage, a novel visualization technique that provides contextual information lost due to the artificial partitioning of the biological network, but at the same time limits the presented information to what is relevant to the analyst's task. We use one pathway map as the focus of an analysis and allow a larger set of contextual pathways. For these context pathways we only show the contextual subsets, i.e., the parts of the graph that are relevant to a selection. Entourage suggests related pathways based on similarities and highlights parts of a pathway that are interesting in terms of mapped experimental data. We visualize interdependencies between pathways using stubs of visual links, which we found effective yet not obtrusive. By combining this approach with visualization of experimental data, we can provide domain experts with a highly valuable tool.
We demonstrate the utility of Entourage with case studies conducted with a biochemist who researches the effects of drugs on pathways. We show that the technique is well suited to investigate interdependencies between pathways and to analyze, understand, and predict the effect that drugs have on different cell types.
T. Liu, M. Seyedhosseini, M. Ellisman, T. Tasdizen.
“Watershed Merge Forest Classification for Electron Microscopy Image Stack Segmentation,” In Proceedings of the 2013 International Conference on Image Processing, 2013.
Automated electron microscopy (EM) image analysis techniques can be tremendously helpful for connectomics research. In this paper, we extend our previous work [1] and propose a fully automatic method to utilize inter-section information for intra-section neuron segmentation of EM image stacks. A watershed merge forest is built via the watershed transform with each tree representing the region merging hierarchy of one 2D section in the stack. A section classifier is learned to identify the most likely region correspondence between adjacent sections. The inter-section information from such correspondence is incorporated to update the potentials of tree nodes. We resolve the merge forest using these potentials together with consistency constraints to acquire the final segmentation of the whole stack. We demonstrate that our method leads to notable segmentation accuracy improvement by experimenting with two types of EM image data sets.
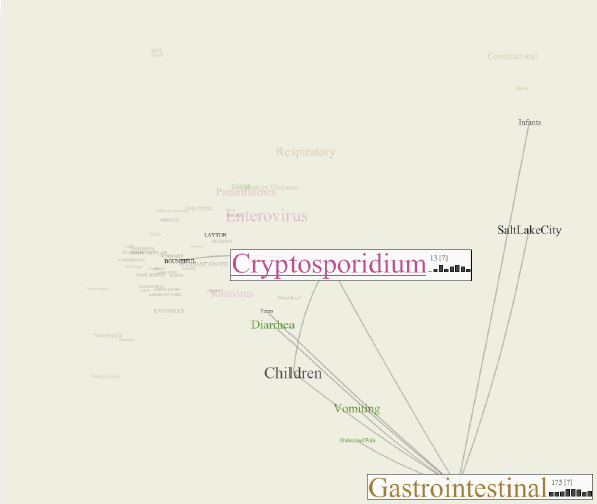
Y. Livnat, E. Jurrus, A.V. Gundlapalli, P. Gestland.
“The CommonGround visual paradigm for biosurveillance,” In Proceedings of the 2013 IEEE International Conference on Intelligence and Security Informatics (ISI), pp. 352--357. 2013.
ISBN: 978-1-4673-6214-6
DOI: 10.1109/ISI.2013.6578857
Keywords: biosurveillance, visualization, interactive exploration, situational awareness
D. Maljovec, Bei Wang, V. Pascucci, P.-T. Bremer, M.Pernice, D. Mandelli, R. Nourgaliev.
“Exploration of High-Dimensional Scalar Function for Nuclear Reactor Safety Analysis and Visualization,” In Proceedings of the 2013 International Conference on Mathematics and Computational Methods Applied to Nuclear Science & Engineering (M&C), pp. 712-723. 2013.

Keywords: high-dimensional data analysis, computational topology, nuclear reactor safety analysis, visualization
D. Maljovec, Bei Wang, D. Mandelli, P.-T. Bremer, V. Pascucci.
“Adaptive Sampling Algorithms for Probabilistic Risk Assessment of Nuclear Simulations,” In Proceedings of the 2013 International Topical Meeting on Probabilistic Safety Assessment and Analysis (PSA 2013), Note: First runner-up for Best Student Paper Award, 2013.
Nuclear simulations are often computationally expensive, time-consuming, and high-dimensional with respect to the number of input parameters. Thus exploring the space of all possible simulation outcomes is infeasible using finite computing resources. During simulation-based probabilistic risk analysis, it is important to discover the relationship between a potentially large number of input parameters and the output of a simulation using as few simulation trials as possible. This is a typical context for performing adaptive sampling where a few observations are obtained from the simulation, a surrogate model is built to represent the simulation space, and new samples are selected based on the model constructed. The surrogate model is then updated based on the simulation results of the sampled points. In this way, we attempt to gain the most information possible with a small number of carefully selected sampled points, limiting the number of expensive trials needed to understand features of the simulation space.
We analyze the specific use case of identifying the limit surface, i.e., the boundaries in the simulation space between system failure and system success. In this study, we explore several techniques for adaptively sampling the parameter space in order to reconstruct the limit surface. We focus on several adaptive sampling schemes. First, we seek to learn a global model of the entire simulation space using prediction models or neighborhood graphs and extract the limit surface as an iso-surface of the global model. Second, we estimate the limit surface by sampling in the neighborhood of the current estimate based on topological segmentations obtained locally.
Our techniques draw inspirations from topological structure known as the Morse-Smale complex. We highlight the advantages and disadvantages of using a global prediction model versus local topological view of the simulation space, comparing several different strategies for adaptive sampling in both contexts. One of the most interesting models we propose attempt to marry the two by obtaining a coarse global representation using prediction models, and a detailed local representation based on topology. Our methods are validated on several analytical test functions as well as a small nuclear simulation dataset modeled after a simplified Pressurized Water Reactor.
Keywords: high-dimensional data analysis, computational topology, nuclear reactor safety analysis, visualization
D. Maljovec, Bei Wang, D. Mandelli, P.-T. Bremer, V. Pascucci.
“Analyze Dynamic Probabilistic Risk Assessment Data through Clustering,” In Proceedings of the 2013 International Topical Meeting on Probabilistic Safety Assessment and Analysis (PSA 2013), 2013.