


SCI Publications
2013


G.H. Weber, K. Beketayev, P.-T. Bremer, B. Hamann, M. Haranczyk, M. Hlawitschka, V. Pascucci.
“Comprehensible Presentation of Topological Information,” No. LBNL-5693E, Lawrence Berkeley National Laboratory, 2013.
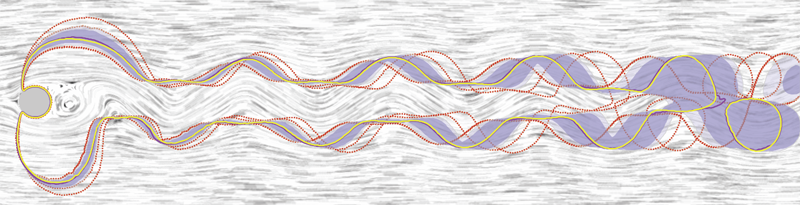
R.T. Whitaker, M. Mirzargar, R.M. Kirby.
“Contour Boxplots: A Method for Characterizing Uncertainty in Feature Sets from Simulation Ensembles,” In IEEE Transactions on Visualization and Computer Graphics, Vol. 19, No. 12, pp. 2713--2722. December, 2013.
DOI: 10.1109/TVCG.2013.143
PubMed ID: 24051838
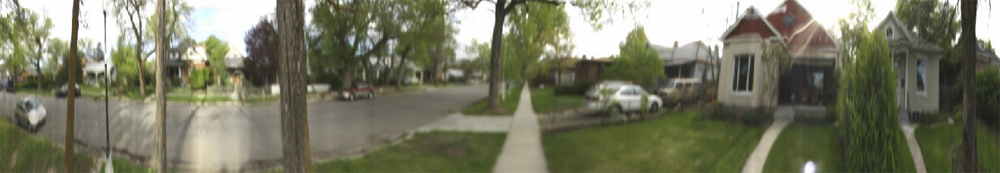
W. Widanagamaachchi, P. Rosen, V. Pascucci.
“A Flexible Framework for Fusing Image Collections into Panoramas,” In Proceedings of the 2013 SIBGRAPI Conference on Graphics, Patterns, and Images, Note: Awarded Best Paper., pp. 195-202. 2013.
DOI: 10.1109/SIBGRAPI.2013.35
E. Wong, S.P. Awate, P.T. Fletcher.
“Adaptive Sparsity in Gaussian Graphical Models,” In Proceedings of the 30th International Conference on Machine Learning (ICML), pp. (accepted). 2013.
An effective approach to structure learning and parameter estimation for Gaussian graphical models is to impose a sparsity prior, such as a Laplace prior, on the entries of the precision matrix. Such an approach involves a hyperparameter that must be tuned to control the amount of sparsity. In this paper, we introduce a parameter-free method for estimating a precision matrix with sparsity that adapts to the data automatically. We achieve this by formulating a hierarchical Bayesian model of the precision matrix with a noninformative Jeffreys' hyperprior. We also naturally enforce the symmetry and positivede definiteness constraints on the precision matrix by parameterizing it with the Cholesky decomposition. Experiments on simulated and real (cell signaling) data demonstrate that the proposed approach not only automatically adapts the sparsity of the model, but it also results in improved estimates of the precision matrix compared to the Laplace prior model with sparsity parameter chosen by cross-validation.
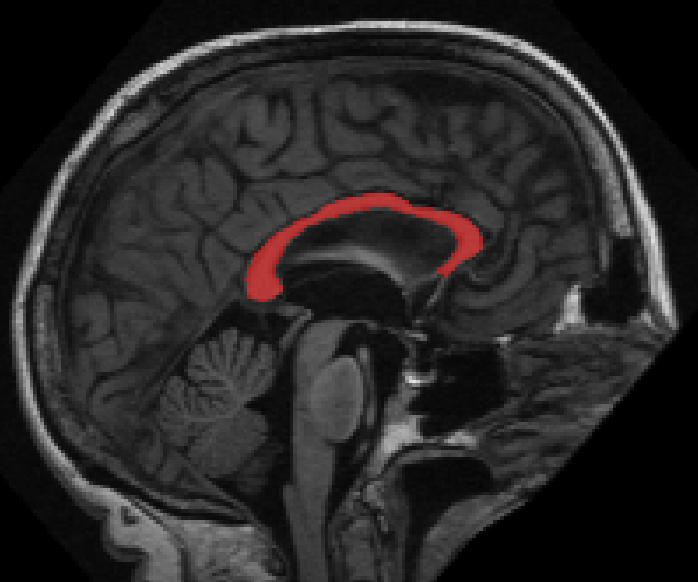
M. Zhang, N.P. Singh, P.T. Fletcher.
“Bayesian Estimation of Regularization and Atlas Building in Diffeomorphic Image Registration,” In Proceedings of the International Conference on Information Processing in Medical Imaging (IPMI), Lecture Notes in Computer Science (LNCS), pp. (accepted). 2013.
M. Zhang, P.T. Fletcher.
“Probabilistic Principal Geodesic Analysis,” In Proceedings of the 2013 Conference on Neural Information Processing Systems (NIPS), pp. (accepted). 2013.
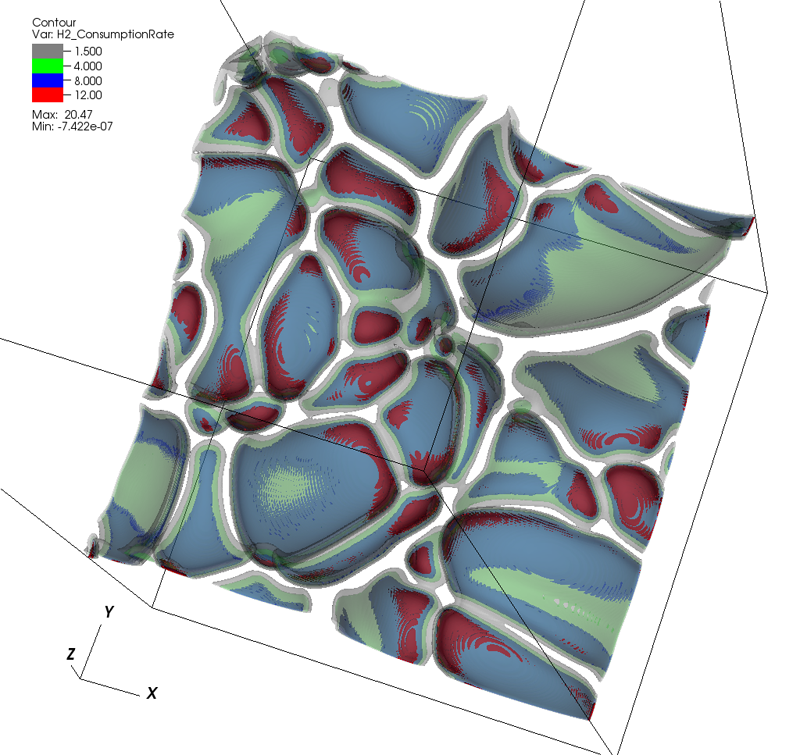
L. Zhou, C.D. Hansen.
“Transfer Function Design based on User Selected Samples for Intuitive Multivariate Volume Exploration,” In Proceedings of the 2013 IEEE Pacific Visualization Symposium (PacificVis), pp. 73--80. 2013.
ISSN: 2165-8765
DOI: 10.1109/PacificVis.2013.6596130
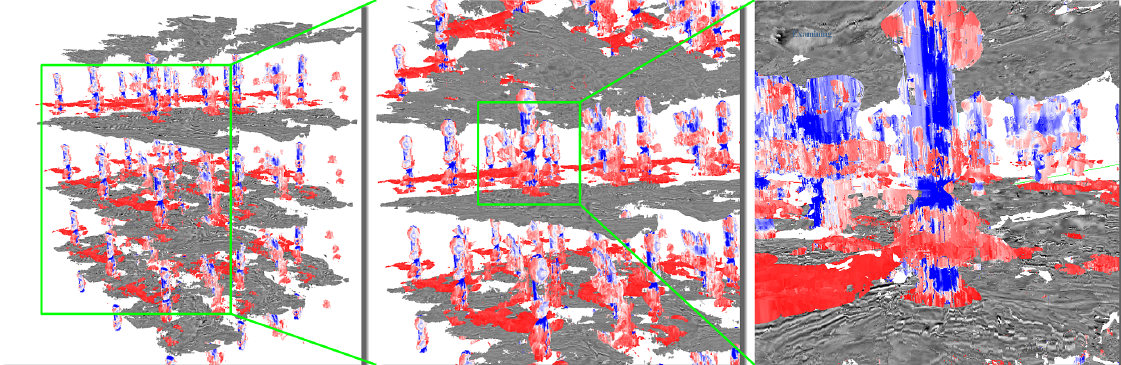
L. Zhou, C.D. Hansen.
“Interactive rendering and efficient querying for large multivariate seismic volumes on consumer level PCs,” In Proceedings of the 2013 IEEE Symposium on Large-Scale Data Analysis and Visualization (LDAV), pp. 117--118. 2013.
DOI: 10.1109/LDAV.2013.6675167
X. Zhu, Y. Gur, W. Wang, P.T. Fletcher.
“Model Selection and Estimation of Multi-Compartment Models in Diffusion MRI with a Rician Noise Model,” In Proceedings of the International Conference on Information Processing in Medical Imaging (IPMI), Lecture Notes in Computer Science (LNCS), Vol. 23, pp. 644--655. 2013.
PubMed ID: 24684006

2012
Y.-J. Ahn, C. Hoffmann, P. Rosen.
“A Note on Circle Packing,” In Journal of Zhejiang University SCIENCE C, Vol. 13, No. 8, pp. 559--564. 2012.
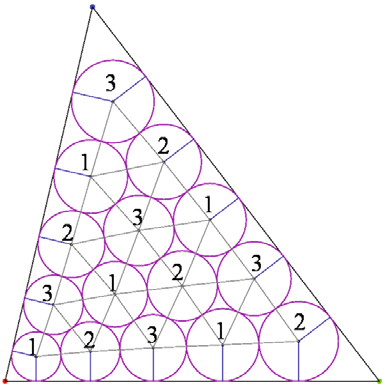
Keywords: Circle packing, Algorithm performance, Parallel computation, Graphics processing unit (GPU)
N.W. Akoum, C.J. McGann, G. Vergara, T. Badger, R. Ranjan, C. Mahnkopf, E.G. Kholmovski, R.S. Macleod, N.F. Marrouche.
“Atrial Fibrosis Quantified Using Late Gadolinium Enhancement MRI is AssociatedWith Sinus Node Dysfunction Requiring Pacemaker Implant,” In Journal of Cardiovascular Electrophysiology, Vol. 23, No. 1, pp. 44--50. 2012.
DOI: 10.1111/j.1540-8167.2011.02140.x
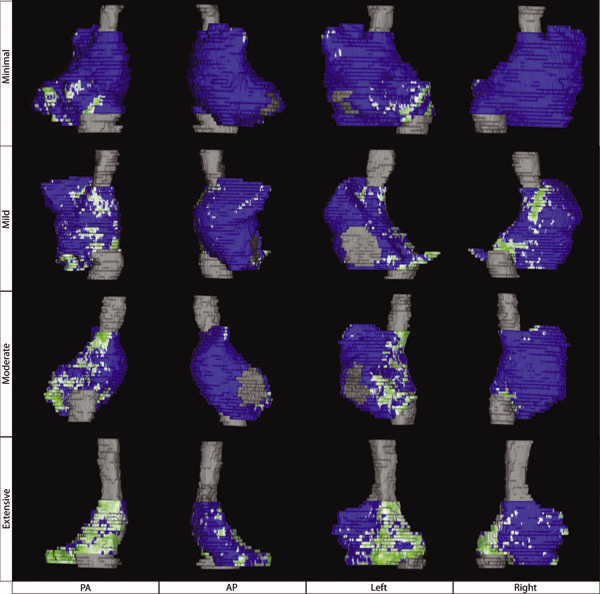
Atrial Fibrosis and Sinus Node Dysfunction. Introduction: Sinus node dysfunction (SND) commonly manifests with atrial arrhythmias alternating with sinus pauses and sinus bradycardia. The underlying process is thought to be because of atrial fibrosis. We assessed the value of atrial fibrosis, quantified using Late Gadolinium Enhanced-MRI (LGE-MRI), in predicting significant SND requiring pacemaker implant.
Methods: Three hundred forty-four patients with atrial fibrillation (AF) presenting for catheter ablation underwent LGE-MRI. Left atrial (LA) fibrosis was quantified in all patients and right atrial (RA) fibrosis in 134 patients. All patients underwent catheter ablation with pulmonary vein isolation with posterior wall and septal debulking. Patients were followed prospectively for 329 ± 245 days. Ambulatory monitoring was instituted every 3 months. Symptomatic pauses and bradycardia were treated with pacemaker implantation per published guidelines.
Results: The average patient age was 65 ± 12 years. The average wall fibrosis was 16.7 ± 11.1% in the LA, and 5.3 ± 6.4% in the RA. RA fibrosis was correlated with LA fibrosis (R2= 0.26; P < 0.01). Patients were divided into 4 stages of LA fibrosis (Utah I: 35%). Twenty-two patients (mean atrial fibrosis, 23.9%) required pacemaker implantation during follow-up. Univariate and multivariate analysis identified LA fibrosis stage (OR, 2.2) as a significant predictor for pacemaker implantation with an area under the curve of 0.704.
Conclusions: In patients with AF presenting for catheter ablation, LGE-MRI quantification of atrial fibrosis demonstrates preferential LA involvement. Significant atrial fibrosis is associated with clinically significant SND requiring pacemaker implantation. (J Cardiovasc Electrophysiol, Vol. 23, pp. 44-50, January 2012)
G.A. Ateshian, S.A. Maas, J.A. Weiss.
“Solute transport across a contact interface in deformable porous media,” In Journal of Biomechanics, Vol. 45, No. 6, pp. 1023-–1027. 2012.
DOI: 10.1016/j.jbiomech.2012.01.003
A finite element formulation of neutral solute transport across a contact interface between deformable porous media is implemented and validated against analytical solutions. By reducing the integral statements of external virtual work on the two contacting surfaces into a single contact integral, the algorithm automatically enforces continuity of solute molar flux across the contact interface, whereas continuity of the effective solute concentration (a measure of the solute mechano-chemical potential) is achieved using a penalty method. This novel formulation facilitates the analysis of problems in biomechanics where the transport of metabolites across contact interfaces of deformable tissues may be of interest. This contact algorithm is the first to address solute transport across deformable interfaces, and is made available in the public domain, open-source finite element code FEBio (http://www.febio.org).
Keywords: FEBio, Finite element modeling, Contact mechanics, Solute transport, Porous media, Biphasic theory
S.P. Awate, P. Zhu, R.T. Whitaker.
“How Many Templates Does It Take for a Good Segmentation?: Error Analysis in Multiatlas Segmentation as a Function of Database Size,” In Int. Workshop Multimodal Brain Image Analysis (MBIA) at Int. Conf. MICCAI, Lecture Notes in Computer Science (LNCS), Vol. 2, Note: Recieved Best Paper Award, pp. 103--114. 2012.
PubMed ID: 24501720
PubMed Central ID: PMC3910563
A. Barg, N. Knupp, H.B. Henninger, L. Zwicky, B. Hintermann.
“Total ankle replacement using HINTEGRA, an unconstrained, three-component system: surgical technique and pitfalls,” In Foot and Ankle Clinics, Vol. 17, No. 4, pp. 607--635. 2012.
DOI: 10.1016/j.fcl.2012.08.006
A. Barg, G.I. Pagenstert, A.G. Leumann, A.M. Müller, H.B. Henninger, V. Valderrabano.
“Treatment of the Arthritic Valgus Ankle,” In Foot and Ankle Clinics, Vol. 17, No. 4, pp. 647--663. 2012.
DOI: 10.1016/j.fcl.2012.08.007
A. Barg, M.D. Harris, H.B. Henninger, R.L. Amendola, C.L. Saltzman, B. Hintermann, A.E. Anderson.
“Medial distal tibial angle: comparison between weightbearing mortise view and hindfoot alignment view,” In Foot & Ankle International, Vol. 33, No. 8, pp. 655--661. 2012.
DOI: 10.3113/FAI.2012.0655
Background: The medial distal tibial angle (MDTA) is used to determine ankle alignment. The mortise view is the standard to measure MDTA, but the hindfoot alignment view (HAV) has become popular. The MDTA may vary between views, influencing the choice of surgery.
Methods: The MDTA was compared between the mortise and HAV in 146 ankles. MDTA was correlated to age and sagittal tibial tilt for each view. Differences in MDTA by gender and ethnicity were assessed. Diagnostic agreement (varus, valgus, normal) between views was calculated. Clinical assessment of alignment was determined and percent agreement between clinical and radiographic alignment was quantified.
Results: The MDTA measured from the mortise view and HAV radiographs was 89.0 (range, 81 to 96 degrees; SD = 2.8) degrees and 86.0 (range, 73 to 95 degrees; SD = 3.5) degrees, respectively. The MDTA was comparable for both genders for mortise (p = 0.356) and HAV (p = 0.621). The MDTA was comparable in all ethnic groups for mortise view (p = 0.616) and HAV (p = 0.916). Correlation between the measured MDTA and age was not statistically significant for both the mortise (r = 0.118; p = 0.158) and HAV (r = 0.148; p = 0.074). In only 47.3% of all ankles was the radiographic diagnosis of alignment the same between views. Agreement between clinical and radiographic classifications was 60.3% for the mortise view and 52.8% for the HAV.
Conclusion: Substantial disagreement in primary alignment was found between the mortise and HAV as quantified by the MDTA. Agreement between clinical and radiographic alignment was also poor. Clinical Relevance: Advanced imaging such as CT or MRI may better describe ankle alignment.
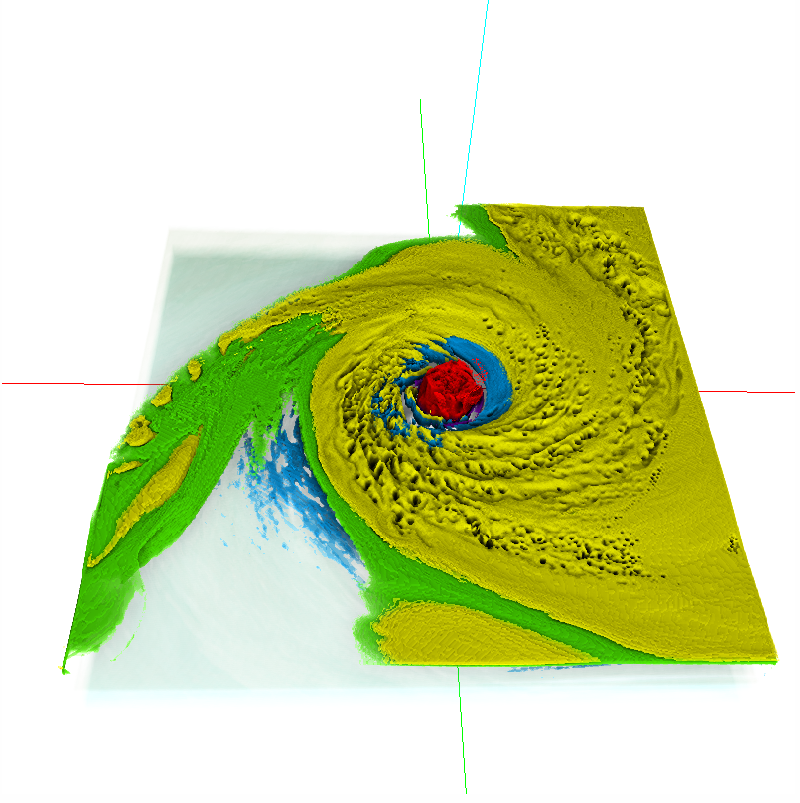
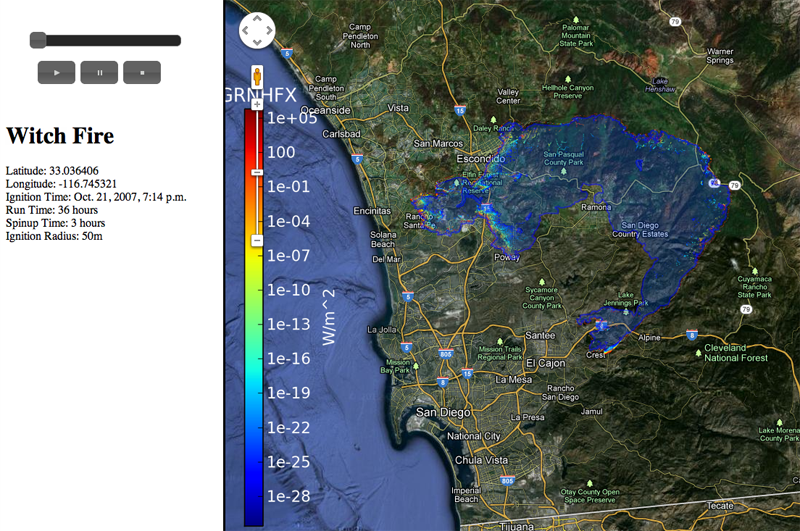
J. Beezley, M. Martin, P. Rosen, J. Mandel, A. Kochanski.
“Data management and analysis with WRF and SFIRE,” In Proceedings of the IEEE International Geoscience and Remote Sensing Symposium, Note: UCD CCM Report 312, 2012.
J.C. Bennett, H. Abbasi, P. Bremer, R.W. Grout, A. Gyulassy, T. Jin, S. Klasky, H. Kolla, M. Parashar, V. Pascucci, P. Pbay, D. Thompson, H. Yu, F. Zhang, J. Chen.
“Combining In-Situ and In-Transit Processing to Enable Extreme-Scale Scientific Analysis,” In ACM/IEEE International Conference for High Performance Computing, Networking, Storage, and Analysis (SC), Salt Lake City, Utah, U.S.A., November, 2012.
M. Berzins.
“Status of Release of the Uintah Computational Framework,” SCI Technical Report, No. UUSCI-2012-001, SCI Institute, University of Utah, 2012.
This report provides a summary of the status of the Uintah Computation Framework (UCF) software. Uintah is uniquely equipped to tackle large-scale multi-physics science and engineering problems on disparate length and time scales. The Uintah framework makes it possible to run adaptive computations on modern HPC architectures with tens and now hundreds of thousands of cores with complex communication/memory hierarchies. Uintah was orignally developed in the University of Utah Center for Simulation of Accidental Fires and Explosions (C-SAFE), a DOE-funded academic alliance project and then extended to the broader NSF snd DOE science and engineering communities. As Uintah is applicable to a wide range of engineering problems that involve fl uid-structure interactions with highly deformable structures it is used for a number of NSF-funded and DOE engineering projects. In this report the Uintah framework software is outlined and typical applications are illustrated. Uintah is open-source software that is available through the MIT open-source license at http://www.uintah.utah.edu/.
M. Berzins, Q. Meng, J. Schmidt, J.C. Sutherland.
“DAG-Based Software Frameworks for PDEs,” In Proceedings of Euro-Par 2011 Workshops, Part I, Lecture Notes in Computer Science (LNCS) 7155, Springer-Verlag Berlin Heidelberg, pp. 324--333. August, 2012.
The task-based approach to software and parallelism is well-known and has been proposed as a potential candidate, named the silver model, for exascale software. This approach is not yet widely used in the large-scale multi-core parallel computing of complex systems of partial differential equations. After surveying task-based approaches we investigate how well the Uintah software and an extension named Wasatch fit in the task-based paradigm and how well they perform on large scale parallel computers. The conclusion is that these approaches show great promise for petascale but that considerable algorithmic challenges remain.
Keywords: DOD, Uintah, CSAFE