SCI Publications
2012


S. Durrleman, S. Allassonniere, S. Joshi.
“Sparse Adaptive Parameterization of Variability in Image Ensembles,” In International Journal of Computer Vision, pp. 1--23. 2012.
ABSTRACT
This paper introduces a new parameterization of diffeomorphic deformations for the characterization of the variability in image ensembles. Dense diffeomorphic deformations are built by interpolating the motion of a finite set of control points that forms a Hamiltonian flow of self-interacting particles. The proposed approach estimates a template image representative of a given image set, an optimal set of control points that focuses on the most variable parts of the image, and template-to-image registrations that quantify the variability within the image set. The method automatically selects the most relevant control points for the characterization of the image variability and estimates their optimal positions in the template domain. The optimization in position is done during the estimation of the deformations without adding any computational cost at each step of the gradient descent. The selection of the control points is done by adding a
L1 prior to the objective function, which is optimized using the FISTA algorithm.
B. Erem, P. Stovicek, D.H. Brooks.
“Manifold learning for analysis of low-order nonlinear dynamics in high-dimensional electrocardiographic signals,” In Proceedings of the 9th IEEE International Symposium on Biomedical Imaging (ISBI), pp. 844--847. 2012.
DOI: 10.1109/ISBI.2012.6235680
ABSTRACT
The dynamical structure of electrical recordings from the heart or torso surface is a valuable source of information about cardiac physiological behavior. In this paper, we use an existing data-driven technique for manifold identification to reveal electrophysiologically significant changes in the underlying dynamical structure of these signals. Our results suggest that this analysis tool characterizes and differentiates important parameters of cardiac bioelectric activity through their dynamic behavior, suggesting the potential to serve as an effective dynamic constraint in the context of inverse solutions.
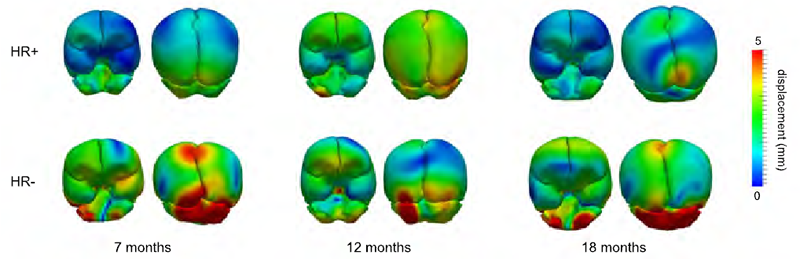
J. Fishbaugh, S. Durrleman, J. Piven, G. Gerig.
“A framework for longitudinal data analysis via shape regression,” In Medical Imaging 2012: Image Processing, Edited by David R. Haynor and Sebastien Ourselin, SPIE Intl Soc Optical Eng, Feb, 2012.
DOI: 10.1117/12.911721
ABSTRACT
Traditional longitudinal analysis begins by extracting desired clinical measurements, such as volume or head circumference, from discrete imaging data. Typically, the continuous evolution of a scalar measurement is estimated by choosing a 1D regression model, such as kernel regression or fitting a polynomial of fixed degree. This type of analysis not only leads to separate models for each measurement, but there is no clear anatomical or biological interpretation to aid in the selection of the appropriate paradigm. In this paper, we propose a consistent framework for the analysis of longitudinal data by estimating the continuous evolution of shape over time as twice differentiable flows of deformations. In contrast to 1D regression models, one model is chosen to realistically capture the growth of anatomical structures. From the continuous evolution of shape, we can simply extract any clinical measurements of interest. We demonstrate on real anatomical surfaces that volume extracted from a continuous shape evolution is consistent with a 1D regression performed on the discrete measurements. We further show how the visualization of shape progression can aid in the search for significant measurements. Finally, we present an example on a shape complex of the brain (left hemisphere, right hemisphere, cerebellum) that demonstrates a potential clinical application for our framework.
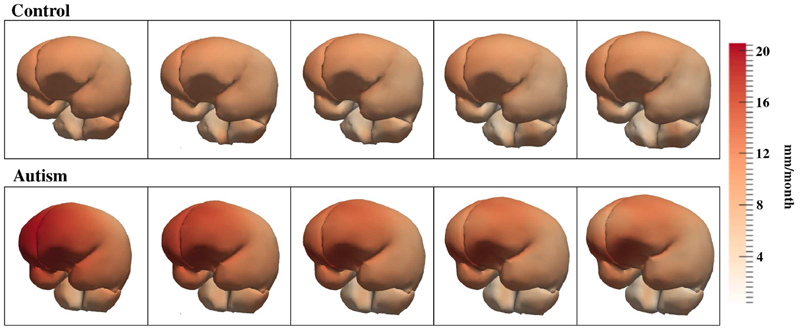
J. Fishbaugh, M.W. Prastawa, S. Durrleman, G. Gerig.
“Analysis of Longitudinal Shape Variability via Subject Specific Growth Modeling,” In Medical Image Computing and Computer-Assisted Intervention – Proceedings of MICCAI 2012, Lecture Notes in Computer Science (LNCS), Vol. 7510, pp. 731--738. October, 2012.
DOI: 10.1007/978-3-642-33415-3_90
ABSTRACT
Statistical analysis of longitudinal imaging data is crucial for understanding normal anatomical development as well as disease progression. This fundamental task is challenging due to the difficulty in modeling longitudinal changes, such as growth, and comparing changes across different populations. We propose a new approach for analyzing shape variability over time, and for quantifying spatiotemporal population differences. Our approach estimates 4D anatomical growth models for a reference population (an average model) and for individuals in different groups. We define a reference 4D space for our analysis as the average population model and measure shape variability through diffeomorphisms that map the reference to the individuals. Conducting our analysis on this 4D space enables straightforward statistical analysis of deformations as they are parameterized by momenta vectors that are located at homologous locations in space and time. We evaluate our method on a synthetic shape database and clinical data from a study that seeks to quantify growth differences in subjects at risk for autism.
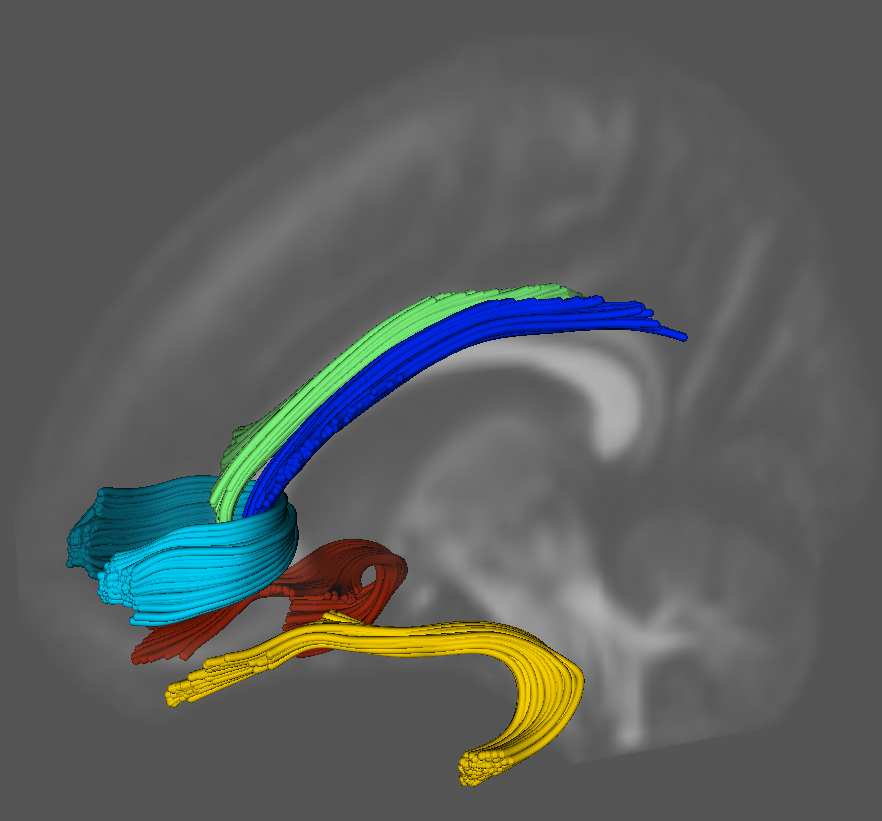
X. Geng, S. Gouttard, A. Sharma, H. Gu, M. Styner, W. Lin, G. Gerig, J.H. Gilmore.
“Quantitative Tract-Based White Matter Development from Birth to Age Two Years,” In NeuroImage, pp. 1-44. March, 2012.
DOI: 10.1016/j.neuroimage.2012.03.057
ABSTRACT
Few large-scale studies have been done to characterize the normal human brain white matter growth in the first years of life. We investigated white matter maturation patterns in major fiber pathways in a large cohort of healthy young children from birth to age two using diffusion parameters fractional anisotropy (FA), radial diffusivity (RD) and axial diffusivity (RD). Ten fiber pathways, including commissural, association and projection tracts, were examined with tract-based analysis, providing more detailed and continuous spatial developmental patterns compared to conventional ROI based methods. All DTI data sets were transformed to a population specific atlas with a group-wise longitudinal large deformation diffeomorphic registration approach. Diffusion measurements were analyzed along the major fiber tracts obtained in the atlas space. All fiber bundles show increasing FA values and decreasing radial and axial diffusivities during development in the first 2 years of life. The changing rates of the diffusion indices are faster in the first year than the second year for all tracts. RD and FA show larger percentage changes in the first and second years than AD. The gender effects on the diffusion measures are small. Along different spatial locations of fiber tracts, maturation does not always follow the same speed. Temporal and spatial diffusion changes near cortical regions are in general smaller than changes in central regions. Overall developmental patterns revealed in our study confirm the general rules of white matter maturation. This work shows a promising framework to study and analyze white matter maturation in a tract-based fashion. Compared to most previous studies that are ROI-based, our approach has the potential to discover localized development patterns associated with fiber tracts of interest.
S. Gerber, K. Potter.
“Data Analysis with the Morse-Smale Complex: The msr Package for R,” In Journal of Statistical Software, Vol. 50, No. 2, 2012.
ABSTRACT
In many areas, scientists deal with increasingly high-dimensional data sets. An important aspect for these scientists is to gain a qualitative understanding of the process or system from which the data is gathered. Often, both input variables and an outcome are observed and the data can be characterized as a sample from a high-dimensional scalar function. This work presents the R package msr for exploratory data analysis of multivariate scalar functions based on the Morse-Smale complex. The Morse-Smale complex provides a topologically meaningful decomposition of the domain. The msr package implements a discrete approximation of the Morse-Smale complex for data sets. In previous work this approximation has been exploited for visualization and partition-based regression, which are both supported in the msr package. The visualization combines the Morse-Smale complex with dimension-reduction techniques for a visual summary representation that serves as a guide for interactive exploration of the high-dimensional function. In a similar fashion, the regression employs a combination of linear models based on the Morse-Smale decomposition of the domain. This regression approach yields topologically accurate estimates and facilitates interpretation of general trends and statistical comparisons between partitions. In this manner, the msr package supports high-dimensional data understanding and exploration through the Morse-Smale complex.
P.H. Gesteland, Y. Livnat, N. Galli, M.H. Samore, A.V. Gundlapalli.
“The EpiCanvas infectious disease weather map: an interactive visual exploration of temporal and spatial correlations,” In J. Amer. Med. Inform. Assoc., Vol. 19, Note: Awarded 1st place for Outstanding Research Article at ISDS 2012 and the Homer R. Warner Award at the AMIA Annual Symposium 2012, pp. 954--959. 2012.
DOI: 10.1136/amiajnl-2011-000486
ABSTRACT
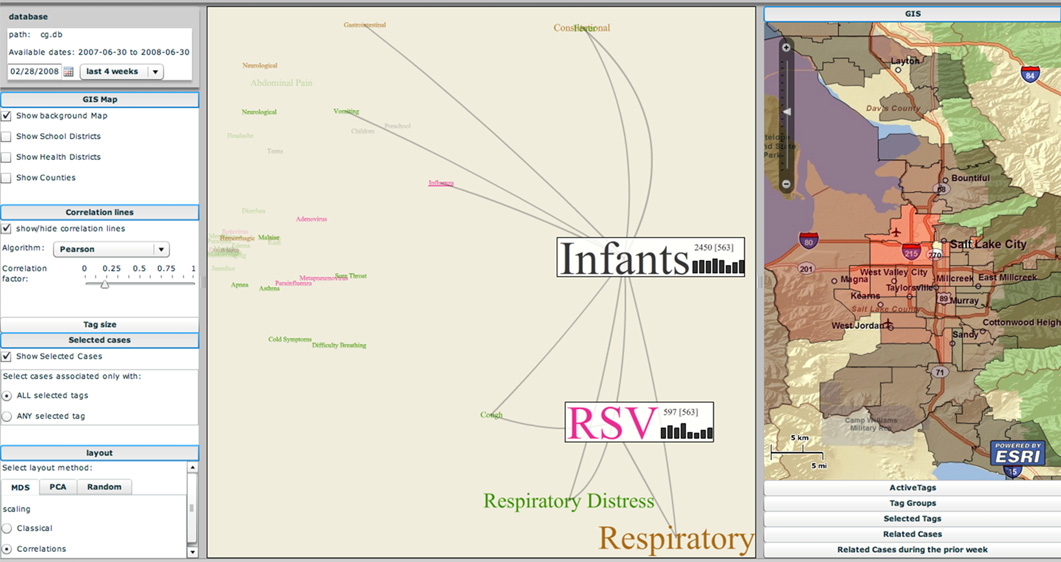
Advances in surveillance science have supported public health agencies in tracking and responding to disease outbreaks. Increasingly, epidemiologists have been tasked with interpreting multiple streams of heterogeneous data arising from varied surveillance systems. As a result public health personnel have experienced an overload of plots and charts as information visualization techniques have not kept pace with the rapid expansion in data availability. This study sought to advance the science of public health surveillance data visualization by conceptualizing a visual paradigm that provides an 'epidemiological canvas' for detection, monitoring, exploration and discovery of regional infectious disease activity and developing a software prototype of an 'infectious disease weather map'. Design objectives were elucidated and the conceptual model was developed using cognitive task analysis with public health epidemiologists. The software prototype was pilot tested using retrospective data from a large, regional pediatric hospital, and gastrointestinal and respiratory disease outbreaks were re-created as a proof of concept.
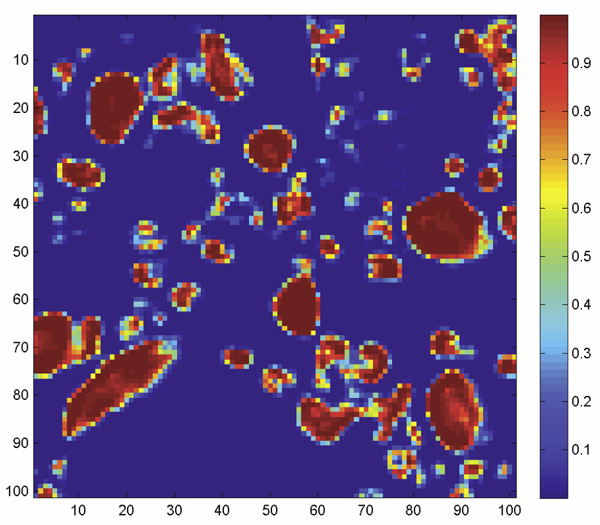
F.N. Golabchi, D.H. Brooks.
“Axon segmentation in microscopy images - A graphical model based approach,” In Proceedings of the 9th IEEE International Symposium on Biomedical Imaging (ISBI), pp. 756-759. 2012.
DOI: 10.1109/ISBI.2012.6235658
ABSTRACT
Image segmentation of very large and complex microscopy images are challenging due to variability in the images and the need for algorithms to be robust, fast and able to incorporate various types of information and constraints in the segmentation model. In this paper we propose a graphical model based image segmentation framework that combines the information in images regions with the information in their boundary in a unified probabilistic formulation.
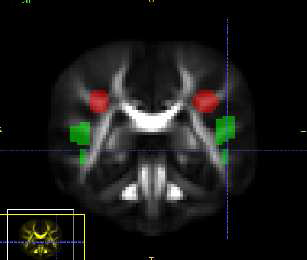
S. Gouttard, C.B. Goodlett, M. Kubicki, G. Gerig.
“Measures for Validation of DTI Tractography,” In Medical Imaging 2012: Image Processing, Edited by David R. Haynor and Sebastien Ourselin, SPIE Intl Soc Optical Eng, Feb, 2012.
DOI: 10.1117/12.911546
ABSTRACT
The evaluation of analysis methods for diffusion tensor imaging (DTI) remains challenging due to the lack of gold standards and validation frameworks. Significant work remains in developing metrics for comparing fiber bundles generated from streamline tractography. We propose a set of volumetric and tract oriented measures for evaluating tract differences. The different methods developed for this assessment work are: an overlap measurement, a point cloud distance and a quantification of the diffusion properties at similar locations between fiber bundles. The application of the measures in this paper is a comparison of atlas generated tractography to tractography generated in individual images. For the validation we used a database of 37 subject DTIs, and applied the measurements on five specific fiber bundles: uncinate, cingulum (left and right for both bundles) and genu. Each measurments is interesting for specific use: the overlap measure presents a simple and comprehensive metric but is sensitive to partial voluming and does not give consistent values depending on the bundle geometry. The point cloud distance associated with a quantile interpretation of the distribution gives a good intuition of how close and similar the bundles are. Finally, the functional difference is useful for a comparison of the diffusion properties since it is the focus of many DTI analysis to compare scalar invariants. The comparison demonstrated reasonable similarity of results. The tract difference measures are also applicable to comparison of tractography algorithms, quality control, reproducibility studies, and other validation problems.
A. Gupta, M. Escolar, C. Dietrich, J. Gilmore, G. Gerig, M. Styne.
“3D Tensor Normalization for Improved Accuracy in DTI Registration Methods,” In Biomedical Image Registration Lecture Notes in Computer Science (LNCS), In Biomedical Image Registration Lecture Notes in Computer Science (LNCS), Vol. 7359, pp. 170--179. 2012.
DOI: 10.1007/978-3-642-31340-0_18
ABSTRACT
This paper presents a method for normalization of diffusion tensor images (DTI) to a fixed DTI template, a pre-processing step to improve the performance of full tensor based registration methods. The proposed method maps the individual tensors of the subject image in to the template space based on matching the cumulative distribution function and the fractional anisotrophy values. The method aims to determine a more accurate deformation field from any full tensor registration method by applying the registration algorithm on the normalized DTI rather than the original DTI. The deformation field applied to the original tensor images are compared to the deformed image without normalization for 11 different cases of mapping seven subjects (neonate through 2 years) to two different atlases. The method shows an improvement in DTI registration based on comparing the normalized fractional anisotropy values of major fiber tracts in the brain.
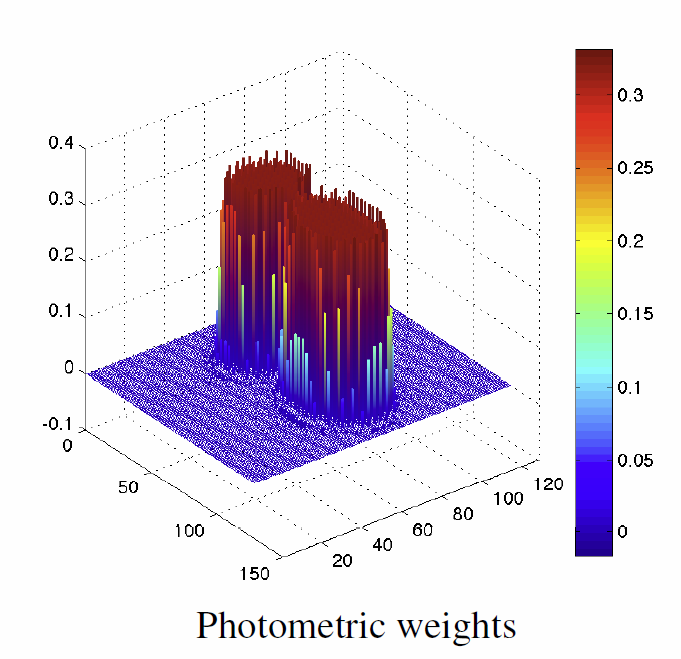
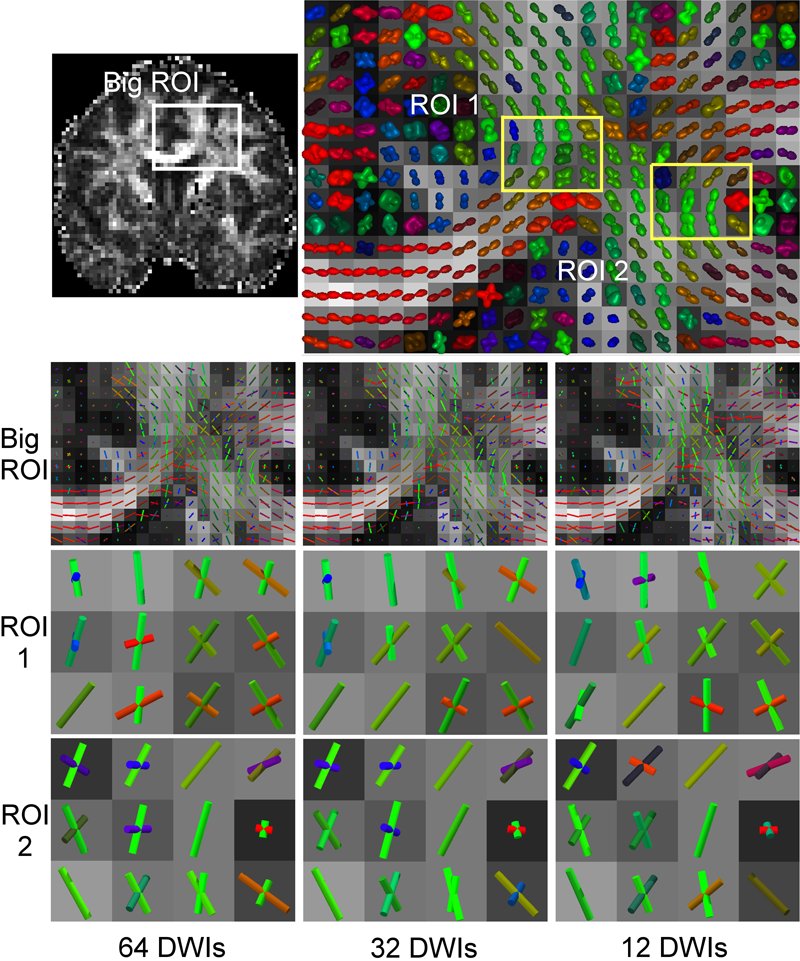
Y. Gur, F. Jiao, S.X. Zhu, C.R. Johnson.
“White matter structure assessment from reduced HARDI data using low-rank polynomial approximations,” In Proceedings of MICCAI 2012 Workshop on Computational Diffusion MRI (CDMRI12), Nice, France, Lecture Notes in Computer Science (LNCS), pp. 186-197. October, 2012.
ABSTRACT
Assessing white matter fiber orientations directly from DWI measurements in single-shell HARDI has many advantages. One of these advantages is the ability to model multiple fibers using fewer parameters than are required to describe an ODF and, thus, reduce the number of DW samples needed for the reconstruction. However, fitting a model directly to the data using Gaussian mixture, for instance, is known as an initialization-dependent unstable process. This paper presents a novel direct fitting technique for single-shell HARDI that enjoys the advantages of direct fitting without sacrificing the accuracy and stability even when the number of gradient directions is relatively low. This technique is based on a spherical deconvolution technique and decomposition of a homogeneous polynomial into a sum of powers of linear forms, known as a
symmetric tensor decomposition. The fiber-ODF (fODF), which is described by a homogeneous polynomial, is approximated here by a discrete sum of even-order linear-forms that are directly related to rank-1 tensors and represent single-fibers. This polynomial approximation is convolved to a single-fiber response function, and the result is optimized against the DWI measurements to assess the fiber orientations and the volume fractions directly. This formulation is accompanied by a robust iterative alternating numerical scheme which is based on the Levenberg- Marquardt technique. Using simulated data and in vivo, human brain data we show that the proposed algorithm is stable, accurate and can model complex fiber structures using only 12 gradient directions.
A. Gyulassy, V. Pascucci, T. Peterka, R. Ross.
“The Parallel Computation of Morse-Smale Complexes,” In Proceedings of the Parallel and Distributed Processing Symposium (IPDPS), pp. 484--495. 2012.
DOI: 10.1109/IPDPS.2012.52
ABSTRACT
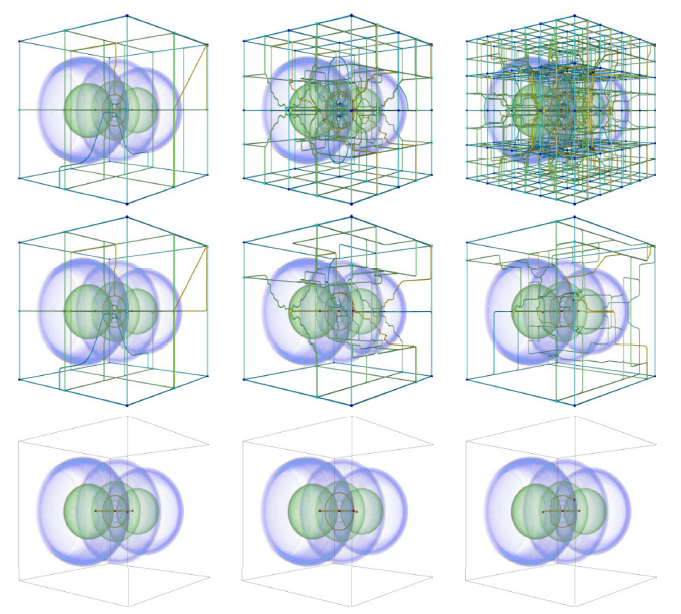
Topology-based techniques are useful for multiscale exploration of the feature space of scalar-valued functions, such as those derived from the output of large-scale simulations. The Morse-Smale (MS) complex, in particular, allows robust identification of gradient-based features, and therefore is suitable for analysis tasks in a wide range of application domains. In this paper, we develop a two-stage algorithm to construct the 1-skeleton of the Morse-Smale complex in parallel, the first stage independently computing local features per block and the second stage merging to resolve global features. Our implementation is based on MPI and a distributed-memory architecture. Through a set of scalability studies on the IBM Blue Gene/P supercomputer, we characterize the performance of the algorithm as block sizes, process counts, merging strategy, and levels of topological simplification are varied, for datasets that vary in feature composition and size. We conclude with a strong scaling study using scientific datasets computed by combustion and hydrodynamics simulations.
A. Gyulassy, P.-T. Bremer, V. Pascucci.
“Computing Morse-Smale Complexes with Accurate Geometry,” In IEEE Transactions on Visualization and Computer Graphics, Vol. 18, No. 12, pp. 2014--2022. 2012.
DOI: 10.1109/TVCG.2011.272
ABSTRACT
Topological techniques have proven highly successful in analyzing and visualizing scientific data. As a result, significant efforts have been made to compute structures like the Morse-Smale complex as robustly and efficiently as possible. However, the resulting algorithms, while topologically consistent, often produce incorrect connectivity as well as poor geometry. These problems may compromise or even invalidate any subsequent analysis. Moreover, such techniques may fail to improve even when the resolution of the domain mesh is increased, thus producing potentially incorrect results even for highly resolved functions. To address these problems we introduce two new algorithms: (i) a randomized algorithm to compute the discrete gradient of a scalar field that converges under refinement; and (ii) a deterministic variant which directly computes accurate geometry and thus correct connectivity of the MS complex. The first algorithm converges in the sense that on average it produces the correct result and its standard deviation approaches zero with increasing mesh resolution. The second algorithm uses two ordered traversals of the function to integrate the probabilities of the first to extract correct (near optimal) geometry and connectivity. We present an extensive empirical study using both synthetic and real-world data and demonstrates the advantages of our algorithms in comparison with several popular approaches.
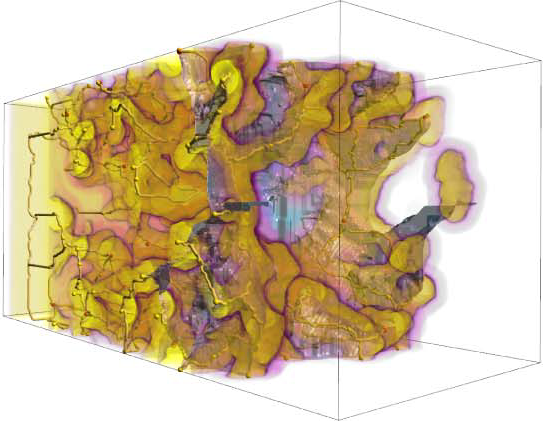
A. Gyulassy, N. Kotava, M. Kim, C. Hansen, H. Hagen, and V. Pascucci.
“Direct Feature Visualization Using Morse-Smale Complexes,” In IEEE Transactions on Visualization and Computer Graphics, Vol. 18, No. 9, pp. 1549--1562. September, 2012.
DOI: 10.1109/TVCG.2011.272
ABSTRACT
In this paper, we characterize the range of features that can be extracted from an Morse-Smale complex and describe a unified query language to extract them. We provide a visual dictionary to guide users when defining features in terms of these queries. We demonstrate our topology-rich visualization pipeline in a tool that interactively queries the MS complex to extract features at multiple resolutions, assigns rendering attributes, and combines traditional volume visualization with the extracted features. The flexibility and power of this approach is illustrated with examples showing novel features.
L.K. Ha, J. Krüger, J.L.D. Comba, C.T. Silva, S. Joshi.
“ISP: An Optimal Out-of-Core Image-Set Processing Streaming Architecture for Parallel Heterogeneous Systems,” In IEEE Transactions on Visualization and Computer Graphics (TVCG), Vol. 18, No. 6, pp. 838--851. 2012.
DOI: 10.1109/TVCG.2012.32
ABSTRACT
Image population analysis is the class of statistical methods that plays a central role in understanding the development, evolution and disease of a population. However, these techniques often require excessive computational power and memory that are compounded with a large number of volumetric inputs. Restricted access to supercomputing power limits its influence in general research and practical applications. In this paper we introduce ISP, an Image-Set Processing streaming framework that harnesses the processing power of commodity heterogeneous CPU/GPU systems and attempts to solve this computational problem. In ISP we introduce specially-designed streaming algorithms and data structures that provide an optimal solution for out-of-core multi-image processing problems both in terms of memory usage and computational efficiency. ISP makes use of the asynchronous execution mechanism supported by parallel heterogeneous systems to efficiently hide the inherent latency of the processing pipeline of out-of-core approaches. Consequently, with computationally intensive problems, the ISP out-of-core solution can achieve the same performance as the in-core solution. We demonstrate the efficiency of the ISP framework on synthetic and real datasets.
L.K. Ha, J. Krüger, J.L.D. Comba, C.T. Silva, S. Joshi.
“ISP: An Optimal Out-of-Core Image-Set Processing Streaming Architecture for Parallel Heterogeneous Systems,” In IEEE Transactions on Visualization and Computer Graphics, Vol. 18, No. 5, pp. 838--851. 2012.
DOI: 10.1109/TVCG.2012.32
J.P. Halloran, S. Sibole, C.C. Van Donkelaar, M.C. Van Turnhout, O.W. Oomens, J.A. Weiss, F. Guilak, A. Erdemir.
“Multiscale mechanics of articular cartilage: potentials and challenges of coupling musculoskeletal, joint, and microscale computational models,” In Annals of Biomedical Engineering, Vol. 40, No. 11, pp. 2456--2474. 2012.
PubMed ID: 10.1007/s10439-012-0598-0
ABSTRACT
Articular cartilage experiences significant mechanical loads during daily activities. Healthy cartilage provides the capacity for load bearing and regulates the mechanobiological processes for tissue development, maintenance, and repair. Experimental studies at multiple scales have provided a fundamental understanding of macroscopic mechanical function, evaluation of the micromechanical environment of chondrocytes, and the foundations for mechanobiological response. In addition, computational models of cartilage have offered a concise description of experimental data at many spatial levels under healthy and diseased conditions, and have served to generate hypotheses for the mechanical and biological function. Further, modeling and simulation provides a platform for predictive risk assessment, management of dysfunction, as well as a means to relate multiple spatial scales. Simulation-based investigation of cartilage comes with many challenges including both the computational burden and often insufficient availability of data for model development and validation. This review outlines recent modeling and simulation approaches to understand cartilage function from a mechanical systems perspective, and illustrates pathways to associate mechanics with biological function. Computational representations at single scales are provided from the body down to the microstructure, along with attempts to explore multiscale mechanisms of load sharing that dictate the mechanical environment of the cartilage and chondrocytes.
B.J. Hansen, M.D. Harris, L.A. Anderson, C.L. Peters, J.A. Weiss, A.E. Anderson.
“Correlation between radiographic measures of acetabular morphology with 3D femoral head coverage in patients with acetabular retroversion,” In Acta Orthopaedica, Vol. 83, No. 3, pp. 233--239. 2012.
DOI: 10.3109/17453674.2012.684138
ABSTRACT
Background and purpose
Acetabular retroversion may result in anterior acetabular over-coverage and posterior deficiency. It is unclear how standard radiographic measures of retroversion relate to measurements from 3D models, generated from volumetric CT data. We sought to: (1) compare 2D radiographic measurements between patients with acetabular retroversion and normal control subjects, (2) compare 3D measurements of total and regional femoral head coverage between patients and controls, and (3) quantify relationships between radiographic measurements of acetabular retroversion to total and regional coverage of the femoral head.
Patients and methods
For 16 patients and 18 controls we measured the extrusion index, crossover ratio, acetabular angle, acetabular index, lateral center edge angle, and a new measurement termed the "posterior wall distance". 3D femoral coverage was determined from volumetric CT data using objectively defined acetabular rim projections, head-neck junctions, and 4 anatomic regions. For radiographic measurements, intra-observer and inter-observer reliabilities were evaluated and associations between 2D radiographic and 3D model-based measures were determined.
Results
Compared to control subjects, patients with acetabular retroversion had a negative posterior wall distance, increased extrusion index, and smaller lateral center edge angle. Differences in the acetabular index between groups approached statistical significance. The acetabular angle was similar between groups. Acetabular retroversion was associated with a slight but statistically significant increase in anterior acetabular coverage, especially in the anterolateral region. Retroverted hips had substantially less posterior coverage, especially in the posterolateral region.
Interpretation
We found that a number of 2D radiographic measures of acetabular morphology were correlated with 3D model-based measures of total and regional femoral head coverage. These correlations may be used to assist in the diagnosis of retroversion and for preoperative planning.
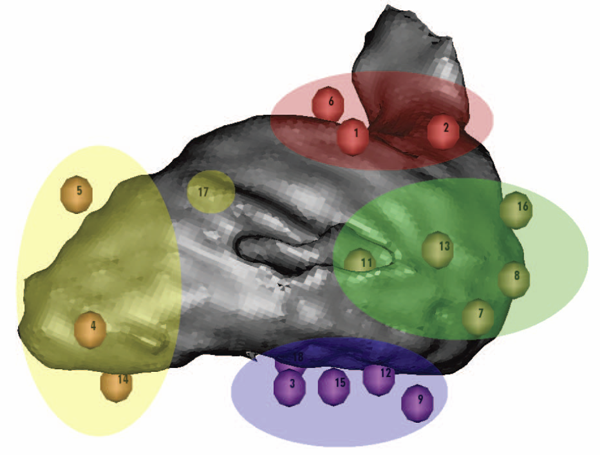
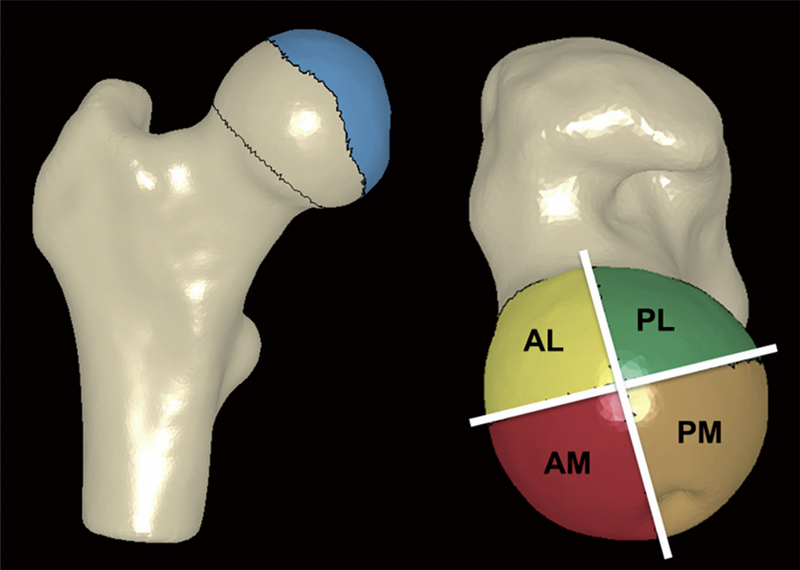
M.D. Harris, M. Datar, E. Jurrus, C.L. Peters, R.T. Whitaker, A.E. Anderson.
“Statistical Shape Modeling of CAM-type Femoroacetabular Impingement,” In Proceedings of the International Symposium on Computer Methods in Biomechanics and Biomedical Engineering (CMBBE 2012), 2012.
ABSTRACT
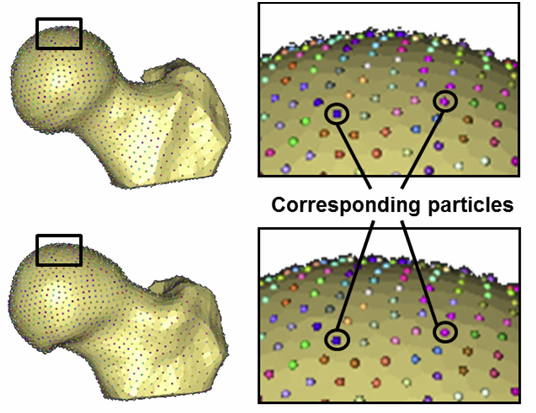
Cam femoroacetabular impingement (FAI) is characterized by a malformed femoral head that may cause shearing between the femur and acetabulum, leading to intraarticular damage and early hip osteoarthritis. Radiographic measurements are used to diagnose cam FAI, but provide only a planar view of the femoral head and often assume the ideal femur shape to be spherical. Statistical shape modeling (SSM) can be used to objectively compare complex 3D morphology without the need to assume ideal geometry. The objective of this study was to generate accurate 3D reconstructions of femoral heads and apply statistical shape modeling to quantify 3D variation and morphologic differences between control and cam femurs. Femurs from 33 controls and 15 cam FAI patients were CT scanned and 3D surfaces were generated by image segmentation. Correspondence particles were optimally positioned upon each surface using a gradient descent energy function. Resulting particle configurations were used to generate mean shapes for each group. Morphological differences were calculated as the distance between mean control and patient geometries. Differences were consistent with the location and approximate shape of cam lesions found intra-operatively. Deviations in mean shape between groups were pronounced at the anterolateral headneck junction, where the mean cam femur protruded from the mean control femur by a maximum of 2.7mm. Sustained protrusions of ~1.0-2.5mm were distributed from the anterior-posterior midline of the femoral neck along the entire anterolateral head-neck junction and distally along the anterior section of the neck. Future work will refine our statistical shape modeling software to quantify, on a patient-specific basis, the severity of cam lesions for pre-operative planning.
M.D. Harris, A.E. Anderson, C.R. Henak, B.J. Ellis, C.L. Peters, J.A. Weiss.
“Finite element prediction of cartilage contact stresses in normal human hips,” In Journal of Orthopaedic Research, Vol. 30, No. 7, pp. 1133--1139. 2012.
DOI: 10.1002/jor.22040
ABSTRACT

Our objectives were to determine cartilage contact stress during walking, stair climbing, and descending stairs in a well-defined group of normal volunteers and to assess variations in contact stress and area among subjects and across loading scenarios. Ten volunteers without history of hip pain or disease with normal lateral center-edge angle and acetabular index were selected. Computed tomography imaging with contrast was performed on one hip. Bone and cartilage surfaces were segmented from volumetric image data, and subject-specific finite element models were constructed and analyzed using a validated protocol. Acetabular contact stress and area were determined for seven activities. Peak stress ranged from 7.52 ± 2.11 MPa for heel-strike during walking (233% BW) to 8.66 ± 3.01 MPa for heel-strike during descending stairs (261% BW). Average contact area across all activities was 34% of the surface area of the acetabular cartilage. The distribution of contact stress was highly non-uniform, and more variability occurred among subjects for a given activity than among activities for a single subject. The magnitude and area of contact stress were consistent between activities, although inter-activity shifts in contact pattern were found as the direction of loading changed. Relatively small incongruencies between the femoral and acetabular cartilage had a large effect on the contact stresses. These effects tended to persist across all simulated activities. These results demonstrate the diversity and trends in cartilage contact stress in healthy hips during activities of daily living and provide a basis for future comparisons between normal and pathologic hips.
Keywords: hip, finite element, biomechanics, cartilage contact stresses, cartilage pressure