


SCI Publications
2015

C.R. Johnson, K. Potter.
“Visualization,” In The Princeton Companion to Applied Mathematics, Edited by Nicholas J. Higham, Princeton University Press, pp. 843-846. September, 2015.
ISBN: 9780691150390

H. De Sterck, C.R. Johnson.
“Data Science: What Is It and How Is It Taught?,” In SIAM News, SIAM, July, 2015.
C.R. Johnson.
“Computational Methods and Software for Bioelectric Field Problems,” In Biomedical Engineering Handbook, 4, Vol. 1, Ch. 43, Edited by J.D. Bronzino and D.R. Peterson, CRC Press, pp. 1--28. 2015.
Computer modeling and simulation continue to become more important in the field of bioengineering. The reasons for this growing importance are manyfold. First, mathematical modeling has been shown to be a substantial tool for the investigation of complex biophysical phenomena. Second, since the level of complexity one can model parallels the existing hardware configurations, advances in computer architecture have made it feasible to apply the computational paradigm to complex biophysical systems. Hence, while biological complexity continues to outstrip the capabilities of even the largest computational systems, the computational methodology has taken hold in bioengineering and has been used successfully to suggest physiologically and clinically important scenarios and results.
This chapter provides an overview of numerical techniques that can be applied to a class of bioelectric field problems. Bioelectric field problems are found in a wide variety of biomedical applications, which range from single cells, to organs, up to models that incorporate partial to full human structures. We describe some general modeling techniques that will be applicable, in part, to all the aforementioned applications. We focus our study on a class of bioelectric volume conductor problems that arise in electrocardiography (ECG) and electroencephalography (EEG).
We begin by stating the mathematical formulation for a bioelectric volume conductor, continue by describing the model construction process, and follow with sections on numerical solutions and computational considerations. We continue with a section on error analysis coupled with a brief introduction to adaptive methods. We conclude with a section on software.
C.R. Johnson.
“Visualization,” In Encyclopedia of Applied and Computational Mathematics, Edited by Björn Engquist, Springer, pp. 1537-1546. 2015.
ISBN: 978-3-540-70528-4
DOI: 10.1007/978-3-540-70529-1_368
C. Jones, T. Liu, N.W. Cohan, M. Ellisman, T. Tasdizen.
“Efficient semi-automatic 3D segmentation for neuron tracing in electron microscopy images,” In Journal of Neuroscience Methods, Vol. 246, Elsevier BV, pp. 13--21. May, 2015.
DOI: 10.1016/j.jneumeth.2015.03.005
Background
In the area of connectomics, there is a significant gap between the time required for data acquisition and dense reconstruction of the neural processes contained in the same dataset. Automatic methods are able to eliminate this timing gap, but the state-of-the-art accuracy so far is insufficient for use without user corrections. If completed naively, this process of correction can be tedious and time consuming.
New method
We present a new semi-automatic method that can be used to perform 3D segmentation of neurites in EM image stacks. It utilizes an automatic method that creates a hierarchical structure for recommended merges of superpixels. The user is then guided through each predicted region to quickly identify errors and establish correct links.
Results
We tested our method on three datasets with both novice and expert users. Accuracy and timing were compared with published automatic, semi-automatic, and manual results.
Comparison with existing methods
Post-automatic correction methods have also been used in Mishchenko et al. (2010) and Haehn et al. (2014). These methods do not provide navigation or suggestions in the manner we present. Other semi-automatic methods require user input prior to the automatic segmentation such as Jeong et al. (2009) and Cardona et al. (2010) and are inherently different than our method.
Conclusion
Using this method on the three datasets, novice users achieved accuracy exceeding state-of-the-art automatic results, and expert users achieved accuracy on par with full manual labeling but with a 70% time improvement when compared with other examples in publication.
M. Kim, C.D. Hansen.
“Surface Flow Visualization using the Closest Point Embedding,” In 2015 IEEE Pacific Visualization Symposium, April, 2015.
Keywords: vector field, flow visualization
M. Kim, C.D. Hansen.
“GPU Surface Extraction with the Closest Point Embedding,” In Proceedings of IS&T/SPIE Visualization and Data Analysis, 2015, February, 2015.
Keywords: scalar field methods, GPGPU, curvature based, scientific visualization
R.M. Kirby, M. Berzins, J.S. Hesthaven (Editors).
“Spectral and High Order Methods for Partial Differential Equations,” Subtitled “Selected Papers from the ICOSAHOM'14 Conference, June 23-27, 2014, Salt Lake City, UT, USA.,” In Lecture Notes in Computational Science and Engineering, Springer, 2015.
O. A. von Lilienfeld, R. Ramakrishanan, M., A. Knoll.
“Fourier Series of Atomic Radial Distribution Functions: A Molecular Fingerprint for Machine Learning Models of Quantum Chemical Properties,” In International Journal of Quantum Chemistry, Wiley Online Library, 2015.
We introduce a fingerprint representation of molecules based on a Fourier series of atomic radial distribution functions. This fingerprint is unique (except for chirality), continuous, and differentiable with respect to atomic coordinates and nuclear charges. It is invariant with respect to translation, rotation, and nuclear permutation, and requires no pre-conceived knowledge about chemical bonding, topology, or electronic orbitals. As such it meets many important criteria for a good molecular representation, suggesting its usefulness for machine learning models of molecular properties trained across chemical compound space. To assess the performance of this new descriptor we have trained machine learning models of molecular enthalpies of atomization for training sets with up to 10 k organic molecules, drawn at random from a published set of 134 k organic molecules with an average atomization enthalpy of over 1770 kcal/mol. We validate the descriptor on all remaining molecules of the 134 k set. For a training set of 10k molecules the fingerprint descriptor achieves a mean absolute error of 8.0 kcal/mol, respectively. This is slightly worse than the performance attained using the Coulomb matrix, another popular alternative, reaching 6.2 kcal/mol for the same training and test sets.
S. Liu, D. Maljovec, Bei Wang, P. T. Bremer, V. Pascucci.
“Visualizing High-Dimensional Data: Advances in the Past Decade,” In State of The Art Report, Eurographics Conference on Visualization (EuroVis), 2015.

S. Liu, Bei Wang, J. J. Thiagarajan, P. T. Bremer, V. Pascucci.
“Visual Exploration of High-Dimensional Data through Subspace Analysis and Dynamic Projections,” In Computer Graphics Forum, Vol. 34, No. 3, Wiley-Blackwell, pp. 271--280. June, 2015.
DOI: 10.1111/cgf.12639

CIBC.
Note: map3d: Interactive scientific visualization tool for bioengineering data. Scientific Computing and Imaging Institute (SCI), Download from: http://www.sci.utah.edu/cibc/software.html, 2015.
K.S. McDowell, S. Zahid, F. Vadakkumpadan, J.J. Blauer, R.S. MacLeod, N.A. Trayanova.
“Virtual Electrophysiological Study of Atrial Fibrillation in Fibrotic Remodeling,” In PLoS ONE, Vol. 10, No. 2, pp. e0117110. February, 2015.
DOI: 10.1371/journal.pone.0117110
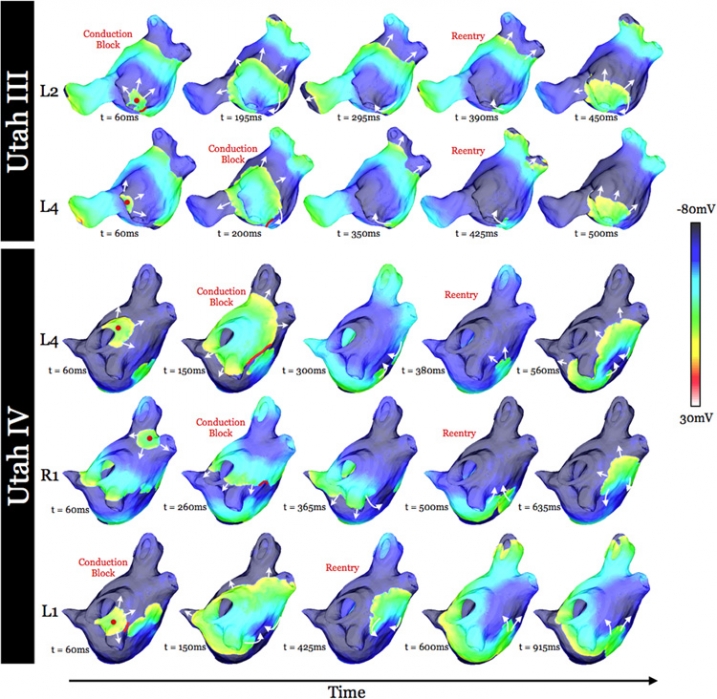
K. S. McDowell, S. Zahid, F. Vadakkumpadan, J. Blauer, R. S. MacLeod, N. A. Trayanova.
“Virtual Electrophysiological Study of Atrial Fibrillation in Fibrotic Remodeling,” In PLoS ONE, Vol. 10, No. 2, Public Library of Science, pp. 1-16. May, 2015.
DOI: doi.org/10.1371/journal.pone.0117110
Research has indicated that atrial fibrillation (AF) ablation failure is related to the presence of atrial fibrosis. However it remains unclear whether this information can be successfully used in predicting the optimal ablation targets for AF termination. We aimed to provide a proof-of-concept that patient-specific virtual electrophysiological study that combines i) atrial structure and fibrosis distribution from clinical MRI and ii) modeling of atrial electrophysiology, could be used to predict: (1) how fibrosis distribution determines the locations from which paced beats degrade into AF; (2) the dynamic behavior of persistent AF rotors; and (3) the optimal ablation targets in each patient. Four MRI-based patient-specific models of fibrotic left atria were generated, ranging in fibrosis amount. Virtual electrophysiological studies were performed in these models, and where AF was inducible, the dynamics of AF were used to determine the ablation locations that render AF non-inducible. In 2 of the 4 models patient-specific models AF was induced; in these models the distance between a given pacing location and the closest fibrotic region determined whether AF was inducible from that particular location, with only the mid-range distances resulting in arrhythmia. Phase singularities of persistent rotors were found to move within restricted regions of tissue, which were independent of the pacing location from which AF was induced. Electrophysiological sensitivity analysis demonstrated that these regions changed little with variations in electrophysiological parameters. Patient-specific distribution of fibrosis was thus found to be a critical component of AF initiation and maintenance. When the restricted regions encompassing the meander of the persistent phase singularities were modeled as ablation lesions, AF could no longer be induced. The study demonstrates that a patient-specific modeling approach to identify non-invasively AF ablation targets prior to the clinical procedure is feasible.
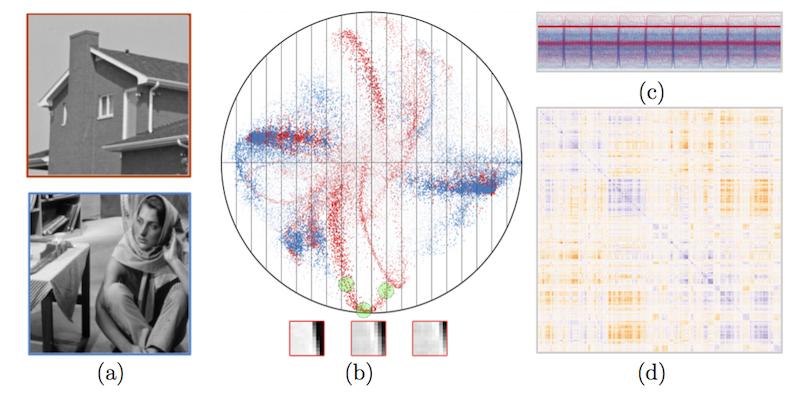
S. McKenna, M. Meyer, C. Gregg, S. Gerber.
“s-CorrPlot: An Interactive Scatterplot for Exploring Correlation,” In Journal of Computational and Graphical Statistics, 2015.
DOI: 10.1080/10618600.2015.1021926
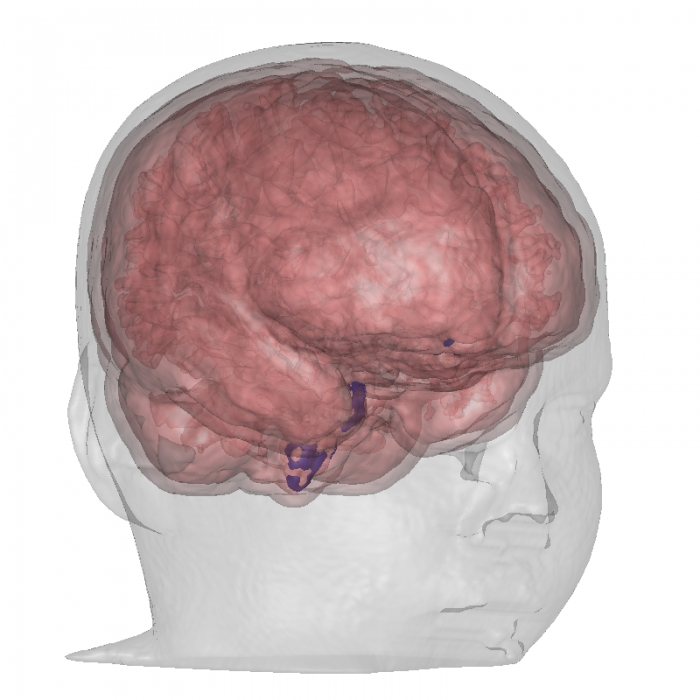
F. Mesadi, M. Cetin, T. Tasdizen.
“Disjunctive Normal Shape and Appearance Priors with Applications to Image Segmentation,” In Lecture Notes in Computer Science, Springer International Publishing, pp. 703--710. 2015.
ISBN: 978-3-319-24574-4
DOI: 10.1007/978-3-319-24574-4_84
The use of appearance and shape priors in image segmentation is known to improve accuracy; however, existing techniques have several drawbacks. Active shape and appearance models require landmark points and assume unimodal shape and appearance distributions. Level set based shape priors are limited to global shape similarity. In this paper, we present a novel shape and appearance priors for image segmentation based on an implicit parametric shape representation called disjunctive normal shape model (DNSM). DNSM is formed by disjunction of conjunctions of half-spaces defined by discriminants. We learn shape and appearance statistics at varying spatial scales using nonparametric density estimation. Our method can generate a rich set of shape variations by locally combining training shapes. Additionally, by studying the intensity and texture statistics around each discriminant of our shape model, we construct a local appearance probability map. Experiments carried out on both medical and natural image datasets show the potential of the proposed method.
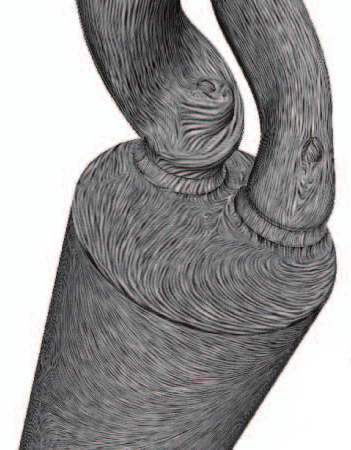
J.A. Nairn, J.E. Guilkey.
“Axisymmetric Form of the Generalized Interpolation Material Point Method,” In Int. J. for Numerical Methods in Engineering, Vol. 101, pp. 127-147. 2015.
DOI: 10.1002/nme.4792
This paper reformulates the axisymmetric form of the material point method (MPM) using generalized interpolation material point (GIMP) methods. The reformulation led to a need for new shape functions and gradients specific for axisymmetry that were not available before. The new shape functions differ most from planar shape functions near the origin where r=0. A second purpose for this paper was to evaluate the consequences of axisymmetry on a variety MPM extensions that have been developed since the original work on axisymmetric MPM. These extensions included convected particle domain integration (CPDI), traction boundary conditions, explicit cracks, multimaterial mode MPM for contact, thermal conduction, and solvent diffusion. Some examples show that the axisymmetric shape functions work well and are especially crucial near the origin. One real-world example is given for modeling a cylinder-penetration problem. Finally, a check list for software development describes all tasks needed to convert 2D planar or 3D codes to include an option for axisymmetric MPM.
SCI Institute.
Note: NCR Toolset: A collection of software tools for the reconstruction and visualization of neural circuitry from electron microscopy data. Scientific Computing and Imaging Institute (SCI). Download from: http://www.sci.utah.edu/software.html, 2015.
C. Nobre, A. Lex.
“OceanPaths: Visualizing Multivariate Oceanography Data,” In Eurographics Conference on Visualization (EuroVis) - Short Papers, Edited by E. Bertini, J. Kennedy, E. Puppo, The Eurographics Association, 2015.
DOI: 10.2312/eurovisshort.20151124
Geographical datasets are ubiquitous in oceanography. While map-based visualizations are useful for many different domains, they can suffer from cluttering and overplotting issues when used for multivariate data sets. As a result, spatial data exploration in oceanography has often been restricted to multiple maps showing various depths or time intervals. This lack of interactive exploration often hinders efforts to expose correlations between properties of oceanographic features, specifically currents. OceanPaths provides powerful interaction and exploration methods for spatial, multivariate oceanography datasets to remedy these situations. Fundamentally, our method allows users to define pathways, typically following currents, along which the variation of the high-dimensional data can be plotted efficiently. We present a case study conducted by domain experts to underscore the usefulness of OceanPaths in uncovering trends and correlations in oceanographic data sets.
I. OguzI, J. Cates, M. Datar, B. Paniagua, T. Fletcher, C. Vachet, M. Styner, R. Whitaker.
“Entropy-based particle correspondence for shape populations,” In International Journal of Computer Assisted Radiology and Surgery, Springer, pp. 1-12. December, 2015.
Purpose
Statistical shape analysis of anatomical structures plays an important role in many medical image analysis applications such as understanding the structural changes in anatomy in various stages of growth or disease. Establishing accurate correspondence across object populations is essential for such statistical shape analysis studies.
Methods
In this paper, we present an entropy-based correspondence framework for computing point-based correspondence among populations of surfaces in a groupwise manner. This robust framework is parameterization-free and computationally efficient. We review the core principles of this method as well as various extensions to deal effectively with surfaces of complex geometry and application-driven correspondence metrics.
Results
We apply our method to synthetic and biological datasets to illustrate the concepts proposed and compare the performance of our framework to existing techniques.
Conclusions
Through the numerous extensions and variations presented here, we create a very flexible framework that can effectively handle objects of various topologies, multi-object complexes, open surfaces, and objects of complex geometry such as high-curvature regions or extremely thin features.