


SCI Publications
2014


S. Kurugol, K. Kose, B. Park, J.G. Dy, D.H. Brooks, M. Rajadhyaksha.
“Automated Delineation of Dermal-Epidermal Junction In Reflectance Confocal Microscopy Image Stacks Of Human Skin,” In Journal of Investigative Dermatology, September, 2014.
DOI: 10.1038/jid.2014.379
PubMed ID: 25184959
Reflectance confocal microscopy (RCM) images skin non-invasively, with optical sectioning and nuclear-level resolution comparable to that of pathology. Based on assessment of the dermal-epidermal junction (DEJ) and morphologic features in its vicinity, skin cancer can be diagnosed in vivo with high sensitivity and specificity. However, the current visual, qualitative approach for reading images leads to subjective variability in diagnosis. We hypothesize that machine learning-based algorithms may enable a more quantitative, objective approach. Testing and validation was performed with two algorithms that can automatically delineate the DEJ in RCM stacks of normal human skin. The test set was composed of 15 fair and 15 dark skin stacks (30 subjects) with expert labellings. In dark skin, in which the contrast is high due to melanin, the algorithm produced an average error of 7.9±6.4 μm. In fair skin, the algorithm delineated the DEJ as a transition zone, with average error of 8.3±5.8 μm for the epidermis-to-transition zone boundary and 7.6±5.6 μm for the transition zone-to-dermis. Our results suggest that automated algorithms may quantitatively guide the delineation of the DEJ, to assist in objective reading of RCM images. Further development of such algorithms may guide assessment of abnormal morphological features at the DEJ.
A.G. Landge, V. Pascucci, A. Gyulassy, J.C. Bennett, H. Kolla, J. Chen, P.-T. Bremer.
“In-situ feature extraction of large scale combustion simulations using segmented merge trees,” In Proceedings of the International Conference for High Performance Computing, Networking, Storage and Analysis (SC 2014), New Orleans, Louisana, IEEE Press, Piscataway, NJ, USA pp. 1020--1031. 2014.
ISBN: 978-1-4799-5500-8
DOI: 10.1109/SC.2014.88
The ever increasing amount of data generated by scientific simulations coupled with system I/O constraints are fueling a need for in-situ analysis techniques. Of particular interest are approaches that produce reduced data representations while maintaining the ability to redefine, extract, and study features in a post-process to obtain scientific insights.
This paper presents two variants of in-situ feature extraction techniques using segmented merge trees, which encode a wide range of threshold based features. The first approach is a fast, low communication cost technique that generates an exact solution but has limited scalability. The second is a scalable, local approximation that nevertheless is guaranteed to correctly extract all features up to a predefined size. We demonstrate both variants using some of the largest combustion simulations available on leadership class supercomputers. Our approach allows state-of-the-art, feature-based analysis to be performed in-situ at significantly higher frequency than currently possible and with negligible impact on the overall simulation runtime.
J.D. Lewis, A.C. Evans, J.R. Pruett, K. Botteron, L. Zwaigenbaum, A. Estes, G. Gerig, L. Collins, P. Kostopoulos, R. McKinstry, S. Dager, S. Paterson, R. Schultz, M. Styner, H. Hazlett, J. Piven, IBIS network.
“Network inefficiencies in autism spectrum disorder at 24 months,” In Translational Psychiatry, Vol. 4, No. 5, Nature Publishing Group, pp. e388. May, 2014.
DOI: 10.1038/tp.2014.24
Autism Spectrum Disorder (ASD) is a developmental disorder defined by behavioural symptoms that emerge during the first years of life. Associated with these symptoms are differences in the structure of a wide array of brain regions, and in the connectivity between these regions. However, the use of cohorts with large age variability and participants past the generally recognized age of onset of the defining behaviours means that many of the reported abnormalities may be a result of cascade effects of developmentally earlier deviations. This study assessed differences in connectivity in ASD at the age at which the defining behaviours first become clear. The participants were 113 24-month-olds at high risk for ASD, 31 of whom were classified as ASD, and 23 typically developing 24-month-olds at low risk for ASD. Utilizing diffusion data to obtain measures of the length and strength of connections between anatomical regions, we performed an analysis of network efficiency. Our results showed significantly decreased local and global efficiency over temporal, parietal, and occipital lobes in high-risk infants classified as ASD, relative to both low- and high-risk infants not classified as ASD. The frontal lobes showed only a reduction in global efficiency in Broca's area. Additionally, these same regions showed an inverse relation between efficiency and symptom severity across the high-risk infants. The results suggest delay or deficits in infants with ASD in the optimization of both local and global aspects of network structure in regions involved in processing auditory and visual stimuli, language, and nonlinguistic social stimuli.
Keywords: autism, infant siblings, connectivity, network analysis, efficiency
A. Lex, N. Gehlenborg, H. Strobelt, R. Vuillemot,, H. Pfister.
“UpSet: Visualization of Intersecting Sets,” In IEEE Transactions on Visualization and Computer Graphics (InfoVis '14), Vol. 20, No. 12, pp. 1983--1992. 2014.
ISSN: 1077-2626
Understanding relationships between sets is an important analysis task that has received widespread attention in the visualization community. The major challenge in this context is the combinatorial explosion of the number of set intersections if the number of sets exceeds a trivial threshold. In this paper we introduce UpSet, a novel visualization technique for the quantitative analysis of sets, their intersections, and aggregates of intersections. UpSet is focused on creating task-driven aggregates, communicating the size and properties of aggregates and intersections, and a duality between the visualization of the elements in a dataset and their set membership. UpSet visualizes set intersections in a matrix layout and introduces aggregates based on groupings and queries. The matrix layout enables the effective representation of associated data, such as the number of elements in the aggregates and intersections, as well as additional summary statistics derived from subset or element attributes. Sorting according to various measures enables a task-driven analysis of relevant intersections and aggregates. The elements represented in the sets and their associated attributes are visualized in a separate view. Queries based on containment in specific intersections, aggregates or driven by attribute filters are propagated between both views. We also introduce several advanced visual encodings and interaction methods to overcome the problems of varying scales and to address scalability. UpSet is web-based and open source. We demonstrate its general utility in multiple use cases from various domains.
W. Liu, S.P. Awate, J.S. Anderson, P.T. Fletcher.
“A functional network estimation method of resting-state fMRI using a hierarchical Markov random field,” In NeuroImage, Vol. 100, pp. 520--534. 2014.
ISSN: 1053-8119
DOI: 10.1016/j.neuroimage.2014.06.001

Keywords: Resting-state functional MRI, Segmentation, Functional connectivity, Hierarchical Markov random field, Bayesian
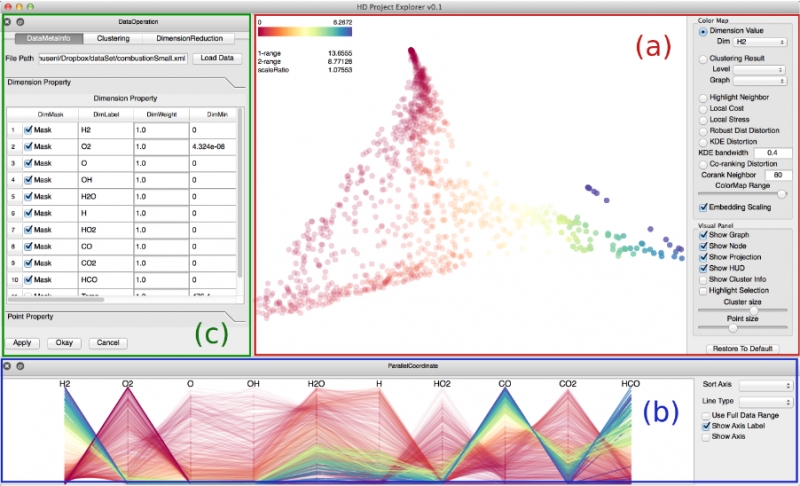
Shusen Liu, Bei Wang, J.J. Thiagarajan, P.-T. Bremer, V. Pascucci.
“Visual Exploration of High-Dimensional Data: Subspace Analysis through Dynamic Projections,” SCI Technical Report, No. UUSCI-2014-003, SCI Institute, University of Utah, 2014.
Understanding high-dimensional data is rapidly becoming a central challenge in many areas of science and engineering. Most current techniques either rely on manifold learning based techniques which typically create a single embedding of the data or on subspace selection to find subsets of the original attributes that highlight the structure. However, the former creates a single, difficult-to-interpret view and assumes the data to be drawn from a single manifold, while the latter is limited to axis-aligned projections with restrictive viewing angles. Instead, we introduce ideas based on subspace clustering that can faithfully represent more complex data than the axis-aligned projections, yet do not assume the data to lie on a single manifold. In particular, subspace clustering assumes that the data can be represented by a union of low-dimensional subspaces, which can subsequently be used for analysis and visualization. In this paper, we introduce new techniques to reliably estimate both the intrinsic dimension and the linear basis of a mixture of subspaces extracted through subspace clustering. We show that the resulting bases represent the high-dimensional structures more reliably than traditional approaches. Subsequently, we use the bases to define different “viewpoints”, i.e., different projections onto pairs of basis vectors, from which to visualize the data. While more intuitive than non-linear projections, interpreting linear subspaces in terms of the original dimensions can still be challenging. To address this problem, we present new, animated transitions between different views to help the user navigate and explore the high-dimensional space. More specifically, we introduce the view transition graph which contains nodes for each subspace viewpoint and edges for potential transition between views. The transition graph enables users to explore both the structure within a subspace and the relations between different subspaces, for better understanding of the data. Using a number of case studies on well-know reference datasets, we demonstrate that the interactive exploration through such dynamic projections provides additional insights not readily available from existing tools.
Keywords: High-dimensional data, Subspace, Dynamic projection
S. Liu, Bei Wang, P.-T. Bremer, V. Pascucci.
“Distortion-Guided Structure-Driven Interactive Exploration of High-Dimensional Data,” In Computer Graphics Forum, Vol. 33, No. 3, Wiley-Blackwell, pp. 101--110. June, 2014.
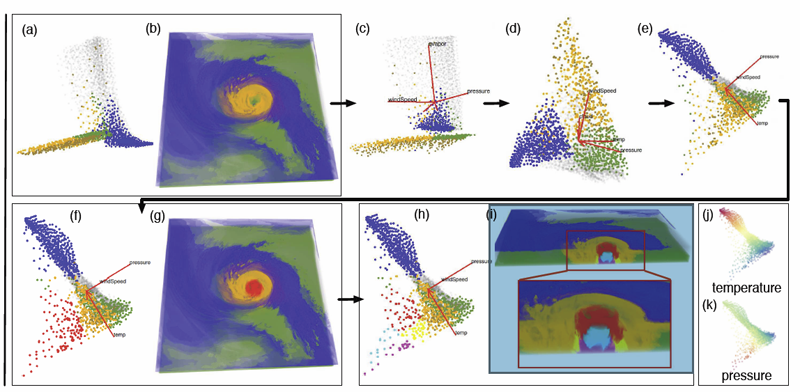
Shusen Liu, Bei Wang, J.J. Thiagarajan, P.-T. Bremer, V. Pascucci.
“Multivariate Volume Visualization through Dynamic Projections,” In Proceedings of the IEEE Symposium on Large Data Analysis and Visualization (LDAV), 2014.
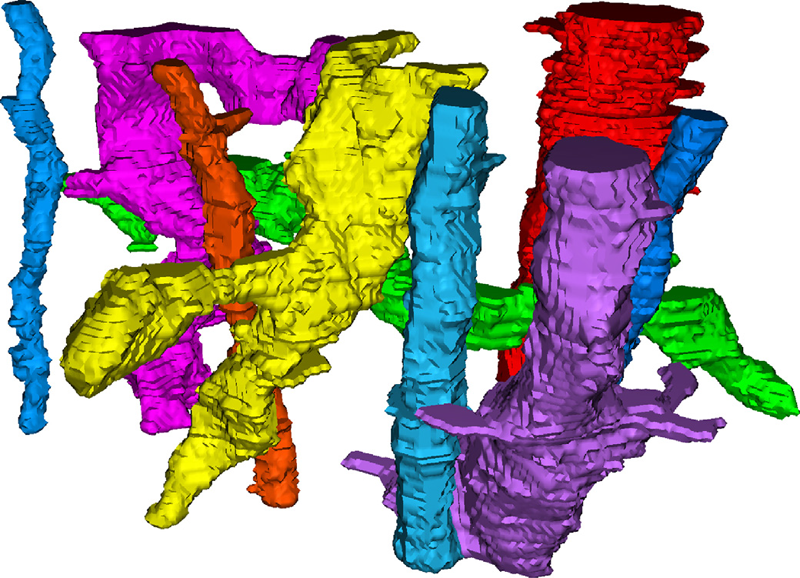
T. Liu, C. Jones, M. Seyedhosseini, T. Tasdizen.
“A modular hierarchical approach to 3D electron microscopy image segmentation,” In Journal of Neuroscience Methods, Vol. 226, No. 15, pp. 88--102. April, 2014.
DOI: 10.1016/j.jneumeth.2014.01.022
Keywords: Image segmentation, Electron microscopy, Hierarchical segmentation, Semi-automatic segmentation, Neuron reconstruction
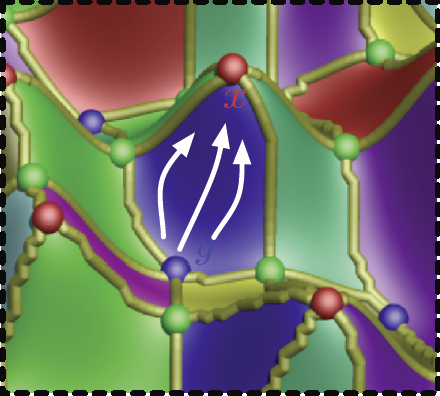
D. Maljovec, Bei Wang, J. Moeller, V. Pascucci.
“Topology-Based Active Learning,” SCI Technical Report, No. UUSCI-2014-001, SCI Institute, University of Utah, 2014.
D. Maljovec, S. Liu, Bei Wang, V. Pascucci, P.-T. Bremer, D. Mandelli, C. Smith.
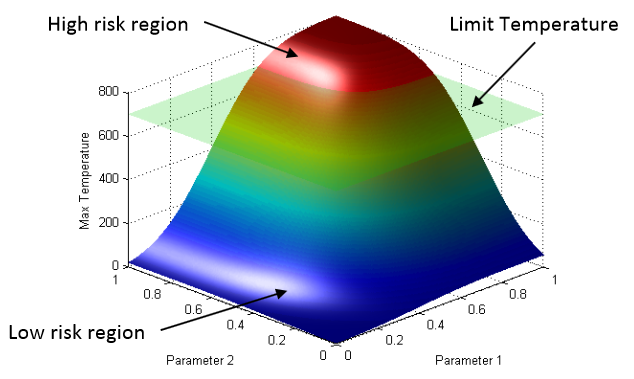
“Analyzing Simulation-Based PRA Data Through Clustering: a BWR Station Blackout Case Study,” In Proceedings of the Probabilistic Safety Assessment & Management conference (PSAM), 2014.
Keywords: PRA, computational topology, clustering, high-dimensional analysis
D. Mandelli, C. Smith, T. Riley, J. Nielsen, J. Schroeder, C. Rabiti, A. Alfonsi, J. Cogliati, R. Kinoshita, V. Pascucci, Bei Wang, D. Maljovec.
“Overview of New Tools to Perform Safety Analysis: BWR Station Black Out Test Case,” In Proceedings of the Probabilistic Safety Assessment & Management conference (PSAM), 2014.
C. McGann, N. Akoum, A. Patel, E. Kholmovski, P. Revelo, K. Damal, B. Wilson, J. Cates, A. Harrison, R. Ranjan, N.S. Burgon, T. Greene, D. Kim, E.V. Dibella, D. Parker, R.S. MacLeod, N.F. Marrouche.
“Atrial fibrillation ablation outcome is predicted by left atrial remodeling on MRI,” In Circ Arrhythm Electrophysiol, Vol. 7, No. 1, pp. 23--30. 2014.
DOI: 10.1161/CIRCEP.113.000689
PubMed ID: 24363354
BACKGROUND:
Although catheter ablation therapy for atrial fibrillation (AF) is becoming more common, results vary widely, and patient selection criteria remain poorly defined. We hypothesized that late gadolinium enhancement MRI (LGE-MRI) can identify left atrial (LA) wall structural remodeling (SRM) and stratify patients who are likely or not to benefit from ablation therapy.
LGE-MRI was performed on 426 consecutive patients with AF without contraindications to MRI before undergoing their first ablation procedure and on 21 non-AF control subjects. Patients were categorized by SRM stage (I-IV) based on the percentage of LA wall enhancement for correlation with procedure outcomes. Histological validation of SRM was performed comparing LGE-MRI with surgical biopsy. A total of 386 patients (91%) with adequate LGE-MRI scans were included in the study. After ablation, 123 patients (31.9%) experienced recurrent atrial arrhythmias during the 1-year follow-up. Recurrent arrhythmias (failed ablations) occurred at higher SRM stages with 28 of 133 (21.0%) in stage I, 40 of 140 (29.3%) in stage II, 24 of 71 (33.8%) in stage III, and 30 of 42 (71.4%) in stage IV. In multivariate analysis, ablation outcome was best predicted by advanced SRM stage (hazard ratio, 4.89; P
G. McInerny, M. Chen, R. Freeman, D. Gavaghan, M.D. Meyer, F. Rowland, D. Spiegelhalter, M. Steganer, G. Tessarolo, J. Hortal.
“Information Visualization for Science and Policy: Engaging Users and Avoiding Bias,” In Trends in Ecology & Evolution, Vol. 29, No. 3, pp. 148--157. 2014.
DOI: 10.1016/j.tree.2014.01.003

S. McKenna, D. Mazur, J. Agutter, M.D. Meyer.
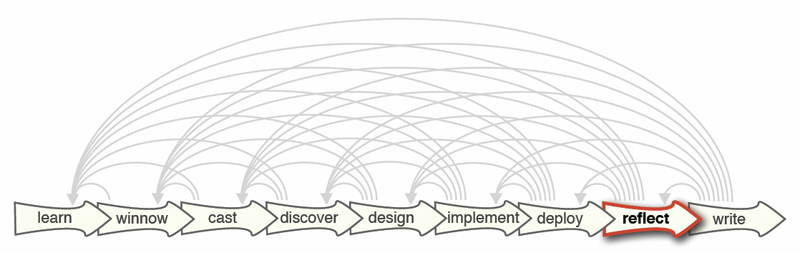
“Design Activity Framework for Visualization Design,” In IEEE Transactions on Visualization and Computer Graphics (TVCG), 2014.
Keywords: Design, frameworks, process, cybersecurity, nested model, decisions, models, evaluation, visualization
Q. Meng, M. Berzins.
“Scalable large-scale fluid-structure interaction solvers in the Uintah framework via hybrid task-based parallelism algorithms,” In Concurrency and Computation: Practice and Experience, Vol. 26, No. 7, pp. 1388--1407. May, 2014.
DOI: 10.1002/cpe
Uintah is a software framework that provides an environment for solving fluid–structure interaction problems on structured adaptive grids for large-scale science and engineering problems involving the solution of partial differential equations. Uintah uses a combination of fluid flow solvers and particle-based methods for solids, together with adaptive meshing and a novel asynchronous task-based approach with fully automated load balancing. When applying Uintah to fluid–structure interaction problems, the combination of adaptive mesh- ing and the movement of structures through space present a formidable challenge in terms of achieving scalability on large-scale parallel computers. The Uintah approach to the growth of the number of core counts per socket together with the prospect of less memory per core is to adopt a model that uses MPI to communicate between nodes and a shared memory model on-node so as to achieve scalability on large-scale systems. For this approach to be successful, it is necessary to design data structures that large numbers of cores can simultaneously access without contention. This scalability challenge is addressed here for Uintah, by the development of new hybrid runtime and scheduling algorithms combined with novel lock-free data structures, making it possible for Uintah to achieve excellent scalability for a challenging fluid–structure problem with mesh refinement on as many as 260K cores.
Keywords: MPI, threads, Uintah, many core, lock free, fluid-structure interaction, c-safe
Qingyu Meng.
“Large-Scale Distributed Runtime System for DAG-Based Computational Framework,” Note: Ph.D. in Computer Science, advisor Martin Berzins, School of Computing, University of Utah, August, 2014.
Recent trends in high performance computing present larger and more diverse computers using multicore nodes possibly with accelerators and/or coprocessors and reduced memory. These changes pose formidable challenges for applications code to attain scalability. Software frameworks that execute machine-independent applications code using a runtime system that shields users from architectural complexities offer a portable solution for easy programming. The Uintah framework, for example, solves a broad class of large-scale problems on structured adaptive grids using fluid-flow solvers coupled with particle-based solids methods. However, the original Uintah code had limited scalability as tasks were run in a predefined order based solely on static analysis of the task graph and used only message passing interface (MPI) for parallelism. By using a new hybrid multithread and MPI runtime system, this research has made it possible for Uintah to scale to 700K central processing unit (CPU) cores when solving challenging fluid-structure interaction problems. Those problems often involve moving objects with adaptive mesh refinement and thus with highly variable and unpredictable work patterns. This research has also demonstrated an ability to run capability jobs on the heterogeneous systems with Nvidia graphics processing unit (GPU) accelerators or Intel Xeon Phi coprocessors. The new runtime system for Uintah executes directed acyclic graphs of computational tasks with a scalable asynchronous and dynamic runtime system for multicore CPUs and/or accelerators/coprocessors on a node. Uintah's clear separation between application and runtime code has led to scalability increases without significant changes to application code. This research concludes that the adaptive directed acyclic graph (DAG)-based approach provides a very powerful abstraction for solving challenging multiscale multiphysics engineering problems. Excellent scalability with regard to the different processors and communications performance are achieved on some of the largest and most powerful computers available today.
J. Mercer, B. Pandian, A. Lex, N. Bonneel,, H. Pfister.
“Mu-8: Visualizing Differences between Proteins and their Families ,” In BMC Proceedings, Vol. 8, No. Suppl 2, pp. S5. Aug, 2014.
ISSN: 1753-6561
DOI: 10.1186/1753-6561-8-S2-S5
A complete understanding of the relationship between the amino acid sequence and resulting protein function remains an open problem in the biophysical sciences. Current approaches often rely on diagnosing functionally relevant mutations by determining whether an amino acid frequently occurs at a specific position within the protein family. However, these methods do not account for the biophysical properties and the 3D structure of the protein. We have developed an interactive visualization technique, Mu-8, that provides researchers with a holistic view of the differences of a selected protein with respect to a family of homologous proteins. Mu-8 helps to identify areas of the protein that exhibit: (1) significantly different bio-chemical characteristics, (2) relative conservation in the family, and (3) proximity to other regions that have suspect behavior in the folded protein.
M.D. Meyer, M. Sedlmair, P.S. Quinan, T. Munzner.
“The Nested Blocks and Guidelines Model,” In Journal of Information Visualization, Special Issue on Evaluation (BELIV), 2014.
M. Milanič, V. Jazbinšek, R.S. MacLeod, D.H. Brooks, R. Hren.
“Assessment of regularization techniques for electrocardiographic imaging,” In Journal of electrocardiology, Vol. 47, No. 1, pp. 20--28. 2014.
DOI: 10.1016/j.jelectrocard.2013.10.004
A widely used approach to solving the inverse problem in electrocardiography involves computing potentials on the epicardium from measured electrocardiograms (ECGs) on the torso surface. The main challenge of solving this electrocardiographic imaging (ECGI) problem lies in its intrinsic ill-posedness. While many regularization techniques have been developed to control wild oscillations of the solution, the choice of proper regularization methods for obtaining clinically acceptable solutions is still a subject of ongoing research. However there has been little rigorous comparison across methods proposed by different groups. This study systematically compared various regularization techniques for solving the ECGI problem under a unified simulation framework, consisting of both 1) progressively more complex idealized source models (from single dipole to triplet of dipoles), and 2) an electrolytic human torso tank containing a live canine heart, with the cardiac source being modeled by potentials measured on a cylindrical cage placed around the heart. We tested 13 different regularization techniques to solve the inverse problem of recovering epicardial potentials, and found that non-quadratic methods (total variation algorithms) and first-order and second-order Tikhonov regularizations outperformed other methodologies and resulted in similar average reconstruction errors.