SCI Publications
2014


L. Zhou, C.D. Hansen.
“GuideME: Slice-guided Semiautomatic Multivariate Exploration of Volumes,” In Computer Graphics Forum, Vol. 33, No. 3, Wiley-Blackwell, pp. 151--160. jun, 2014.
DOI: 10.1111/cgf.12371
ABSTRACT
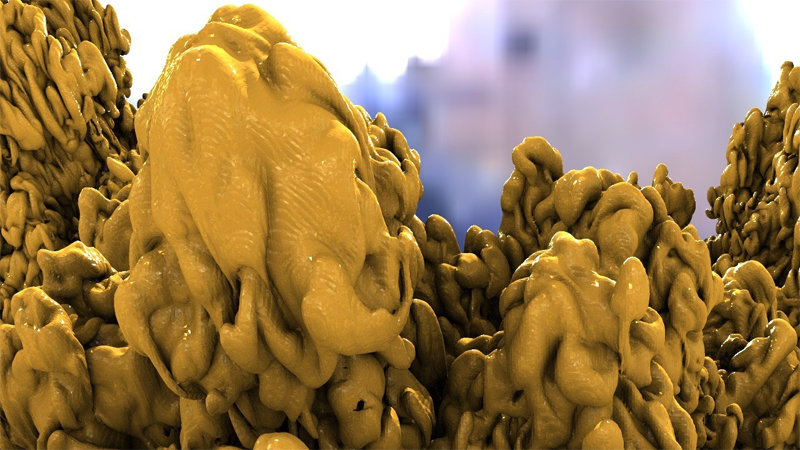
Multivariate volume visualization is important for many applications including petroleum exploration and medicine. State-of-the-art tools allow users to interactively explore volumes with multiple linked parameter-space views. However, interactions in the parameter space using trial-and-error may be unintuitive and time consuming. Furthermore, switching between different views may be distracting. In this paper, we propose GuideME: a novel slice-guided semiautomatic multivariate volume exploration approach. Specifically, the approach comprises four stages: attribute inspection, guided uncertainty-aware lasso creation, automated feature extraction and optional spatial fine tuning and visualization. Throughout the exploration process, the user does not need to interact with the parameter views at all and examples of complex real-world data demonstrate the usefulness, efficiency and ease-of-use of our method.
B.A. Zielinski, M.B.D. Prigge, J.A. Nielsen, A.L. Froehlich, T.J. Abildskov, J.S. Anderson, P.T. Fletcher, K.M. Zygmunt, B.G. Travers, N. Lange, A.L. Alexander, E.D. Bigler, J.E. Lainhart.
“Longitudinal changes in cortical thickness in autism and typical development,” In Brain, Vol. 137, No. 6, Edited by Dimitri M. Kullmann, pp. 1799--1812. 2014.
DOI: 10.1093/brain/awu083
ABSTRACT
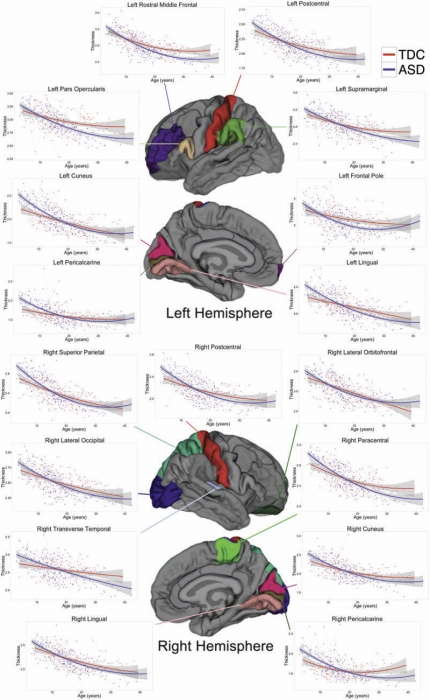
The natural history of brain growth in autism spectrum disorders remains unclear. Cross-sectional studies have identified regional abnormalities in brain volume and cortical thickness in autism, although substantial discrepancies have been reported. Preliminary longitudinal studies using two time points and small samples have identified specific regional differences in cortical thickness in the disorder. To clarify age-related trajectories of cortical development, we examined longitudinal changes in cortical thickness within a large mixed cross-sectional and longitudinal sample of autistic subjects and age- and gender-matched typically developing controls. Three hundred and forty-five magnetic resonance imaging scans were examined from 97 males with autism (mean age = 16.8 years; range 3-36 years) and 60 males with typical development (mean age = 18 years; range 4-39 years), with an average interscan interval of 2.6 years. FreeSurfer image analysis software was used to parcellate the cortex into 34 regions of interest per hemisphere and to calculate mean cortical thickness for each region. Longitudinal linear mixed effects models were used to further characterize these findings and identify regions with between-group differences in longitudinal age-related trajectories. Using mean age at time of first scan as a reference (15 years), differences were observed in bilateral inferior frontal gyrus, pars opercularis and pars triangularis, right caudal middle frontal and left rostral middle frontal regions, and left frontal pole. However, group differences in cortical thickness varied by developmental stage, and were influenced by IQ. Differences in age-related trajectories emerged in bilateral parietal and occipital regions (postcentral gyrus, cuneus, lingual gyrus, pericalcarine cortex), left frontal regions (pars opercularis, rostral middle frontal and frontal pole), left supramarginal gyrus, and right transverse temporal gyrus, superior parietal lobule, and paracentral, lateral orbitofrontal, and lateral occipital regions. We suggest that abnormal cortical development in autism spectrum disorders undergoes three distinct phases: accelerated expansion in early childhood, accelerated thinning in later childhood and adolescence, and decelerated thinning in early adulthood. Moreover, cortical thickness abnormalities in autism spectrum disorders are region-specific, vary with age, and may remain dynamic well into adulthood.
2013
A. Abdul-Rahman, J. Lein, K. Coles, E. Maguire, M.D. Meyer, M. Wynne, C.R. Johnson, A. Trefethen, M. Chen.
“Rule-based Visual Mappings - with a Case Study on Poetry Visualization,” In Proceedings of the 2013 Eurographics Conference on Visualization (EuroVis), Vol. 32, No. 3, pp. 381--390. June, 2013.
ABSTRACT
In this paper, we present a user-centered design study on poetry visualization. We develop a rule-based solution to address the conflicting needs for maintaining the flexibility of visualizing a large set of poetic variables and for reducing the tedium and cognitive load in interacting with the visual mapping control panel. We adopt Munzner's nested design model to maintain high-level interactions with the end users in a closed loop. In addition, we examine three design options for alleviating the difficulty in visualizing poems latitudinally. We present several example uses of poetry visualization in scholarly research on poetry.
C.L. Abraham, S.A. Maas, J.A. Weiss, B.J. Ellis, C.L. Peters, A.E. Anderson.
“A new discrete element analysis method for predicting hip joint contact stresses,” In Journal of Biomechanics, Vol. 46, No. 6, pp. 1121--1127. 2013.
DOI: 10.1016/j.jbiomech.2013.01.012
ABSTRACT
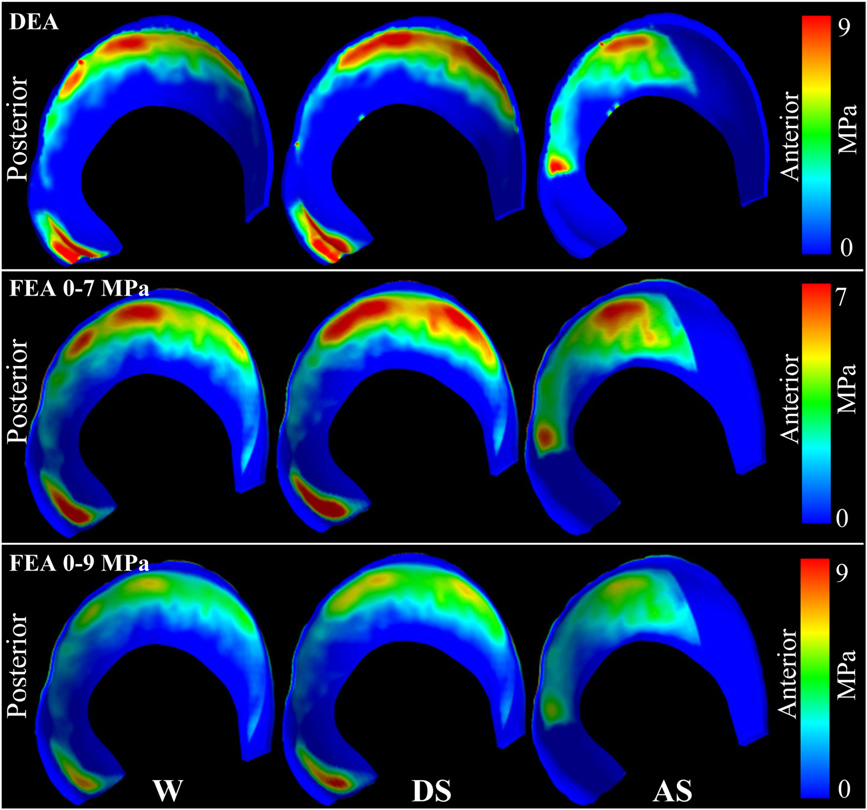
Quantifying cartilage contact stress is paramount to understanding hip osteoarthritis. Discrete element analysis (DEA) is a computationally efficient method to estimate cartilage contact stresses. Previous applications of DEA have underestimated cartilage stresses and yielded unrealistic contact patterns because they assumed constant cartilage thickness and/or concentric joint geometry. The study objectives were to: (1) develop a DEA model of the hip joint with subject-specific bone and cartilage geometry, (2) validate the DEA model by comparing DEA predictions to those of a validated finite element analysis (FEA) model, and (3) verify both the DEA and FEA models with a linear-elastic boundary value problem. Springs representing cartilage in the DEA model were given lengths equivalent to the sum of acetabular and femoral cartilage thickness and gap distance in the FEA model. Material properties and boundary/loading conditions were equivalent. Walking, descending, and ascending stairs were simulated. Solution times for DEA and FEA models were ∼7 s and ∼65 min, respectively. Irregular, complex contact patterns predicted by DEA were in excellent agreement with FEA. DEA contact areas were 7.5%, 9.7% and 3.7% less than FEA for walking, descending stairs, and ascending stairs, respectively. DEA models predicted higher peak contact stresses (9.8–13.6 MPa) and average contact stresses (3.0–3.7 MPa) than FEA (6.2–9.8 and 2.0–2.5 MPa, respectively). DEA overestimated stresses due to the absence of the Poisson's effect and a direct contact interface between cartilage layers. Nevertheless, DEA predicted realistic contact patterns when subject-specific bone geometry and cartilage thickness were used. This DEA method may have application as an alternative to FEA for pre-operative planning of joint-preserving surgery such as acetabular reorientation during peri-acetabular osteotomy.
E.W. Anderson, C. Chong, G.A. Preston, C.T. Silva.
“Discovering and Visualizing Patterns in EEG Data,” In Proceedings of the 2013 IEEE Pacific Visualization Symposium (PacificVis), pp. 105--112. 2013.
ABSTRACT
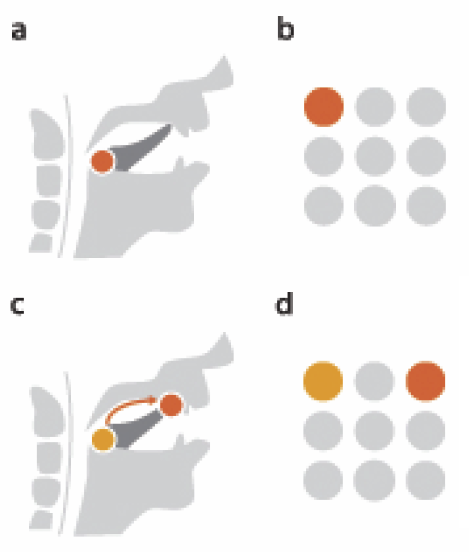
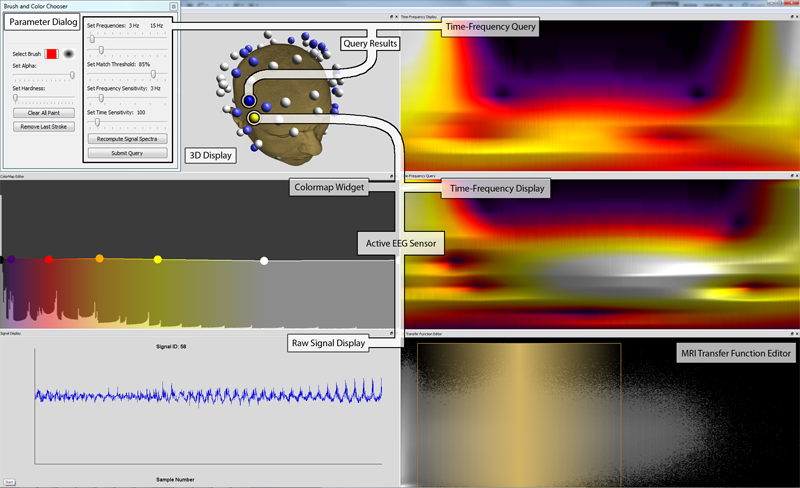
Brain activity data is often collected through the use of electroencephalography (EEG). In this data acquisition modality, the electric fields generated by neurons are measured at the scalp. Although this technology is capable of measuring activity from a group of neurons, recent efforts provide evidence that these small neuronal collections communicate with other, distant assemblies in the brain's cortex. These collaborative neural assemblies are often found by examining the EEG record to find shared activity patterns.
In this paper, we present a system that focuses on extracting and visualizing potential neural activity patterns directly from EEG data. Using our system, neuroscientists may investigate the spectral dynamics of signals generated by individual electrodes or groups of sensors. Additionally, users may interactively generate queries which are processed to reveal which areas of the brain may exhibit common activation patterns across time and frequency. The utility of this system is highlighted in a case study in which it is used to analyze EEG data collected during a working memory experiment.
J.S. Anderson, J.A. Nielsen, M.A. Ferguson, M.C. Burback, E.T. Cox, L. Dai, G. Gerig, J.O. Edgin, J.R. Korenberg.
“Abnormal brain synchrony in Down Syndrome,” In NeuroImage: Clinical, Vol. 2, pp. 703--715. 2013.
ISSN: 2213-1582
DOI: 10.1016/j.nicl.2013.05.006
ABSTRACT
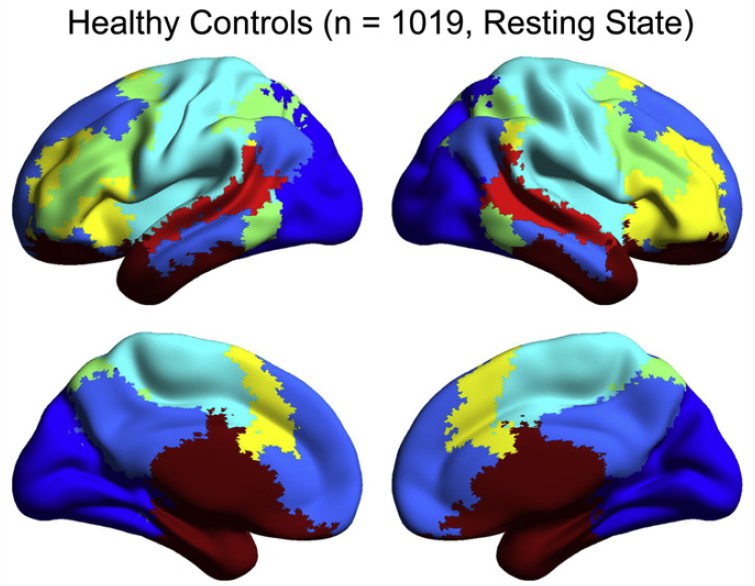
Down Syndrome is the most common genetic cause for intellectual disability, yet the pathophysiology of cognitive impairment in Down Syndrome is unknown. We compared fMRI scans of 15 individuals with Down Syndrome to 14 typically developing control subjects while they viewed 50 min of cartoon video clips. There was widespread increased synchrony between brain regions, with only a small subset of strong, distant connections showing underconnectivity in Down Syndrome. Brain regions showing negative correlations were less anticorrelated and were among the most strongly affected connections in the brain. Increased correlation was observed between all of the distributed brain networks studied, with the strongest internetwork correlation in subjects with the lowest performance IQ. A functional parcellation of the brain showed simplified network structure in Down Syndrome organized by local connectivity. Despite increased interregional synchrony, intersubject correlation to the cartoon stimuli was lower in Down Syndrome, indicating that increased synchrony had a temporal pattern that was not in response to environmental stimuli, but idiosyncratic to each Down Syndrome subject. Short-range, increased synchrony was not observed in a comparison sample of 447 autism vs. 517 control subjects from the Autism Brain Imaging Exchange (ABIDE) collection of resting state fMRI data, and increased internetwork synchrony was only observed between the default mode and attentional networks in autism. These findings suggest immature development of connectivity in Down Syndrome with impaired ability to integrate information from distant brain regions into coherent distributed networks.
J. Beckvermit, J. Peterson, T. Harman, S. Bardenhagen, C. Wight, Q. Meng, M. Berzins.
“Multiscale Modeling of Accidental Explosions and Detonations,” In Computing in Science and Engineering, Vol. 15, No. 4, pp. 76--86. 2013.
DOI: 10.1109/MCSE.2013.89
ABSTRACT
Accidental explosions are exceptionally dangerous and costly, both in lives and money. Regarding world-wide conflict with small arms and light weapons, the Small Arms Survey has recorded over 297 accidental explosions in munitions depots across the world that have resulted in thousands of deaths and billions of dollars in damage in the past decade alone [45]. As the recent fertilizer plant explosion that killed 15 people in West, Texas demonstrates, accidental explosions are not limited to military operations. Transportation accidents also pose risks, as illustrated by the occasional train derailment/explosion in the nightly news, or the semi-truck explosion detailed in the following section. Unlike other industrial accident scenarios, explosions can easily affect the general public, a dramatic example being the PEPCON disaster in 1988, where windows were shattered, doors blown off their hinges, and flying glass and debris caused injuries up to 10 miles away.
While the relative rarity of accidental explosions speaks well of our understanding to date, their violence rightly gives us pause. A better understanding of these materials is clearly still needed, but a significant barrier is the complexity of these materials and the various length scales involved. In typical military applications, explosives are known to be ignited by the coalescence of hot spots which occur on micrometer scales. Whether this reaction remains a deflagration (burning) or builds to a detonation depends both on the stimulus and the boundary conditions or level of confinement. Boundary conditions are typically on the scale of engineered parts, approximately meters. Additional dangers are present at the scale of trucks and factories. The interaction of various entities, such as barrels of fertilizer or crates of detonators, admits the possibility of a sympathetic detonation, i.e. the unintended detonation of one entity by the explosion of another, generally caused by an explosive shock wave or blast fragments.
While experimental work has been and will continue to be critical to developing our fundamental understanding of explosive initiation, de agration and detonation, there is no practical way to comprehensively assess safety on the scale of trucks and factories experimentally. The scenarios are too diverse and the costs too great. Numerical simulation provides a complementary tool that, with the steadily increasing computational power of the past decades, makes simulations at this scale begin to look plausible. Simulations at both the micrometer scale, the "mesoscale", and at the scale of engineered parts, the "macro-scale", have been contributing increasingly to our understanding of these materials. Still, simulations on this scale require both massively parallel computational infrastructure and selective sampling of mesoscale response, i.e. advanced computational tools and modeling. The computational framework Uintah [1] has been developed for exactly this purpose.
Keywords: uintah, c-safe, accidents, explosions, military computing, risk analysis
M. Berzins, J. Schmidt, Q. Meng, A. Humphrey.
“Past, Present, and Future Scalability of the Uintah Software,” In Proceedings of the Blue Waters Extreme Scaling Workshop 2012, pp. Article No.: 6. 2013.
ABSTRACT
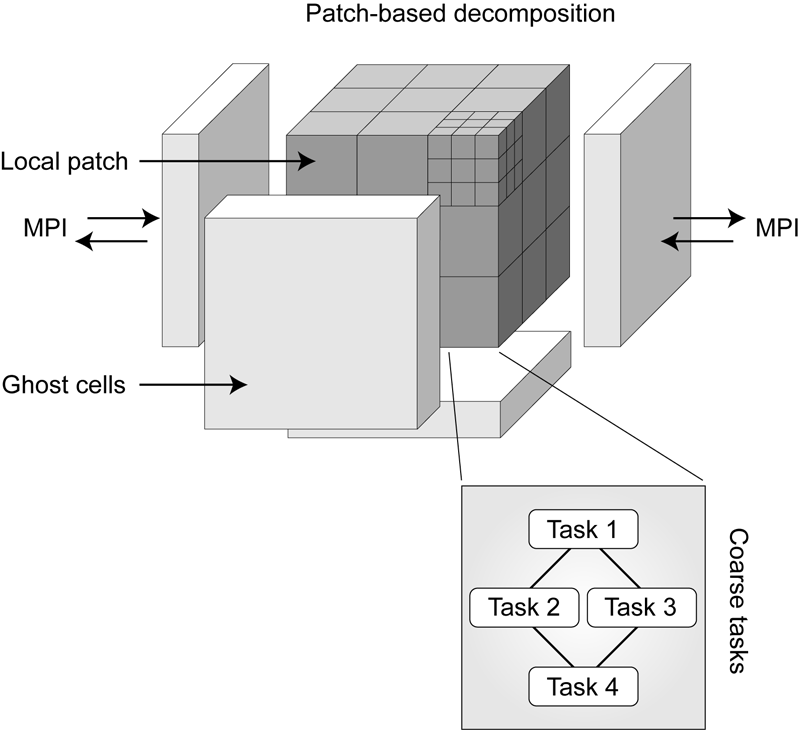
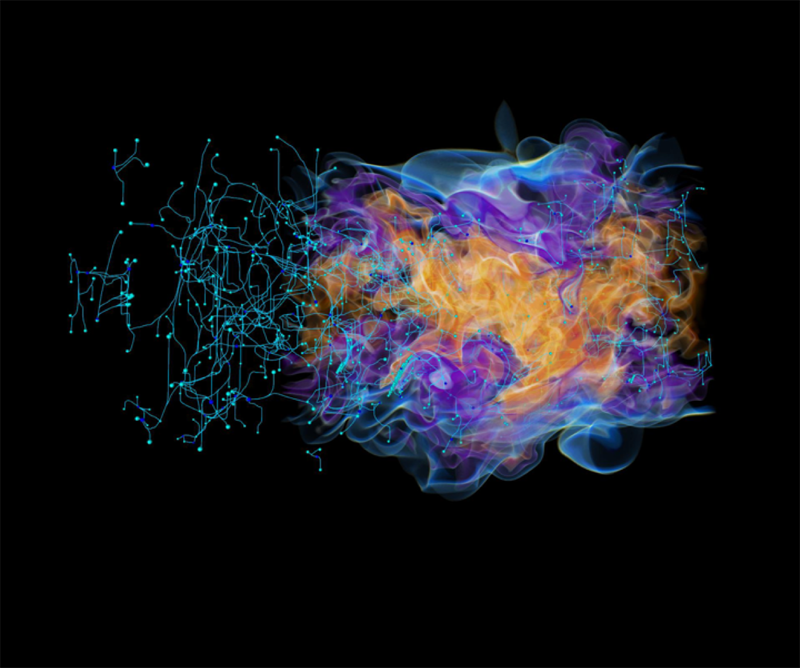
The past, present and future scalability of the Uintah Software framework is considered with the intention of describing a successful approach to large scale parallelism and also considering how this approach may need to be extended for future architectures. Uintah allows the solution of large scale fluid-structure interaction problems through the use of fluid flow solvers coupled with particle-based solids methods. In addition Uintah uses a combustion solver to tackle a broad and challenging class of turbulent combustion problems. A unique feature of Uintah is that it uses an asynchronous task-based approach with automatic load balancing to solve complex problems using techniques such as adaptive mesh refinement. At present, Uintah is able to make full use of present-day massively parallel machines as the result of three phases of development over the past dozen years. These development phases have led to an adaptive scalable run-time system that is capable of independently scheduling tasks to multiple CPUs cores and GPUs on a node. In the case of solving incompressible low-mach number applications it is also necessary to use linear solvers and to consider the challenges of radiation problems. The approaches adopted to achieve present scalability are described and their extensions to possible future architectures is considered.
Keywords: netl, Uintah, parallelism, scalability, adaptive mesh refinement, linear equations
M. Berzins.
“Data and Range-Bounded Polynomials in ENO Methods,” In Journal of Computational Science, Vol. 4, No. 1-2, pp. 62--70. 2013.
DOI: 10.1016/j.jocs.2012.04.006
ABSTRACT
Essentially Non-Oscillatory (ENO) methods and Weighted Essentially Non-Oscillatory (WENO) methods are of fundamental importance in the numerical solution of hyperbolic equations. A key property of such equations is that the solution must remain positive or lie between bounds. A modification of the polynomials used in ENO methods to ensure that the modified polynomials are either bounded by adjacent values (data-bounded) or lie within a specified range (range-bounded) is considered. It is shown that this approach helps both in the range boundedness in the preservation of extrema in the ENO polynomial solution.
N.M. Bertagnolli, J.A. Drake, J.M. Tennessen, O. Alter.
“SVD Identifies Transcript Length Distribution Functions from DNA Microarray Data and Reveals Evolutionary Forces Globally Affecting GBM Metabolism,” In Public Library of Science (PLoS) One, Vol. 8, No. 11, pp. article e78913. November, 2013.
DOI: 10.1371/journal.pone.0078913
ABSTRACT
To search for evolutionary forces that might act upon transcript length, we use the singular value decomposition (SVD) to identify the length distribution functions of sets and subsets of human and yeast transcripts from profiles of mRNA abundance levels across gel electrophoresis migration distances that were previously measured by DNA microarrays. We show that the SVD identifies the transcript length distribution functions as “asymmetric generalized coherent states” from the DNA microarray data and with no a-priori assumptions. Comparing subsets of human and yeast transcripts of the same gene ontology annotations, we find that in both disparate eukaryotes, transcripts involved in protein synthesis or mitochondrial metabolism are significantly shorter than typical, and in particular, significantly shorter than those involved in glucose metabolism. Comparing the subsets of human transcripts that are overexpressed in glioblastoma multiforme (GBM) or normal brain tissue samples from The Cancer Genome Atlas, we find that GBM maintains normal brain overexpression of significantly short transcripts, enriched in transcripts that are involved in protein synthesis or mitochondrial metabolism, but suppresses normal overexpression of significantly longer transcripts, enriched in transcripts that are involved in glucose metabolism and brain activity. These global relations among transcript length, cellular metabolism and tumor development suggest a previously unrecognized physical mode for tumor and normal cells to differentially regulate metabolism in a transcript length-dependent manner. The identified distribution functions support a previous hypothesis from mathematical modeling of evolutionary forces that act upon transcript length in the manner of the restoring force of the harmonic oscillator.
H. Bhatia, G. Norgard, V. Pascucci, P.-T. Bremer.
“The Helmholtz-Hodge Decomposition - A Survey,” In IEEE Transactions on Visualization and Computer Graphics (TVCG), Vol. 19, No. 8, Note: Selected as Spotlight paper for August 2013 issue, pp. 1386--1404. 2013.
DOI: 10.1109/TVCG.2012.316
ABSTRACT
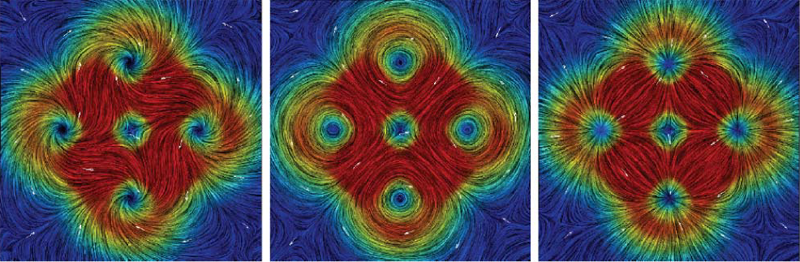
The Helmholtz-Hodge Decomposition (HHD) describes the decomposition of a flow field into its divergence-free and curl-free components. Many researchers in various communities like weather modeling, oceanology, geophysics, and computer graphics are interested in understanding the properties of flow representing physical phenomena such as incompressibility and vorticity. The HHD has proven to be an important tool in the analysis of fluids, making it one of the fundamental theorems in fluid dynamics. The recent advances in the area of flow analysis have led to the application of the HHD in a number of research communities such as flow visualization, topological analysis, imaging, and robotics. However, because the initial body of work, primarily in the physics communities, research on the topic has become fragmented with different communities working largely in isolation often repeating and sometimes contradicting each others results.
H. Bhatia, G. Norgard, V. Pascucci, P.-T. Bremer.
“Comments on the “Meshless Helmholtz-Hodge decomposition”,” In IEEE Transactions on Visualization and Computer Graphics, Vol. 19, No. 3, pp. 527--528. 2013.
DOI: 10.1109/TVCG.2012.62
ABSTRACT
The Helmholtz-Hodge decomposition (HHD) is one of the fundamental theorems of fluids describing the decomposition of a flow field into its divergence-free, curl-free and harmonic components. Solving for an HDD is intimately connected to the choice of boundary conditions which determine the uniqueness and orthogonality of the decomposition. This article points out that one of the boundary conditions used in a recent paper \"Meshless Helmholtz-Hodge decomposition\" [5] is, in general, invalid and provides an analytical example demonstrating the problem. We hope that this clarification on the theory will foster further research in this area and prevent undue problems in applying and extending the original approach.
A. Biglari, T. Saad, J. Sutherland.
“A Time-Accurate Pressure Projection Method for Reacting Flows,” In Proceedings of the SIAM 14th International Conference on Numerical Combustion (NC13), San Antonio, TX, 2013.
C. Brownlee, T. Ize, C.D. Hansen.
“Image-parallel Ray Tracing using OpenGL Interception,” In Proceedings of the Eurographics Symposium on Parallel Graphics and Visualization (EGPGV 2013), pp. 65--72. 2013.
ABSTRACT
CPU Ray tracing in scientific visualization has been shown to be an efficient rendering algorithm for large-scale polygonal data on distributed-memory systems by using custom integrations which modify the source code of existing visualization tools or by using OpenGL interception to run without source code modification to existing tools. Previous implementations in common visualization tools use existing data-parallel work distribution with sort-last compositing algorithms and exhibited sub-optimal performance scaling across multiple nodes due to the inefficiencies of data-parallel distributions of the scene geometry. This paper presents a solution which uses efficient ray tracing through OpenGL interception using an image-parallel work distribution implemented on top of the data-parallel distribution of the host program while supporting a paging system for access to non-resident data. Through a series of scaling studies, we show that using an image-parallel distribution often provides superior scaling performance which is more independent of the data distribution and view, while also supporting secondary rays for advanced rendering effects.
B. Burton, B. Erem, K. Potter, P. Rosen, C.R. Johnson, D. Brooks, R.S. Macleod.
“Uncertainty Visualization in Forward and Inverse Cardiac Models,” In Computing in Cardiology CinC, pp. 57--60. 2013.
ISSN: 2325-8861
ABSTRACT
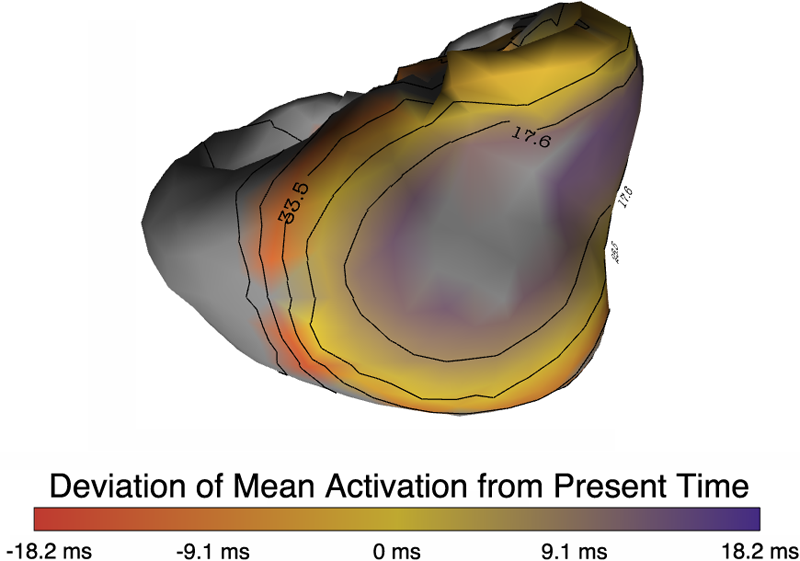
Quantification and visualization of uncertainty in cardiac forward and inverse problems with complex geometries is subject to various challenges. Specific to visualization is the observation that occlusion and clutter obscure important regions of interest, making visual assessment difficult. In order to overcome these limitations in uncertainty visualization, we have developed and implemented a collection of novel approaches. To highlight the utility of these techniques, we evaluated the uncertainty associated with two examples of modeling myocardial activity. In one case we studied cardiac potentials during the repolarization phase as a function of variability in tissue conductivities of the ischemic heart (forward case). In a second case, we evaluated uncertainty in reconstructed activation times on the epicardium resulting from variation in the control parameter of Tikhonov regularization (inverse case). To overcome difficulties associated with uncertainty visualization, we implemented linked-view windows and interactive animation to the two respective cases. Through dimensionality reduction and superimposed mean and standard deviation measures over time, we were able to display key features in large ensembles of data and highlight regions of interest where larger uncertainties exist.
C. Butson, G. Tamm, S. Jain, T. Fogal, J. Krüger.
“Evaluation of Interactive Visualization on Mobile Computing Platforms for Selection of Deep Brain Stimulation Parameters,” In IEEE Transactions on Visualization and Computer Graphics, Vol. 19, No. 1, pp. 108--117. January, 2013.
DOI: 10.1109/TVCG.2012.92
PubMed ID: 22450824
ABSTRACT
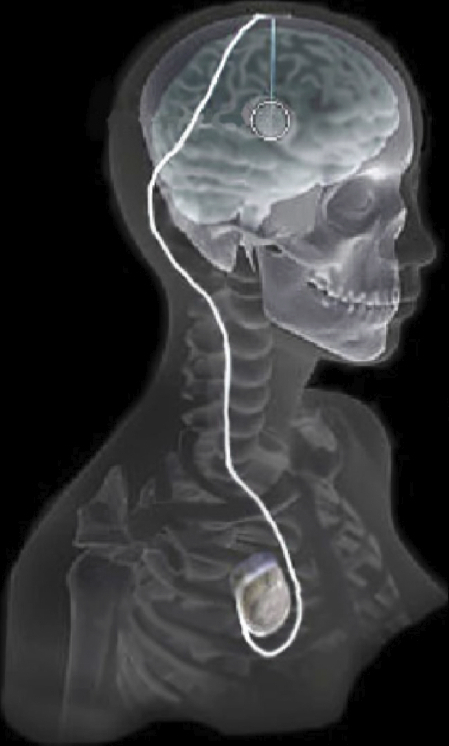
In recent years there has been significant growth in the use of patient-specific models to predict the effects of neuromodulation therapies such as deep brain stimulation (DBS). However, translating these models from a research environment to the everyday clinical workflow has been a challenge, primarily due to the complexity of the models and the expertise required in specialized visualization software. In this paper, we deploy the interactive visualization system ImageVis3D Mobile , which has been designed for mobile computing devices such as the iPhone or iPad, in an evaluation environment to visualize models of Parkinson’s disease patients who received DBS therapy. Selection of DBS settings is a significant clinical challenge that requires repeated revisions to achieve optimal therapeutic response, and is often performed without any visual representation of the stimulation system in the patient. We used ImageVis3D Mobile to provide models to movement disorders clinicians and asked them to use the software to determine: 1) which of the four DBS electrode contacts they would select for therapy; and 2) what stimulation settings they would choose. We compared the stimulation protocol chosen from the software versus the stimulation protocol that was chosen via clinical practice (independently of the study). Lastly, we compared the amount of time required to reach these settings using the software versus the time required through standard practice. We found that the stimulation settings chosen using ImageVis3D Mobile were similar to those used in standard of care, but were selected in drastically less time. We show how our visualization system, available directly at the point of care on a device familiar to the clinician, can be used to guide clinical decision making for selection of DBS settings. In our view, the positive impact of the system could also translate to areas other than DBS.
Keywords: Biomedical and Medical Visualization, Mobile and Ubiquitous Visualization, Computational Model, Clinical Decision Making, Parkinson’s Disease, SciDAC, ImageVis3D
J. Chen, A. Choudhary, S. Feldman, B. Hendrickson, C.R. Johnson, R. Mount, V. Sarkar, V. White, D. Williams.
“Synergistic Challenges in Data-Intensive Science and Exascale Computing,” Note: Summary Report of the Advanced Scientific Computing Advisory Committee (ASCAC) Subcommittee, March, 2013.
ABSTRACT
The ASCAC Subcommittee on Synergistic Challenges in Data-Intensive Science and Exascale Computing has reviewed current practice and future plans in multiple science domains in the context of the challenges facing both Big Data and the Exascale Computing. challenges. The review drew from public presentations, workshop reports and expert testimony. Data-intensive research activities are increasing in all domains of science, and exascale computing is a key enabler of these activities. We briefly summarize below the key findings and recommendations from this report from the perspective of identifying investments that are most likely to positively impact both data-intensive science goals and exascale computing goals.
F. Chen, H. Obermaier, H. Hagen, B. Hamann, J. Tierny, V. Pascucci.
“Topology analysis of time-dependent multi-fluid data using the Reeb graph,” In Computer Aided Geometric Design, Vol. 30, No. 6, pp. 557--566. 2013.
DOI: 10.1016/j.cagd.2012.03.019
ABSTRACT
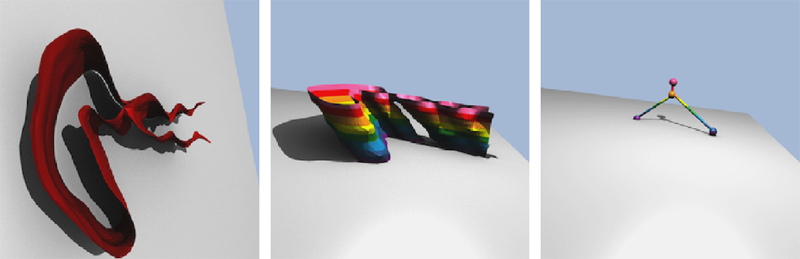
Liquid–liquid extraction is a typical multi-fluid problem in chemical engineering where two types of immiscible fluids are mixed together. Mixing of two-phase fluids results in a time-varying fluid density distribution, quantitatively indicating the presence of liquid phases. For engineers who design extraction devices, it is crucial to understand the density distribution of each fluid, particularly flow regions that have a high concentration of the dispersed phase. The propagation of regions of high density can be studied by examining the topology of isosurfaces of the density data. We present a topology-based approach to track the splitting and merging events of these regions using the Reeb graphs. Time is used as the third dimension in addition to two-dimensional (2D) point-based simulation data. Due to low time resolution of the input data set, a physics-based interpolation scheme is required in order to improve the accuracy of the proposed topology tracking method. The model used for interpolation produces a smooth time-dependent density field by applying Lagrangian-based advection to the given simulated point cloud data, conforming to the physical laws of flow evolution. Using the Reeb graph, the spatial and temporal locations of bifurcation and merging events can be readily identified supporting in-depth analysis of the extraction process.
Keywords: Multi-phase fluid, Level set, Topology method, Point-based multi-fluid simulation
J. Coll-Font, B. Erem, A. Karma, D.H. Brooks.
“An inverse spectral method to localize discordant alternans regions on the heart from body surface measurements,” In Functional Imaging and Modeling of the Heart, pp. 241--248. 2013.
DOI: 10.1007/978-3-642-38899-6_29
ABSTRACT
Spatially discordant T-wave alternans (TWA) has been shown to be linked to the genesis of ventricular fibrillation. Identification of discordant TWA through spatial characterization of TWA patterns in the heart has the potential to improve sudden cardiac death risk stratification. In this paper we present a method to solve a new variant of the inverse problem in electrocardiography that is tailored to estimate the TWA regions on the heart from non-invasive measurements on the body surface. We evaluate our method using both body surface potentials synthesized from heart surface potentials generated with ECGSIM and from potentials measured on a canine heart, and we show that this method detects the main regions in the heart undergoing TWA.
A. Daducci, E.J. Canales-Rodriguez, M. Descoteaux, E. Garyfallidis, Y. Gur, Y.-C Lin, M. Mani, S. Merlet, M. Paquette, A. Ramirez-Manzanares, M. Reisert, P.R. Rodrigues, F. Sepehrband, E. Caruyer, J. Choupan, R. Deriche, M. Jacob, G. Menegaz, V. Prckovska, M. Rivera, Y. Wiaux, J.-P. Thiran.
“Quantitative comparison of reconstruction methods for intra-voxel fiber recovery from diffusion MRI,” In IEEE Transactions on Medical Imaging, Vol. 33, No. 2, pp. 384--399. 2013.
ISSN: 0278-0062
DOI: 10.1109/TMI.2013.2285500
ABSTRACT
Validation is arguably the bottleneck in the diffusion MRI community. This paper evaluates and compares 20 algorithms for recovering the local intra-voxel fiber structure from diffusion MRI data and is based on the results of the "HARDI reconstruction challenge" organized in the context of the "ISBI 2012" conference. Evaluated methods encompass a mixture of classical techniques well-known in the literature such as Diffusion Tensor, Q-Ball and Diffusion Spectrum imaging, algorithms inspired by the recent theory of compressed sensing and also brand new approaches proposed for the first time at this contest. To quantitatively compare the methods under controlled conditions, two datasets with known ground-truth were synthetically generated and two main criteria were used to evaluate the quality of the reconstructions in every voxel: correct assessment of the number of fiber populations and angular accuracy in their orientation. This comparative study investigates the behavior of every algorithm with varying experimental conditions and highlights strengths and weaknesses of each approach.