


SCI Publications
2012


R. Pulch, D. Xiu.
“Generalised Polynomial Chaos for a Class of Linear Conservation Laws,” In Journal of Scientific Computing, Vol. 51, No. 2, pp. 293--312. 2012.
DOI: 10.1007/s10915-011-9511-5
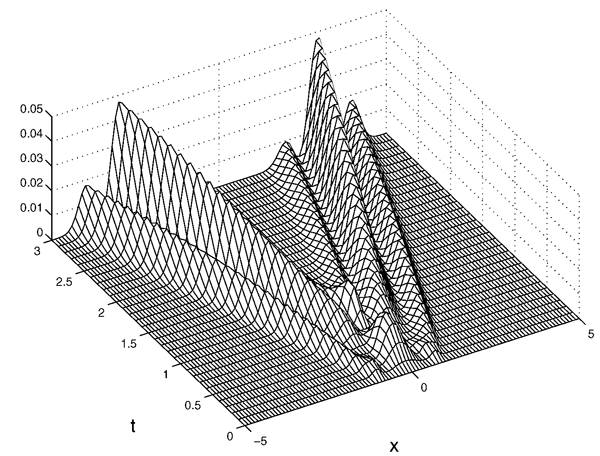
Keywords: Generalised polynomial chaos, Galerkin method, Random parameter, Conservation laws, Hyperbolic systems
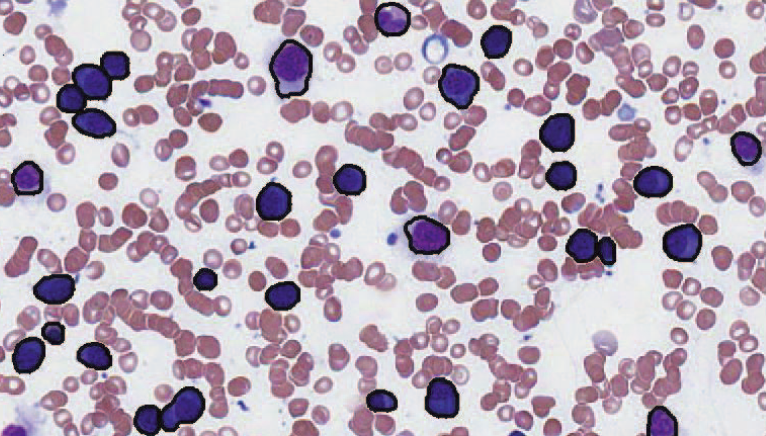
N. Ramesh, B. J. Dangott, M. Salama, T. Tasdizen.
“Segmentation and Two-Step Classification of White Blood Cells in Peripheral Blood Smear,” In Journal of Pathology Informatics, Vol. 3, No. 13, 2012.
An automated system for differential white blood cell (WBC) counting based on morphology can make manual differential leukocyte counts faster and less tedious for pathologists and laboratory professionals. We present an automated system for isolation and classification of WBCs in manually prepared, Wright stained, peripheral blood smears from whole slide images (WSI). Methods: A simple, classification scheme using color information and morphology is proposed. The performance of the algorithm was evaluated by comparing our proposed method with a hematopathologist's visual classification. The isolation algorithm was applied to 1938 subimages of WBCs, 1804 of them were accurately isolated. Then, as the first step of a two-step classification process, WBCs were broadly classified into cells with segmented nuclei and cells with nonsegmented nuclei. The nucleus shape is one of the key factors in deciding how to classify WBCs. Ambiguities associated with connected nuclear lobes are resolved by detecting maximum curvature points and partitioning them using geometric rules. The second step is to define a set of features using the information from the cytoplasm and nuclear regions to classify WBCs using linear discriminant analysis. This two-step classification approach stratifies normal WBC types accurately from a whole slide image. Results: System evaluation is performed using a 10-fold cross-validation technique. Confusion matrix of the classifier is presented to evaluate the accuracy for each type of WBC detection. Experiments show that the two-step classification implemented achieves a 93.9\% overall accuracy in the five subtype classification. Conclusion: Our methodology achieves a semiautomated system for the detection and classification of normal WBCs from scanned WSI. Further studies will be focused on detecting and segmenting abnormal WBCs, comparison of 20x and 40x data, and expanding the applications for bone marrow aspirates.
N. Ramesh, M.E. Salama, T. Tasdizen.
“Segmentation of Haematopoeitic Cells in Bone Marrow Using Circle Detection and Splitting Techniques,” In 9th IEEE International Symposium on Biomedical Imaging (ISBI), pp. 206--209. 2012.
DOI: 10.1109/ISBI.2012.6235520
R. Ranjan, E.G. Kholmovski, J. Blauer, S. Vijayakumar, N.A. Volland, M.E. Salama, D.L. Parker, R.S. MacLeod, N.F. Marrouche.
“Identification and Acute Targeting of Gaps in Atrial Ablation Lesion Sets Using a Real-Time Magnetic Resonance Imaging System,” In Circulation: Arrhythmia and Electrophysiology, Vol. 5, pp. 1130--1135. 2012.
DOI: 10.1161/CIRCEP.112.973164
PubMed ID: 23071143
PubMed Central ID: PMC3691079
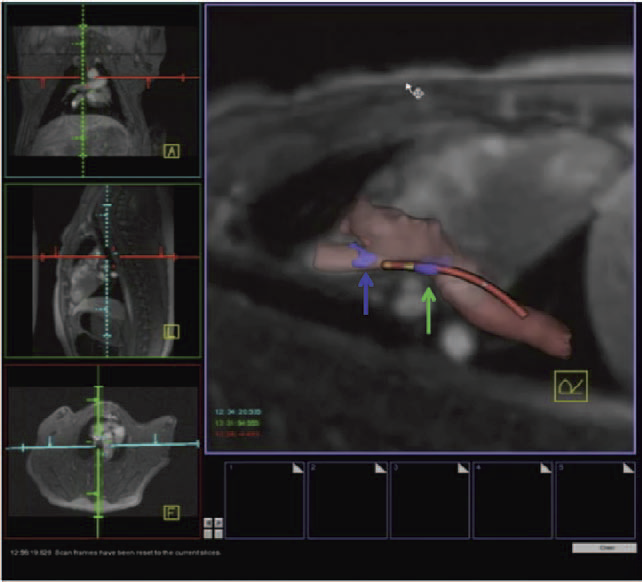
Background - Radiofrequency ablation is routinely used to treat cardiac arrhythmias, but gaps remain in ablation lesion sets because there is no direct visualization of ablation-related changes. In this study, we acutely identify and target gaps using a real-time magnetic resonance imaging (RT-MRI) system, leading to a complete and transmural ablation in the atrium.
Methods and Results - A swine model was used for these studies (n=12). Ablation lesions with a gap were created in the atrium using fluoroscopy and an electroanatomic system in the first group (n=5). The animal was then moved to a 3-tesla MRI system where high-resolution late gadolinium enhancement MRI was used to identify the gap. Using an RT-MRI catheter navigation and visualization system, the gap area was ablated in the MR scanner. In a second group (n=7), ablation lesions with varying gaps in between were created under RT-MRI guidance, and gap lengths determined using late gadolinium enhancement MR images were correlated with gap length measured from gross pathology. Gaps up to 1.0 mm were identified using gross pathology, and gaps up to 1.4 mm were identified using late gadolinium enhancement MRI. Using an RT-MRI system with active catheter navigation gaps can be targeted acutely, leading to lesion sets with no gaps. The correlation coefficient (R2) between the gap length was identified using MRI, and the gross pathology was 0.95.
Conclusions - RT-MRI system can be used to identify and acutely target gaps in atrial ablation lesion sets. Acute targeting of gaps in ablation lesion sets can potentially lead to significant improvement in clinical outcomes.
S.P. Reese.
“Multiscale structure-function relationships in the mechanical behavior of tendon and ligament,” Note: Ph.D. Thesis, Department of Bioengineering, University of Utah, 2012.
P. Rosen, V. Popescu.
“Simplification of Node Position Data for Interactive Visualization of Dynamic Datasets,” In IEEE Transactions on Visualization and Computer Graphics (IEEE Visweek 2012 TVCG Track), pp. 1537--1548. 2012.
PubMed ID: 22025753
PubMed Central ID: PMC3411892
P. Rosen.
“Rectilinear Texture Warping for Fast Adaptive Shadow Mapping,” In Proceedings of the ACM SIGGRAPH Symposium on Interactive 3D Graphics and Games (I3D '12), pp. 151--158. 2012.
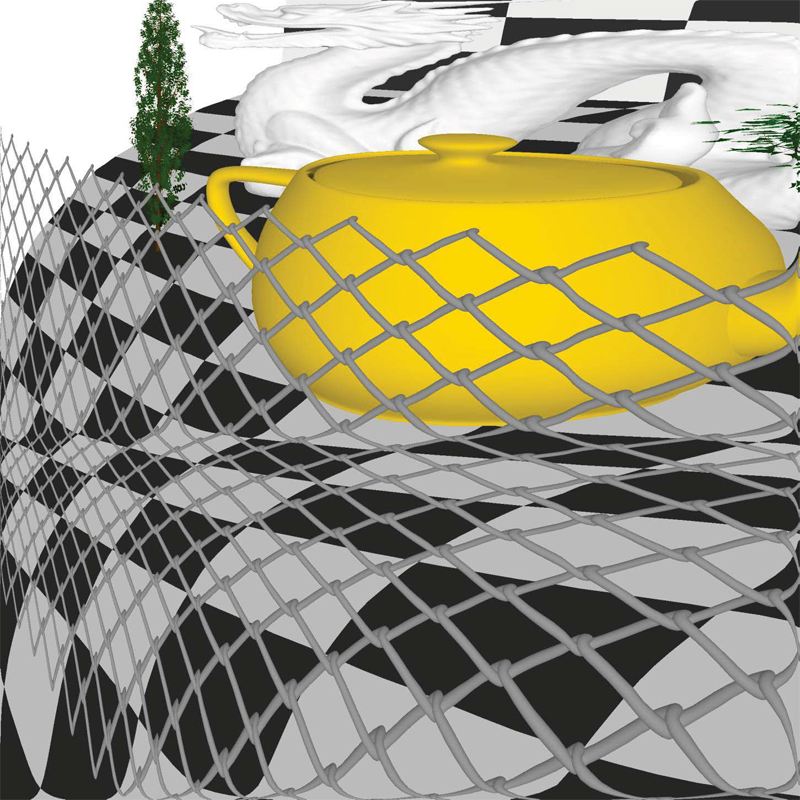
Conventional shadow mapping relies on uniform sampling for producing hard shadow in an efficient manner. This approach trades image quality in favor of efficiency. A number of approaches improve upon shadow mapping by combining multiple shadow maps or using complex data structures to produce shadow maps with multiple resolutions. By sacrificing some performance, these adaptive methods produce shadows that closely match ground truth.
This paper introduces Rectilinear Texture Warping (RTW) for efficiently generating adaptive shadow maps. RTW images combine the advantages of conventional shadow mapping - a single shadow map, quick construction, and constant time pixel shadow tests, with the primary advantage of adaptive techniques - shadow map resolutions which more closely match those requested by output images. RTW images consist of a conventional texture paired with two 1-D warping maps that form a rectilinear grid defining the variation in sampling rate. The quality of shadows produced with RTW shadow maps of standard resolutions, i.e. 2,048×2,048 texture for 1080p output images, approaches that of raytraced results while low overhead permits rendering at hundreds of frames per second.
Keywords: Rendering, Shadow Algorithms, Adaptive Sampling
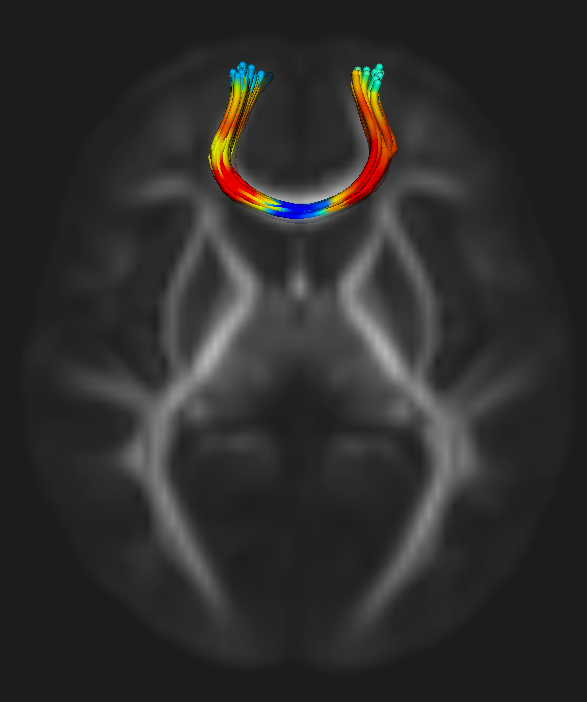
N. Sadeghi, M.W. Prastawa, P.T. Fletcher, J.H. Gilmore, W. Lin, G. Gerig.
“Statistical Growth Modeling of Longitudinal DT-MRI for Regional Characterization of Early Brain Development,” In Proceedings of IEEE ISBI 2012, pp. 1507--1510. 2012.
DOI: 10.1109/ISBI.2012.6235858
A population growth model that represents the growth trajectories of individual subjects is critical to study and understand neurodevelopment. This paper presents a framework for jointly estimating and modeling individual and population growth trajectories, and determining significant regional differences in growth pattern characteristics applied to longitudinal neuroimaging data. We use non-linear mixed effect modeling where temporal change is modeled by the Gompertz function. The Gompertz function uses intuitive parameters related to delay, rate of change, and expected asymptotic value; all descriptive measures which can answer clinical questions related to growth. Our proposed framework combines nonlinear modeling of individual trajectories, population analysis, and testing for regional differences. We apply this framework to the study of early maturation in white matter regions as measured with diffusion tensor imaging (DTI). Regional differences between anatomical regions of interest that are known to mature differently are analyzed and quantified. Experiments with image data from a large ongoing clinical study show that our framework provides descriptive, quantitative information on growth trajectories that can be directly interpreted by clinicians. To our knowledge, this is the first longitudinal analysis of growth functions to explain the trajectory of early brain maturation as it is represented in DTI.
A.R. Sanderson, B. Whitlock, O. Reubel, H. Childs, G.H. Weber, Prabhat, K. Wu.
“A System for Query Based Analysis and Visualization,” In Proceedings of the Third International Eurovis Workshop on Visual Analytics EuroVA 2012, pp. 25--29. June, 2012.
Today scientists are producing large volumes of data that they wish to explore and visualize. In this paper we describe a system that combines range-based queries with fast lookup to allow a scientist to quickly and efficiently ask \"what if?\" questions. Unique to our system is the ability to perform "cumulative queries" that work on both an intra- and inter-time step basis. The results of such queries are visualized as frequency histograms and are the input for secondary queries, the results of which are then visualized.
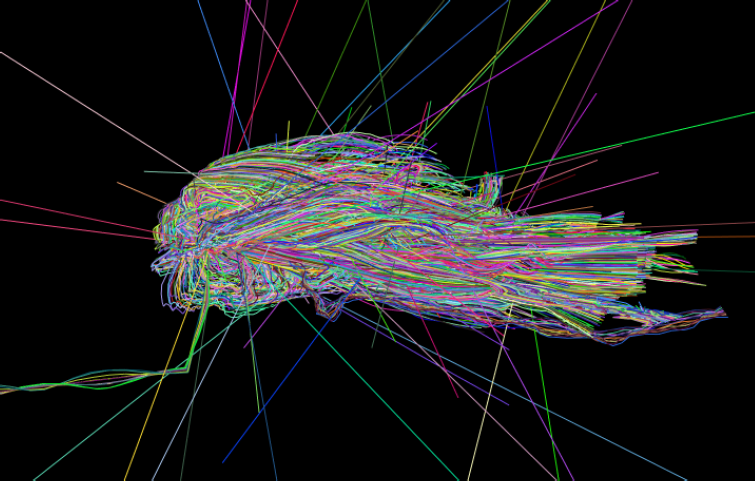
A.R. Sanderson, G. Chen, X. Tricoche, E. Cohen.
“Understanding Quasi-Periodic Fieldlines and Their Topology in Toroidal Magnetic Fields,” In Topological Methods in Data Analysis and Visualization II, Edited by R. Peikert and H. Carr and H. Hauser and R. Fuchs, Springer, pp. 125--140. 2012.
DOI: 10.1007/478-3-642-23175-9
V. Sarkar, Brian Wang, J. Hinkle, V.J. Gonzalez, Y.J. Hitchcock, P. Rassiah-Szegedi, S. Joshi, B.J. Salter.
“Dosimetric evaluation of a virtual image-guidance alternative to explicit 6 degree of freedom robotic couch correction,” In Practical Radiation Oncology, Vol. 2, No. 2, pp. 122--137. 2012.
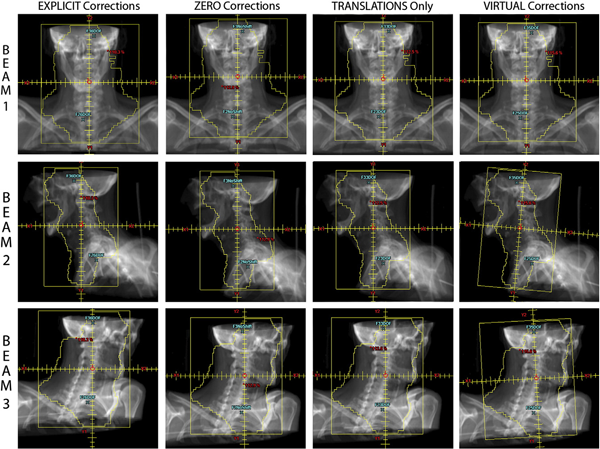
Purpose: Clinical evaluation of a \"virtual\" methodology for providing 6 degrees of freedom (6DOF) patient set-up corrections and comparison to corrections facilitated by a 6DOF robotic couch.
Methods: A total of 55 weekly in-room image-guidance computed tomographic (CT) scans were acquired using a CT-on-rails for 11 pelvic and head and neck cancer patients treated at our facility. Fusion of the CT-of-the-day to the simulation CT allowed prototype virtual 6DOF correction software to calculate the translations, single couch yaw, and beam-specific gantry and collimator rotations necessary to effectively reproduce the same corrections as a 6DOF robotic couch. These corrections were then used to modify the original treatment plan beam geometry and this modified plan geometry was applied to the CT-of-the-day to evaluate the dosimetric effects of the virtual correction method. This virtual correction dosimetry was compared with calculated geometric and dosimetric results for an explicit 6DOF robotic couch correction methodology.
Results: A (2\%, 2mm) gamma analysis comparing dose distributions created using the virtual corrections to those from explicit corrections showed that an average of 95.1\% of all points had a gamma of 1 or less, with a standard deviation of 3.4\%. For a total of 470 dosimetric metrics (ie, maximum and mean dose statistics for all relevant structures) compared for all 55 image-guidance sessions, the average dose difference for these metrics between the plans employing the virtual corrections and the explicit corrections was -0.12\% with a standard deviation of 0.82\%; 97.9\% of all metrics were within 2\%.
Conclusions: Results showed that the virtual corrections yielded dosimetric distributions that were essentially equivalent to those obtained when 6DOF robotic corrections were used, and that always outperformed the most commonly employed clinical approach of 3 translations only. This suggests
M. Schott, T. Martin, A.V.P. Grosset, C. Brownlee, Thomas Hollt, B.P. Brown, S.T. Smith, C.D. Hansen.
“Combined Surface and Volumetric Occlusion Shading,” In Proceedings of Pacific Vis 2012, pp. 169--176. 2012.
DOI: 10.1109/PacificVis.2012.6183588
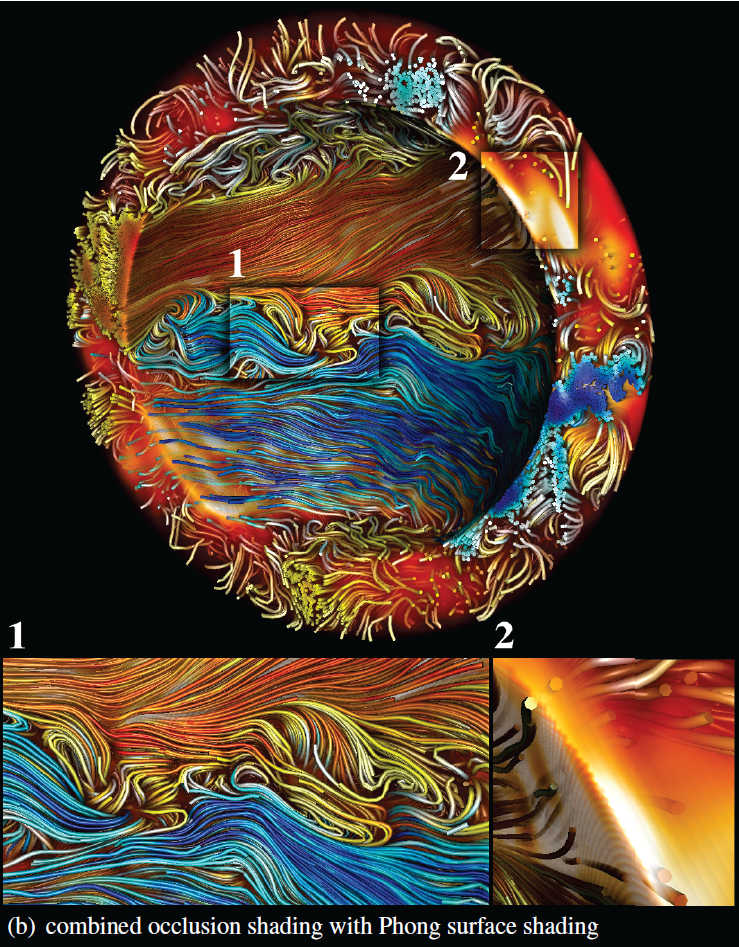
Keywords: scidac, vacet, kaust, nvidia
J. Schmidt, M. Berzins, J. Thornock, T. Saad, J. Sutherland.
“Large Scale Parallel Solution of Incompressible Flow Problems using Uintah and hypre,” SCI Technical Report, No. UUSCI-2012-002, SCI Institute, University of Utah, 2012.
The Uintah Software framework was developed to provide an environment for solving fluid-structure interaction problems on structured adaptive grids on large-scale, long-running, data-intensive problems. Uintah uses a combination of fluid-flow solvers and particle-based methods for solids together with a novel asynchronous task-based approach with fully automated load balancing. As Uintah is often used to solve compressible, low-Mach combustion applications, it is important to have a scalable linear solver. While there are many such solvers available, the scalability of those codes varies greatly. The hypre software offers a range of solvers and pre-conditioners for different types of grids. The weak scalability of Uintah and hypre is addressed for particular examples when applied to an incompressible flow problem relevant to combustion applications. After careful software engineering to reduce start-up costs, much better than expected weak scalability is seen for up to 100K cores on NSFs Kraken architecture and up to 200K+ cores, on DOEs new Titan machine.
Keywords: uintah, csafe
M. Sedlmair, M.D. Meyer, T. Munzner.
“Design Study Methodology: Reflections from the Trenches and the Stacks,” In IEEE Transactions on Visualization and Computer Graphics, Vol. 18, No. 12, Note: Honorable Mention for Best Paper Award., pp. 2431--2440. 2012.
Design studies are an increasingly popular form of problem-driven visualization research, yet there is little guidance available about how to do them effectively. In this paper we reflect on our combined experience of conducting twenty-one design studies, as well as reading and reviewing many more, and on an extensive literature review of other field work methods and methodologies. Based on this foundation we provide definitions, propose a methodological framework, and provide practical guidance for conducting design studies. We define a design study as a project in which visualization researchers analyze a specific real-world problem faced by domain experts, design a visualization system that supports solving this problem, validate the design, and reflect about lessons learned in order to refine visualization design guidelines. We characterize two axes—a task clarity axis from fuzzy to crisp and an information location axis from the domain expert’s head to the computer—and use these axes to reason about design study contributions, their suitability, and uniqueness from other approaches. The proposed methodological framework consists of 9 stages: learn, winnow, cast, discover, design, implement, deploy, reflect, and write. For each stage we provide practical guidance and outline potential pitfalls. We also conducted an extensive literature survey of related methodological approaches that involve a significant amount of qualitative field work, and compare design study methodology to that of ethnography, grounded theory, and action research.
A. Sharma, S. Durrleman, J.H. Gilmore, G. Gerig.
“Longitudinal Growth Modeling of Discrete-Time Functions with Application to DTI Tract Evolution in Early Neurodevelopment,” In Proceedings of IEEE ISBI 2012, pp. 1397--1400. 2012.
DOI: 10.1109/ISBI.2012.6235829
N.P. Singh, A.Y. Wang, P. Sankaranarayanan, P.T. Fletcher, S. Joshi.
“Genetic, Structural and Functional Imaging Biomarkers for Early Detection of Conversion from MCI to AD,” In Proceedings of Medical Image Computing and Computer-Assisted Intervention MICCAI 2012, Vol. 7510, pp. 132--140. 2012.
DOI: 10.1007/978-3-642-33415-3_17
With the advent of advanced imaging techniques, genotyping, and methods to assess clinical and biological progression, there is a growing need for a unified framework that could exploit information available from multiple sources to aid diagnosis and the identification of early signs of Alzheimer’s disease (AD). We propose a modeling strategy using supervised feature extraction to optimally combine highdimensional imaging modalities with several other low-dimensional disease risk factors. The motivation is to discover new imaging biomarkers and use them in conjunction with other known biomarkers for prognosis of individuals at high risk of developing AD. Our framework also has the ability to assess the relative importance of imaging modalities for predicting AD conversion. We evaluate the proposed methodology on the Alzheimer’s Disease Neuroimaging Initiative (ADNI) database to predict conversion of individuals with Mild Cognitive Impairment (MCI) to AD, only using information available at baseline.
Keywords: adni
W.C. Stacey, S. Kellis, P.R. Patel, B. Greger, C.R. Butson.
“Signal distortion from microelectrodes in clinical EEG acquisition systems,” In Journal of Neural Engineering, Vol. 9, No. 5, pp. 056007. October, 2012.
ISSN: 1741-2552
DOI: 10.1088/1741-2560/9/5/056007
PubMed ID: 22878608
M. Streit, H. Schulz, A. Lex, D. Schmalstieg, H. Schumann.
“Model-Driven Design for the Visual Analysis of Heterogeneous Data,” In IEEE Transactions on Visualization and Computer Graphics, Vol. 18, No. 6, IEEE, pp. 998--1010. 2012.
DOI: 10.1109/TVCG.2011.108
As heterogeneous data from different sources are being increasingly linked, it becomes difficult for users to understand how the data are connected, to identify what means are suitable to analyze a given data set, or to find out how to proceed for a given analysis task. We target this challenge with a new model-driven design process that effectively codesigns aspects of data, view, analytics, and tasks. We achieve this by using the workflow of the analysis task as a trajectory through data, interactive views, and analytical processes. The benefits for the analysis session go well beyond the pure selection of appropriate data sets and range from providing orientation or even guidance along a preferred analysis path to a potential overall speedup, allowing data to be fetched ahead of time. We illustrate the design process for a biomedical use case that aims at determining a treatment plan for cancer patients from the visual analysis of a large, heterogeneous clinical data pool. As an example for how to apply the comprehensive design approach, we present Stack'n'flip, a sample implementation which tightly integrates visualizations of the actual data with a map of available data sets, views, and tasks, thus capturing and communicating the analytical workflow through the required data sets.
B. Summa, J. Tierny, V. Pascucci.
“Panorama weaving: fast and flexible seam processing,” In ACM Trans. Graph., Vol. 31, No. 4, Note: ACM ID:2335434, ACM, New York, NY, USA pp. 83:1--83:11. July, 2012.
ISSN: 0730-0301
DOI: 10.1145/2185520.2185579

Keywords: digital panoramas, interactive image boundaries, panorama editing, panorama seams
M. Szegedi, P. Rassiah-Szegedi, V. Sarkar, J. Hinkle, Brian Wang, Y.-H. Huang, H. Zhao, S. Joshi, B.J. Salter.
“Tissue characterization using a phantom to validate four-dimensional tissue deformation,” In Medical Physics, Vol. 39, No. 10, pp. 6065--6070. 2012.
DOI: 10.1118/1.4747528
Purpose: This project proposes using a real tissue phantom for 4D tissue deformation reconstruction (4DTDR) and 4D deformable image registration (DIR) validation, which allows for the complete verification of the motion path rather than limited end-point to end-point of motion.
Methods: Three electro-magnetic-tracking (EMT) fiducials were implanted into fresh porcine liver that was subsequently animated in a clinically realistic phantom. The animation was previously shown to be similar to organ motion, including hysteresis, when driven using a real patient's breathing pattern. For this experiment, 4DCTs and EMT traces were acquired when the phantom was animated using both sinusoidal and recorded patient-breathing traces. Fiducial were masked prior to 4DTDR for reconstruction. The original 4DCT data (with fiducials) were sampled into 20 CT phase sets and fiducials’ coordinates were recorded, resulting in time-resolved fiducial motion paths. Measured values of fiducial location were compared to EMT measured traces and the result calculated by 4DTDR.
Results: For the sinusoidal breathing trace, 95\% of EMT measured locations were within 1.2 mm of the measured 4DCT motion path, allowing for repeatable accurate motion characterization. The 4DTDR traces matched 95\% of the EMT trace within 1.6 mm. Using the more irregular (in amplitude and frequency) patient trace, 95\% of the EMT trace points fitted both 4DCT and 4DTDR motion path within 4.5 mm. The average match of the 4DTDR estimation of the tissue hysteresis over all CT phases was 0.9 mm using a sinusoidal signal for animation and 1.0 mm using the patient trace.
Conclusions: The real tissue phantom is a tool which can be used to accurately characterize tissue deformation, helping to validate or evaluate a DIR or 4DTDR algorithm over a complete motion path. The phantom is capable of validating, evaluating, and quantifying tissue hysteresis, thereby allowing for full motion path validation.