Designed especially for neurobiologists, FluoRender is an interactive tool for multi-channel fluorescence microscopy data visualization and analysis.
Deep brain stimulation
BrainStimulator is a set of networks that are used in SCIRun to perform simulations of brain stimulation such as transcranial direct current stimulation (tDCS) and magnetic transcranial stimulation (TMS).
Developing software tools for science has always been a central vision of the SCI Institute.

SCI Publications

2014


C. Turkay, A. Lex, M. Streit, H. Pfister,, H. Hauser. “Characterizing Cancer Subtypes using Dual Analysis in Caleydo,” In IEEE Computer Graphics and Applications, Vol. 34, No. 2, pp. 38--47. March, 2014.
ISSN: 0272-1716
DOI: 10.1109/MCG.2014.1

ABSTRACT

Dual analysis uses statistics to describe both the dimensions and rows of a high-dimensional dataset. Researchers have integrated it into StratomeX, a Caleydo view for cancer subtype analysis. In addition, significant-difference plots show the elements of a candidate subtype that differ significantly from other subtypes, thus letting analysts characterize subtypes. Analysts can also investigate how data samples relate to their assigned subtype and other groups. This approach lets them create well-defined subtypes based on statistical properties. Three case studies demonstrate the approach's utility, showing how it reproduced findings from a published subtype characterization.


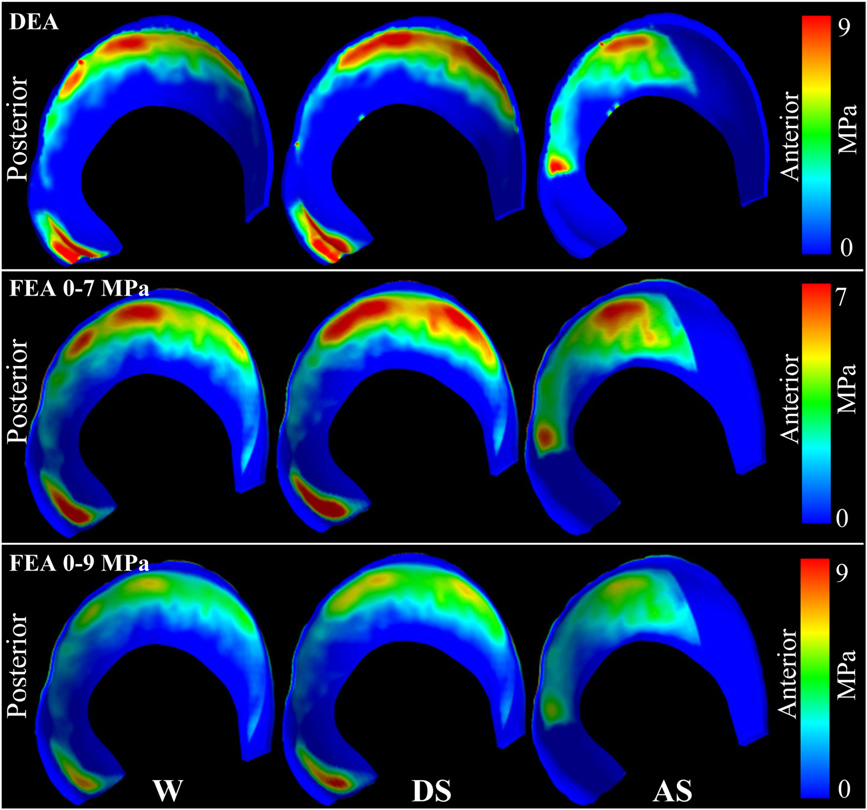
C.J. Underwood, L.T. Edgar, J.B. Hoying, J.A. Weiss. “Cell-generated traction forces and the resulting matrix deformation modulate microvascular alignment and growth during angiogenesis,” In American Journal of Physiology: Heart and Circulatory Physiology, Vol. 307, No. H152-H164, 2014.
DOI: 10.1152/ajpheart.00995.2013
PubMed ID: 24816262
PubMed Central ID: PMC4101638

ABSTRACT

The details of the mechanical factors that modulate angiogenesis remain poorly understood. Previous in vitro studies of angiogenesis using microvessel fragments cultured within collagen constructs demonstrated that neovessel alignment can be induced via mechanical constraint of the boundaries (i.e., boundary conditions). The objective of this study was to investigate the role of mechanical boundary conditions in the regulation of angiogenic alignment and growth in an in vitro model of angiogenesis. Angiogenic microvessels within three-dimensional constructs were subjected to different boundary conditions, thus producing different stress and strain fields during growth. Neovessel outgrowth and orientation were quantified from confocal image data after 6 days. Vascularity and branching decreased as the amount of constraint imposed on the culture increased. In long-axis constrained hexahedral constructs, microvessels aligned parallel to the constrained axis. In contrast, constructs that were constrained along the short axis had random microvessel orientation. Finite element models were used to simulate the contraction of gels under the various boundary conditions and to predict the local strain field experienced by microvessels. Results from the experiments and simulations demonstrated that microvessels aligned perpendicular to directions of compressive strain. Alignment was due to anisotropic deformation of the matrix from cell-generated traction forces interacting with the mechanical boundary conditions. These findings demonstrate that boundary conditions and thus the effective stiffness of the matrix regulate angiogenesis. This study offers a potential explanation for the oriented vascular beds that occur in native tissues and provides the basis for improved control of tissue vascularization in both native tissues and tissue-engineered constructs.

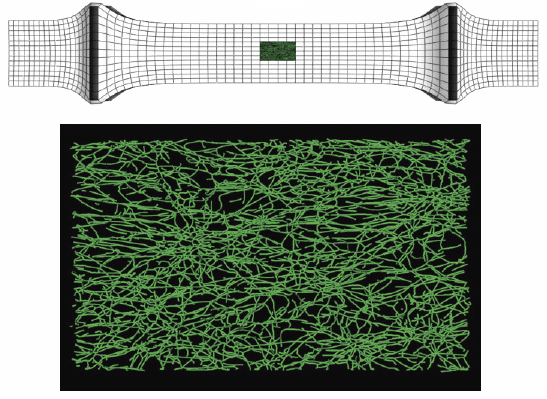
Keywords: angiogenesis, deformation, image analysis, morphometry, orientation, strain


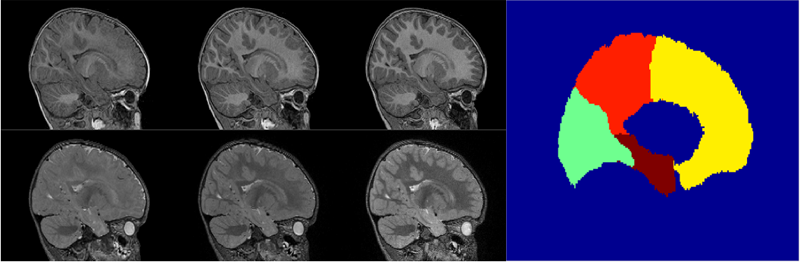
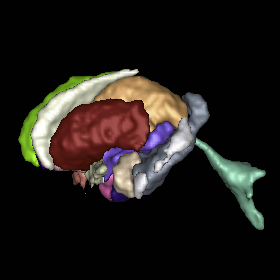
C. Vachet, H.C. Hazlett, J. Piven, G. Gerig. “4D Modeling of Infant Brain Growth in Down's Syndrome and Controls from longitudinal MRI,” In Proceeding of the 2014 Joint Annual Meeting ISMRM-ESMRMB, pp. (accepted). 2014.

ABSTRACT

Modeling of early brain growth trajectories from longitudinal MRI will provide new insight into neurodevelopmental characteristics, timing and type of changes in neurological disorders from controls. In addition to an ongoing large-scale infant autism neuroimaging study 1, we recruited 4 infants with Down’s syndrome (DS) in order to evaluate newly developed methods for 4D segmentation from longitudinal infant MRI, and for temporal modeling of brain growth trajectories. Specifically to Down's, a comparison of patterns of full brain and lobar tissue growth may lead to better insight into the observed variability of cognitive development and neurological effects, and may help with development of disease-modifying therapeutic intervention.


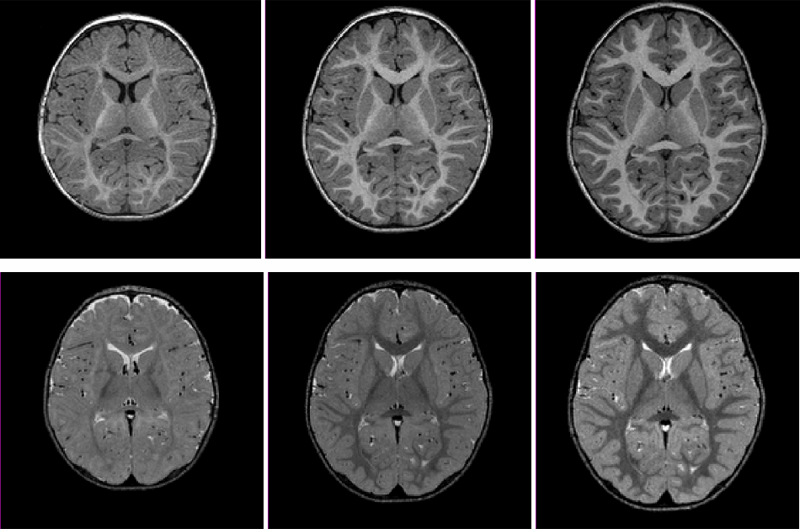
A. Vardhan, M. Prastawa, C. Vachet, J. Piven, G. Gerig. “Characterizing growth patterns in longitudinal MRI using image contrast,” In Proceedings of Medical Imaging 2014: Image Processing, 2014.

ABSTRACT

Understanding the growth patterns of the early brain is crucial to the study of neuro-development. In the early stages of brain growth, a rapid sequence of biophysical and chemical processes take place. A crucial component of these processes, known as myelination, consists of the formation of a myelin sheath around a nerve fiber, enabling the effective transmission of neural impulses. As the brain undergoes myelination, there is a subsequent change in the contrast between gray matter and white matter as observed in MR scans. In this work, graywhite matter contrast is proposed as an effective measure of appearance which is relatively invariant to location, scanner type, and scanning conditions. To validate this, contrast is computed over various cortical regions for an adult human phantom. MR (Magnetic Resonance) images of the phantom were repeatedly generated using different scanners, and at different locations. Contrast displays less variability over changing conditions of scan compared to intensity-based measures, demonstrating that it is less dependent than intensity on external factors. Additionally, contrast is used to analyze longitudinal MR scans of the early brain, belonging to healthy controls and Down's Syndrome (DS) patients. Kernel regression is used to model subject-specific trajectories of contrast changing with time. Trajectories of contrast changing with time, as well as time-based biomarkers extracted from contrast modeling, show large differences between groups. The preliminary applications of contrast based analysis indicate its future potential to reveal new information not covered by conventional volumetric or deformation-based analysis, particularly for distinguishing between normal and abnormal growth patterns.


A. Vardhan, N. Sadeghi, C. Vachet, J. Piven, G. Gerig. “Joint Longitudinal Modeling of Brain Appearance in Multimodal MRI for the Characterization of Early Brain Developmental Processes,” In Spatiotemporal Image Analysis for Longitudinal and Time-Series Image Data (STIA'14) , LNCS. MICCAI'14, Springer Verlag, June, 2014.

ABSTRACT

Early brain maturational processes such as myelination manifest as changes in the relative appearance of white-gray matter tissue classes in MR images. Imaging modalities such as T1W (T1-Weighted) and T2W (T2-Weighted) MRI each display specific patterns of appearance change associated with distinct neurobiological components of these maturational processes. In this paper we present a framework to jointly model multimodal appearance changes across time for a longitudinal imaging dataset, resulting in quantitative assessment of the patterns of early brain maturation not yet available to clinicians. We measure appearance by quantifying contrast between white and gray matter in terms of the distance between their intensity distributions, a method demonstrated to be relatively stable to interscan variability. A multivariate nonlinear mixed effects (NLME) model is used for joint statistical modeling of this contrast measure across multiple imaging modalities. The multivariate NLME procedure considers correlations between modalities in addition to intra-modal variability. The parameters of the logistic growth function used in NLME modeling provide useful quantitative information about the timing and progression of contrast change in multimodal datasets. Inverted patterns of relative white-gray matter intensity gradient that are observable in T1W scans with respect to T2W scans are characterized by the SIR (Signal Intensity Ratio). The CONTDIR (Contrast Direction) which measures the direction of the gradient at each time point relative to that in the adult-like scan adds a directional attribute to contrast. The major contribution of this paper is a framework for joint multimodal temporal modeling of white-gray matter MRI contrast change and estimation of subject-specific and population growth trajectories. Results confirm qualitative descriptions of growth patterns in pediatric radiology studies and our new quantitative modeling scheme has the potential to advance understanding of variability of brain tissue maturation and to eventually differentiate normal from abnormal growth for early diagnosis of pathology.


A.R. Verde, F. Budin, J.-B. Berger, A. Gupta, M. Farzinfar, A. Kaiser, M. Ahn, H. Johnson, J. Matsui, H.C. Hazlett, A. Sharma, C. Goodlett, Y. Shi, S. Gouttard, C. Vachet, J. Piven, H. Zhu, G. Gerig, M. Styner. “UNC-Utah NA-MIC framework for DTI fiber tract analysis,” In Frontiers in Neuroinformatics, Vol. 7, No. 51, January, 2014.
DOI: 10.3389/fninf.2013.00051

ABSTRACT

Diffusion tensor imaging has become an important modality in the field of neuroimaging to capture changes in micro-organization and to assess white matter integrity or development. While there exists a number of tractography toolsets, these usually lack tools for preprocessing or to analyze diffusion properties along the fiber tracts. Currently, the field is in critical need of a coherent end-to-end toolset for performing an along-fiber tract analysis, accessible to non-technical neuroimaging researchers. The UNC-Utah NA-MIC DTI framework represents a coherent, open source, end-to-end toolset for atlas fiber tract based DTI analysis encompassing DICOM data conversion, quality control, atlas building, fiber tractography, fiber parameterization, and statistical analysis of diffusion properties. Most steps utilize graphical user interfaces (GUI) to simplify interaction and provide an extensive DTI analysis framework for non-technical researchers/investigators. We illustrate the use of our framework on a small sample, cross sectional neuroimaging study of eight healthy 1-year-old children from the Infant Brain Imaging Study (IBIS) Network. In this limited test study, we illustrate the power of our method by quantifying the diffusion properties at 1 year of age on the genu and splenium fiber tracts.

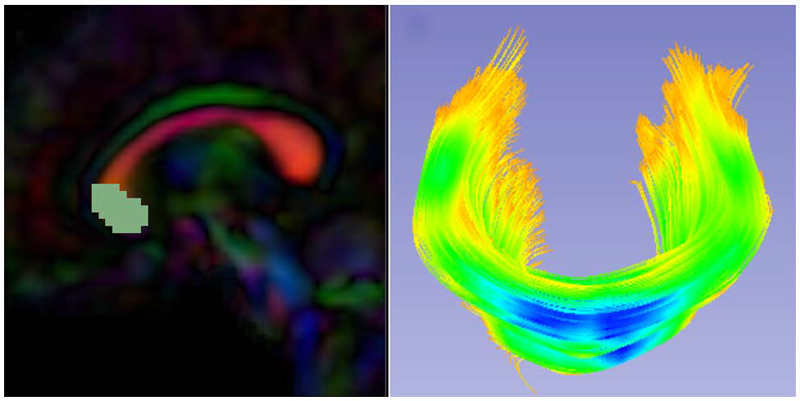
Keywords: neonatal neuroimaging, white matter pathways, magnetic resonance imaging, diffusion tensor imaging, diffusion imaging quality control, DTI atlas building


Bo Wang, W. Liu, M. Prastawa, A. Irimia, P.M. Vespa, J.D. van Horn, P.T. Fletcher, G. Gerig. “4D Active Cut: An Interactive Tool for Pathological Anatomy Modeling,” In Proceedings of the 2014 IEEE International Symposium on Biomedical Imaging (ISBI), pp. (accepted). 2014.

ABSTRACT

4D pathological anatomy modeling is key to understanding complex pathological brain images. It is a challenging problem due to the difficulties in detecting multiple appearing and disappearing lesions across time points and estimating dynamic changes and deformations between them. We propose a novel semi-supervised method, called 4D active cut, for lesion recognition and deformation estimation. Existing interactive segmentation methods passively wait for user to refine the segmentations which is a difficult task in 3D images that change over time. 4D active cut instead actively selects candidate regions for querying the user, and obtains the most informative user feedback. A user simply answers 'yes' or 'no' to a candidate object without having to refine the segmentation slice by slice. Compared to single-object detection of the existing methods, our method also detects multiple lesions with spatial coherence using Markov random fields constraints. Results show improvement on the lesion detection, which subsequently improves deformation estimation.

Keywords: Active learning, graph cuts, longitudinal MRI, Markov Random Fields, semi-supervised learning


J. Wang, C. Vachet, A. Rumple, S. Gouttard, C. Ouzie, E. Perrot, G. Du, X. Huang, G. Gerig, M.A. Styner. “Multi-atlas segmentation of subcortical brain structures via the AutoSeg software pipeline,” In Frontiers in Neuroinformatics, Vol. 8, No. 7, 2014.
DOI: 10.3389/fninf.2014.00007

ABSTRACT

Automated segmenting and labeling of individual brain anatomical regions, in MRI are challenging, due to the issue of individual structural variability. Although atlas-based segmentation has shown its potential for both tissue and structure segmentation, due to the inherent natural variability as well as disease-related changes in MR appearance, a single atlas image is often inappropriate to represent the full population of datasets processed in a given neuroimaging study. As an alternative for the case of single atlas segmentation, the use of multiple atlases alongside label fusion techniques has been introduced using a set of individual “atlases” that encompasses the expected variability in the studied population. In our study, we proposed a multi-atlas segmentation scheme with a novel graph-based atlas selection technique. We first paired and co-registered all atlases and the subject MR scans. A directed graph with edge weights based on intensity and shape similarity between all MR scans is then computed. The set of neighboring templates is selected via clustering of the graph. Finally, weighted majority voting is employed to create the final segmentation over the selected atlases. This multi-atlas segmentation scheme is used to extend a single-atlas-based segmentation toolkit entitled AutoSeg, which is an open-source, extensible C++ based software pipeline employing BatchMake for its pipeline scripting, developed at the Neuro Image Research and Analysis Laboratories of the University of North Carolina at Chapel Hill. AutoSeg performs N4 intensity inhomogeneity correction, rigid registration to a common template space, automated brain tissue classification based skull-stripping, and the multi-atlas segmentation. The multi-atlas-based AutoSeg has been evaluated on subcortical structure segmentation with a testing dataset of 20 adult brain MRI scans and 15 atlas MRI scans. The AutoSeg achieved mean Dice coefficients of 81.73% for the subcortical structures.

Keywords: segmentation, Registration, MRI, Atlas, Brain, Insight Toolkit


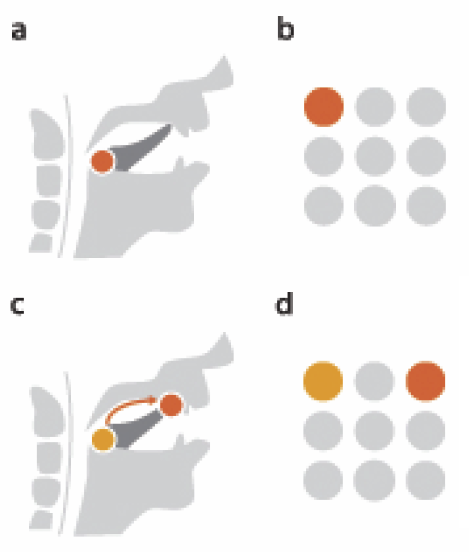
Y. Wan, H. Otsuna, K. Kwan, C.D. Hansen. “Real-Time Dense Nucleus Selection from Confocal Data,” In Proceedings of the Eurographics Workshop on Visual Computing for Biology and Medicine, 2014.

ABSTRACT

Selecting structures from volume data using direct over-the-visualization interactions, such as a paint brush, is perhaps the most intuitive method in a variety of application scenarios. Unfortunately, it seems difficult to design a universal tool that is effective for all different structures in biology research. In [WOCH12b], an interactive technique was proposed for extracting neural structures from confocal microscopy data. It uses a dual-stroke paint brush to select desired structures directly from volume visualizations. However, the technique breaks down when it was applied to selecting densely packed structures with condensed shapes, such as nuclei from zebrafish eye development research. We collaborated with biologists studying zebrafish eye development and adapted the paint brush tool for real-time nucleus selection from volume data. The morphological diffusion algorithm used in the previous paint brush is restricted to gradient descending directions for improved nucleus boundary definition. Occluded seeds are removed using backward ray-casting. The adapted paint brush is then used in tracking cell movements in a time sequence dataset of a developing zebrafish eye.


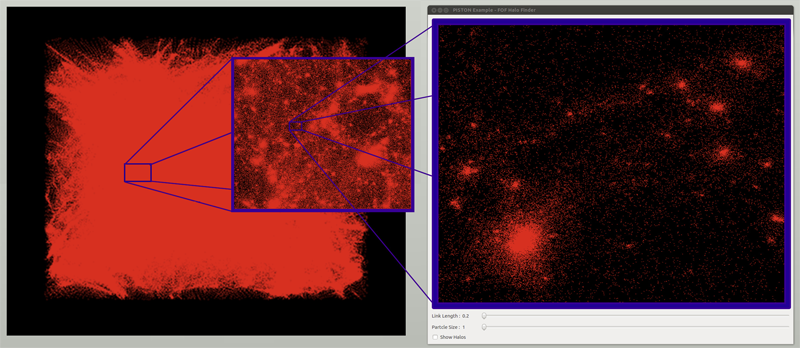
W. Widanagamaachchi, P.-T. Bremer, C. Sewell, L.-T. Lo; J. Ahrens, V. Pascucci. “Data-Parallel Halo Finding with Variable Linking Lengths,” In Proceedings of the 2014 IEEE 4th Symposium on Large Data Analysis and Visualization (LDAV), pp. 27--34. November, 2014.

ABSTRACT

State-of-the-art cosmological simulations regularly contain billions of particles, providing scientists the opportunity to study the evolution of the Universe in great detail. However, the rate at which these simulations generate data severely taxes existing analysis techniques. Therefore, developing new scalable alternatives is essential for continued scientific progress. Here, we present a dataparallel, friends-of-friends halo finding algorithm that provides unprecedented flexibility in the analysis by extracting multiple linking lengths. Even for a single linking length, it is as fast as the existing techniques, and is portable to multi-threaded many-core systems as well as co-processing resources. Our system is implemented using PISTON and is coupled to an interactive analysis environment used to study halos at different linking lengths and track their evolution over time.


Y.-Y. Yu, P.T. Fletcher, S.P. Awate. “Hierarchical Bayesian Modeling, Estimation, and Sampling for Multigroup Shape Analysis,” In Proceedings of Medical Image Computing and Computer Assisted Intervention (MICCAI), 2014.

ABSTRACT

This paper proposes a novel method for the analysis of anatomical shapes present in biomedical image data. Motivated by the natural organization of population data into multiple groups, this paper presents a novel hierarchical generative statistical model on shapes. The proposed method represents shapes using pointsets and defines a joint distribution on the population's (i) shape variables and (ii) object-boundary data. The proposed method solves for optimal (i) point locations, (ii) correspondences, and (iii) model-parameter values as a single optimization problem. The optimization uses expectation maximization relying on a novel Markov-chain Monte-Carlo algorithm for sampling in Kendall shape space. Results on clinical brain images demonstrate advantages over the state of the art.


M. Zhang, P.T. Fletcher. “Bayesian Principal Geodesic Analysis in Diffeomorphic Image Registration,” In Proceedings of Medical Image Computing and Computer Assisted Intervention (MICCAI), 2014.

ABSTRACT

Computing a concise representation of the anatomical variability found in large sets of images is an important rst step in many statistical shape analyses. In this paper, we present a generative Bayesian approach for automatic dimensionality reduction of shape variability represented through diffeomorphic mappings. To achieve this, we develop a latent variable model for principal geodesic analysis (PGA) that provides a probabilistic framework for factor analysis on diffeomorphisms. Our key contribution is a Bayesian inference procedure for model parameter estimation and simultaneous detection of the effective dimensionality of the latent space. We evaluate our proposed model for atlas and principal geodesic estimation on the OASIS brain database of magnetic resonance images. We show that the automatically selected latent dimensions from our model are able to reconstruct unseen brain images with lower error than equivalent linear principal components analysis (LPCA) models in the image space, and it also outperforms tangent space PCA (TPCA) models in the diffeomorphism setting.


L. Zhou, C.D. Hansen. “GuideME: Slice-guided Semiautomatic Multivariate Exploration of Volumes,” In Computer Graphics Forum, Vol. 33, No. 3, Wiley-Blackwell, pp. 151--160. jun, 2014.
DOI: 10.1111/cgf.12371

ABSTRACT

Multivariate volume visualization is important for many applications including petroleum exploration and medicine. State-of-the-art tools allow users to interactively explore volumes with multiple linked parameter-space views. However, interactions in the parameter space using trial-and-error may be unintuitive and time consuming. Furthermore, switching between different views may be distracting. In this paper, we propose GuideME: a novel slice-guided semiautomatic multivariate volume exploration approach. Specifically, the approach comprises four stages: attribute inspection, guided uncertainty-aware lasso creation, automated feature extraction and optional spatial fine tuning and visualization. Throughout the exploration process, the user does not need to interact with the parameter views at all and examples of complex real-world data demonstrate the usefulness, efficiency and ease-of-use of our method.


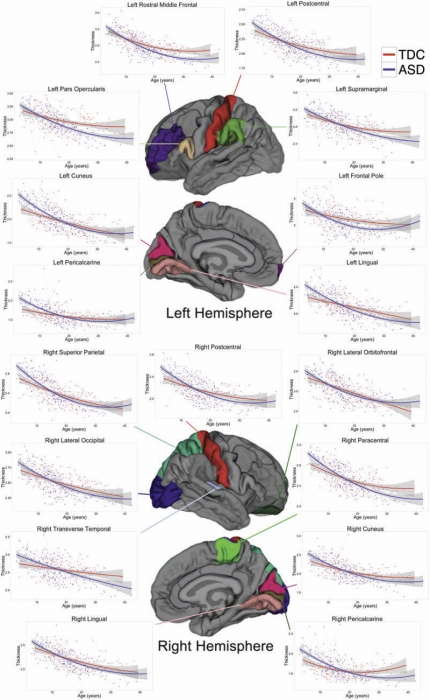
B.A. Zielinski, M.B.D. Prigge, J.A. Nielsen, A.L. Froehlich, T.J. Abildskov, J.S. Anderson, P.T. Fletcher, K.M. Zygmunt, B.G. Travers, N. Lange, A.L. Alexander, E.D. Bigler, J.E. Lainhart. “Longitudinal changes in cortical thickness in autism and typical development,” In Brain, Vol. 137, No. 6, Edited by Dimitri M. Kullmann, pp. 1799--1812. 2014.
DOI: 10.1093/brain/awu083

ABSTRACT

The natural history of brain growth in autism spectrum disorders remains unclear. Cross-sectional studies have identified regional abnormalities in brain volume and cortical thickness in autism, although substantial discrepancies have been reported. Preliminary longitudinal studies using two time points and small samples have identified specific regional differences in cortical thickness in the disorder. To clarify age-related trajectories of cortical development, we examined longitudinal changes in cortical thickness within a large mixed cross-sectional and longitudinal sample of autistic subjects and age- and gender-matched typically developing controls. Three hundred and forty-five magnetic resonance imaging scans were examined from 97 males with autism (mean age = 16.8 years; range 3-36 years) and 60 males with typical development (mean age = 18 years; range 4-39 years), with an average interscan interval of 2.6 years. FreeSurfer image analysis software was used to parcellate the cortex into 34 regions of interest per hemisphere and to calculate mean cortical thickness for each region. Longitudinal linear mixed effects models were used to further characterize these findings and identify regions with between-group differences in longitudinal age-related trajectories. Using mean age at time of first scan as a reference (15 years), differences were observed in bilateral inferior frontal gyrus, pars opercularis and pars triangularis, right caudal middle frontal and left rostral middle frontal regions, and left frontal pole. However, group differences in cortical thickness varied by developmental stage, and were influenced by IQ. Differences in age-related trajectories emerged in bilateral parietal and occipital regions (postcentral gyrus, cuneus, lingual gyrus, pericalcarine cortex), left frontal regions (pars opercularis, rostral middle frontal and frontal pole), left supramarginal gyrus, and right transverse temporal gyrus, superior parietal lobule, and paracentral, lateral orbitofrontal, and lateral occipital regions. We suggest that abnormal cortical development in autism spectrum disorders undergoes three distinct phases: accelerated expansion in early childhood, accelerated thinning in later childhood and adolescence, and decelerated thinning in early adulthood. Moreover, cortical thickness abnormalities in autism spectrum disorders are region-specific, vary with age, and may remain dynamic well into adulthood.


2013


A. Abdul-Rahman, J. Lein, K. Coles, E. Maguire, M.D. Meyer, M. Wynne, C.R. Johnson, A. Trefethen, M. Chen. “Rule-based Visual Mappings - with a Case Study on Poetry Visualization,” In Proceedings of the 2013 Eurographics Conference on Visualization (EuroVis), Vol. 32, No. 3, pp. 381--390. June, 2013.

ABSTRACT

In this paper, we present a user-centered design study on poetry visualization. We develop a rule-based solution to address the conflicting needs for maintaining the flexibility of visualizing a large set of poetic variables and for reducing the tedium and cognitive load in interacting with the visual mapping control panel. We adopt Munzner's nested design model to maintain high-level interactions with the end users in a closed loop. In addition, we examine three design options for alleviating the difficulty in visualizing poems latitudinally. We present several example uses of poetry visualization in scholarly research on poetry.


C.L. Abraham, S.A. Maas, J.A. Weiss, B.J. Ellis, C.L. Peters, A.E. Anderson. “A new discrete element analysis method for predicting hip joint contact stresses,” In Journal of Biomechanics, Vol. 46, No. 6, pp. 1121--1127. 2013.
DOI: 10.1016/j.jbiomech.2013.01.012

ABSTRACT

Quantifying cartilage contact stress is paramount to understanding hip osteoarthritis. Discrete element analysis (DEA) is a computationally efficient method to estimate cartilage contact stresses. Previous applications of DEA have underestimated cartilage stresses and yielded unrealistic contact patterns because they assumed constant cartilage thickness and/or concentric joint geometry. The study objectives were to: (1) develop a DEA model of the hip joint with subject-specific bone and cartilage geometry, (2) validate the DEA model by comparing DEA predictions to those of a validated finite element analysis (FEA) model, and (3) verify both the DEA and FEA models with a linear-elastic boundary value problem. Springs representing cartilage in the DEA model were given lengths equivalent to the sum of acetabular and femoral cartilage thickness and gap distance in the FEA model. Material properties and boundary/loading conditions were equivalent. Walking, descending, and ascending stairs were simulated. Solution times for DEA and FEA models were ∼7 s and ∼65 min, respectively. Irregular, complex contact patterns predicted by DEA were in excellent agreement with FEA. DEA contact areas were 7.5%, 9.7% and 3.7% less than FEA for walking, descending stairs, and ascending stairs, respectively. DEA models predicted higher peak contact stresses (9.8–13.6 MPa) and average contact stresses (3.0–3.7 MPa) than FEA (6.2–9.8 and 2.0–2.5 MPa, respectively). DEA overestimated stresses due to the absence of the Poisson's effect and a direct contact interface between cartilage layers. Nevertheless, DEA predicted realistic contact patterns when subject-specific bone geometry and cartilage thickness were used. This DEA method may have application as an alternative to FEA for pre-operative planning of joint-preserving surgery such as acetabular reorientation during peri-acetabular osteotomy.


E.W. Anderson, C. Chong, G.A. Preston, C.T. Silva. “Discovering and Visualizing Patterns in EEG Data,” In Proceedings of the 2013 IEEE Pacific Visualization Symposium (PacificVis), pp. 105--112. 2013.

ABSTRACT

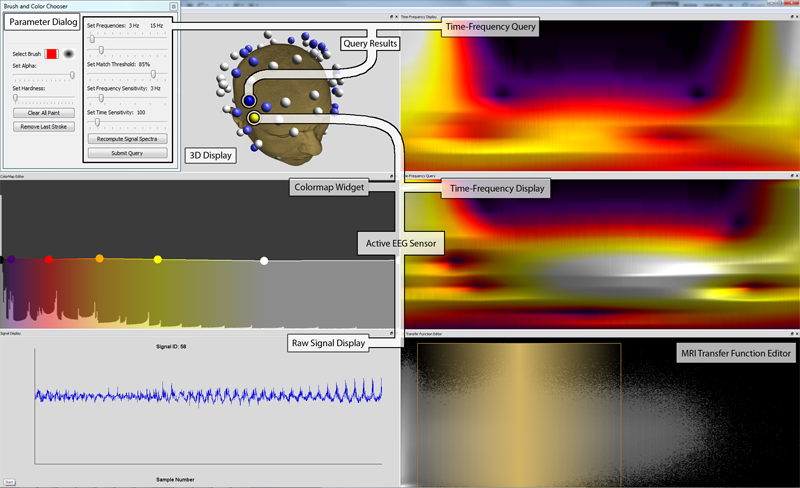
Brain activity data is often collected through the use of electroencephalography (EEG). In this data acquisition modality, the electric fields generated by neurons are measured at the scalp. Although this technology is capable of measuring activity from a group of neurons, recent efforts provide evidence that these small neuronal collections communicate with other, distant assemblies in the brain's cortex. These collaborative neural assemblies are often found by examining the EEG record to find shared activity patterns.

In this paper, we present a system that focuses on extracting and visualizing potential neural activity patterns directly from EEG data. Using our system, neuroscientists may investigate the spectral dynamics of signals generated by individual electrodes or groups of sensors. Additionally, users may interactively generate queries which are processed to reveal which areas of the brain may exhibit common activation patterns across time and frequency. The utility of this system is highlighted in a case study in which it is used to analyze EEG data collected during a working memory experiment.


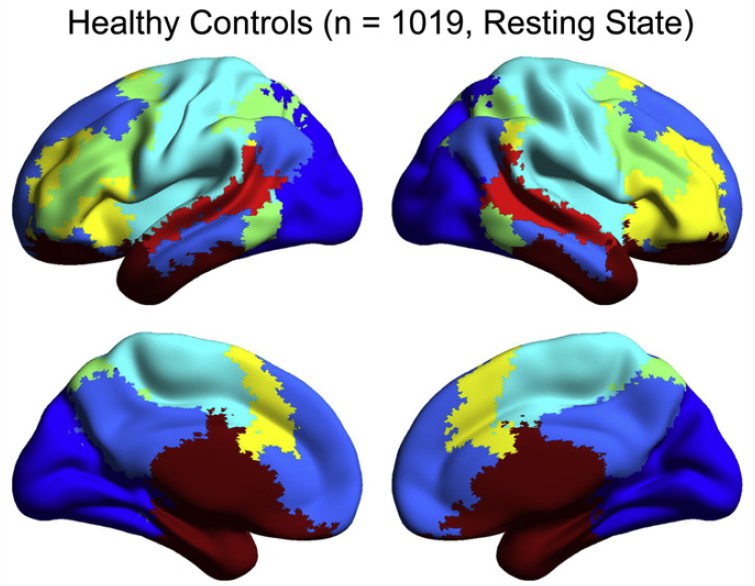
J.S. Anderson, J.A. Nielsen, M.A. Ferguson, M.C. Burback, E.T. Cox, L. Dai, G. Gerig, J.O. Edgin, J.R. Korenberg. “Abnormal brain synchrony in Down Syndrome,” In NeuroImage: Clinical, Vol. 2, pp. 703--715. 2013.
ISSN: 2213-1582
DOI: 10.1016/j.nicl.2013.05.006

ABSTRACT

Down Syndrome is the most common genetic cause for intellectual disability, yet the pathophysiology of cognitive impairment in Down Syndrome is unknown. We compared fMRI scans of 15 individuals with Down Syndrome to 14 typically developing control subjects while they viewed 50 min of cartoon video clips. There was widespread increased synchrony between brain regions, with only a small subset of strong, distant connections showing underconnectivity in Down Syndrome. Brain regions showing negative correlations were less anticorrelated and were among the most strongly affected connections in the brain. Increased correlation was observed between all of the distributed brain networks studied, with the strongest internetwork correlation in subjects with the lowest performance IQ. A functional parcellation of the brain showed simplified network structure in Down Syndrome organized by local connectivity. Despite increased interregional synchrony, intersubject correlation to the cartoon stimuli was lower in Down Syndrome, indicating that increased synchrony had a temporal pattern that was not in response to environmental stimuli, but idiosyncratic to each Down Syndrome subject. Short-range, increased synchrony was not observed in a comparison sample of 447 autism vs. 517 control subjects from the Autism Brain Imaging Exchange (ABIDE) collection of resting state fMRI data, and increased internetwork synchrony was only observed between the default mode and attentional networks in autism. These findings suggest immature development of connectivity in Down Syndrome with impaired ability to integrate information from distant brain regions into coherent distributed networks.


J. Beckvermit, J. Peterson, T. Harman, S. Bardenhagen, C. Wight, Q. Meng, M. Berzins. “Multiscale Modeling of Accidental Explosions and Detonations,” In Computing in Science and Engineering, Vol. 15, No. 4, pp. 76--86. 2013.
DOI: 10.1109/MCSE.2013.89

ABSTRACT

Accidental explosions are exceptionally dangerous and costly, both in lives and money. Regarding world-wide conflict with small arms and light weapons, the Small Arms Survey has recorded over 297 accidental explosions in munitions depots across the world that have resulted in thousands of deaths and billions of dollars in damage in the past decade alone [45]. As the recent fertilizer plant explosion that killed 15 people in West, Texas demonstrates, accidental explosions are not limited to military operations. Transportation accidents also pose risks, as illustrated by the occasional train derailment/explosion in the nightly news, or the semi-truck explosion detailed in the following section. Unlike other industrial accident scenarios, explosions can easily affect the general public, a dramatic example being the PEPCON disaster in 1988, where windows were shattered, doors blown off their hinges, and flying glass and debris caused injuries up to 10 miles away.

While the relative rarity of accidental explosions speaks well of our understanding to date, their violence rightly gives us pause. A better understanding of these materials is clearly still needed, but a significant barrier is the complexity of these materials and the various length scales involved. In typical military applications, explosives are known to be ignited by the coalescence of hot spots which occur on micrometer scales. Whether this reaction remains a deflagration (burning) or builds to a detonation depends both on the stimulus and the boundary conditions or level of confinement. Boundary conditions are typically on the scale of engineered parts, approximately meters. Additional dangers are present at the scale of trucks and factories. The interaction of various entities, such as barrels of fertilizer or crates of detonators, admits the possibility of a sympathetic detonation, i.e. the unintended detonation of one entity by the explosion of another, generally caused by an explosive shock wave or blast fragments.

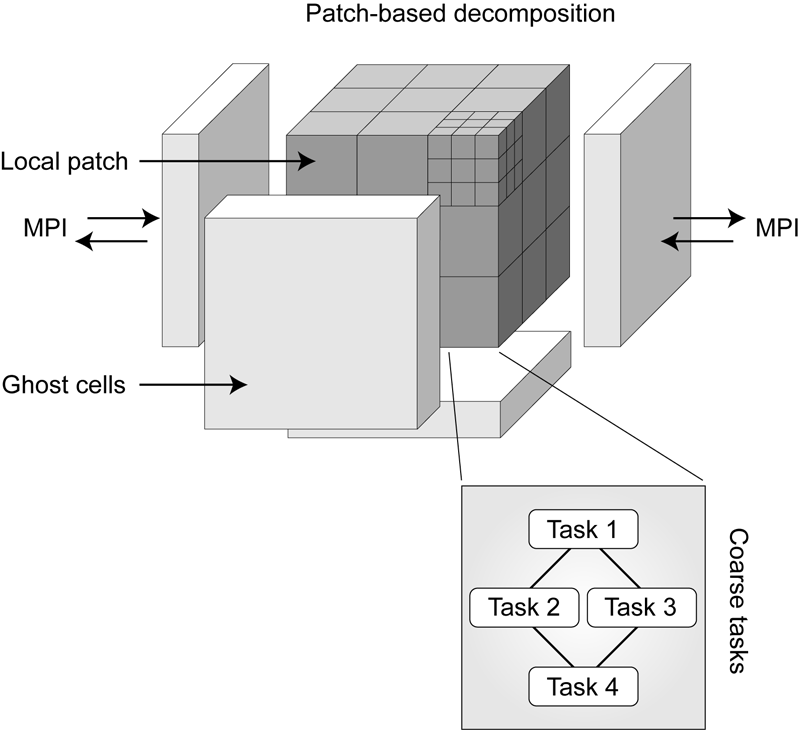
While experimental work has been and will continue to be critical to developing our fundamental understanding of explosive initiation, de agration and detonation, there is no practical way to comprehensively assess safety on the scale of trucks and factories experimentally. The scenarios are too diverse and the costs too great. Numerical simulation provides a complementary tool that, with the steadily increasing computational power of the past decades, makes simulations at this scale begin to look plausible. Simulations at both the micrometer scale, the "mesoscale", and at the scale of engineered parts, the "macro-scale", have been contributing increasingly to our understanding of these materials. Still, simulations on this scale require both massively parallel computational infrastructure and selective sampling of mesoscale response, i.e. advanced computational tools and modeling. The computational framework Uintah [1] has been developed for exactly this purpose.

Keywords: uintah, c-safe, accidents, explosions, military computing, risk analysis


M. Berzins, J. Schmidt, Q. Meng, A. Humphrey. “Past, Present, and Future Scalability of the Uintah Software,” In Proceedings of the Blue Waters Extreme Scaling Workshop 2012, pp. Article No.: 6. 2013.

ABSTRACT

The past, present and future scalability of the Uintah Software framework is considered with the intention of describing a successful approach to large scale parallelism and also considering how this approach may need to be extended for future architectures. Uintah allows the solution of large scale fluid-structure interaction problems through the use of fluid flow solvers coupled with particle-based solids methods. In addition Uintah uses a combustion solver to tackle a broad and challenging class of turbulent combustion problems. A unique feature of Uintah is that it uses an asynchronous task-based approach with automatic load balancing to solve complex problems using techniques such as adaptive mesh refinement. At present, Uintah is able to make full use of present-day massively parallel machines as the result of three phases of development over the past dozen years. These development phases have led to an adaptive scalable run-time system that is capable of independently scheduling tasks to multiple CPUs cores and GPUs on a node. In the case of solving incompressible low-mach number applications it is also necessary to use linear solvers and to consider the challenges of radiation problems. The approaches adopted to achieve present scalability are described and their extensions to possible future architectures is considered.

Keywords: netl, Uintah, parallelism, scalability, adaptive mesh refinement, linear equations