SCI Publications
2013


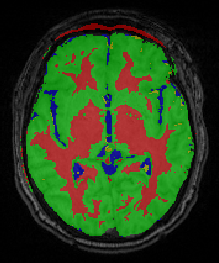
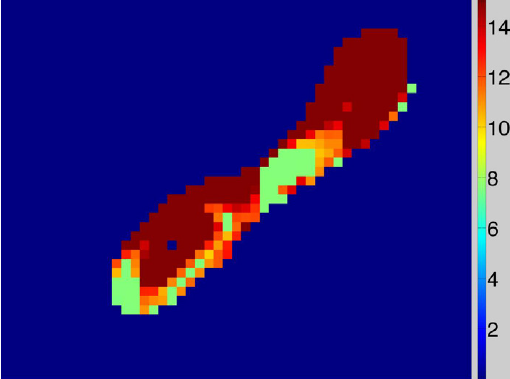
Bo Wang, M.W. Prastawa, A. Irimia, M.C. Chambers, N. Sadeghi, P.M. Vespa, J.D. van Horn, G. Gerig.
“Analyzing Imaging Biomarkers for Traumatic Brain Injury Using 4D Modeling of Longitudinal MRI,” In 2013 IEEE Proceedings of 10th International Symposium on Biomedical Imaging (ISBI), pp. 1392 - 1395. 2013.
DOI: 10.1109/ISBI.2013.6556793
ABSTRACT
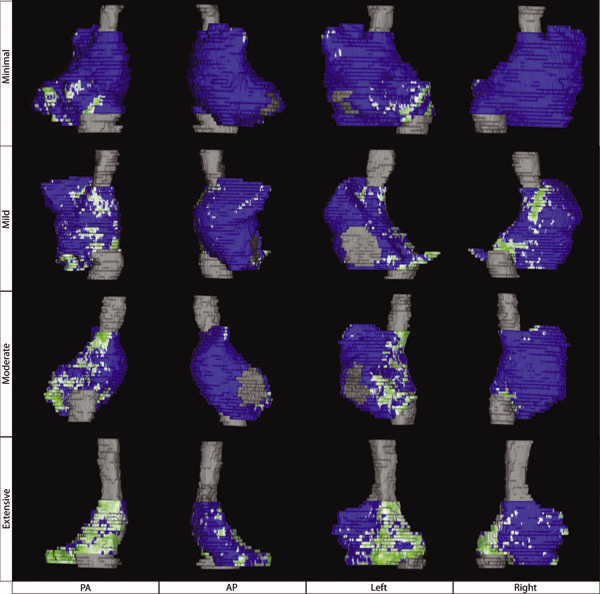
Quantitative imaging biomarkers are important for assessment of impact, recovery and treatment efficacy in patients with traumatic brain injury (TBI). To our knowledge, the identification of such biomarkers characterizing disease progress and recovery has been insufficiently explored in TBI due to difficulties in registration of baseline and followup data and automatic segmentation of tissue and lesions from multimodal, longitudinal MR image data. We propose a new methodology for computing imaging biomarkers in TBI by extending a recently proposed spatiotemporal 4D modeling approach in order to compute quantitative features of tissue change. The proposed method computes surface-based and voxel-based measurements such as cortical thickness, volume changes, and geometric deformation. We analyze the potential for clinical use of these biomarkers by correlating them with TBI-specific patient scores at the level of the whole brain and of individual regions. Our preliminary results indicate that the proposed voxel-based biomarkers are correlated with clinical outcomes.
D. Wang, R.M. Kirby, R.S. MacLeod, C.R. Johnson.
“Inverse Electrocardiographic Source Localization of Ischemia: An Optimization Framework and Finite Element Solution,” In Journal of Computational Physics, Vol. 250, Academic Press, pp. 403--424. 2013.
ISSN: 0021-9991
DOI: 10.1016/j.jcp.2013.05.027
ABSTRACT
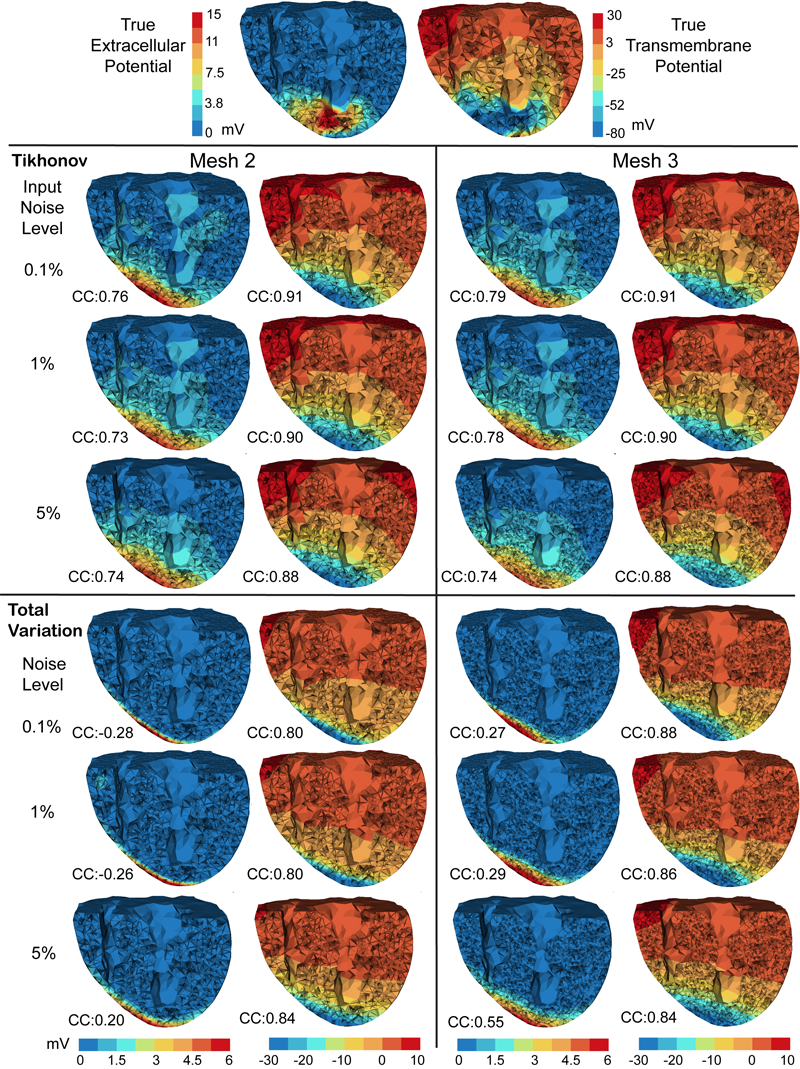
With the goal of non-invasively localizing cardiac ischemic disease using bodysurface potential recordings, we attempted to reconstruct the transmembrane potential (TMP) throughout the myocardium with the bidomain heart model. The task is an inverse source problem governed by partial differential equations (PDE). Our main contribution is solving the inverse problem within a PDE-constrained optimization framework that enables various physically-based constraints in both equality and inequality forms. We formulated the optimality conditions rigorously in the continuum before deriving finite element discretization, thereby making the optimization independent of discretization choice. Such a formulation was derived for the L2-norm Tikhonov regularization and the total variation minimization. The subsequent numerical optimization was fulfilled by a primal-dual interior-point method tailored to our problem's specific structure. Our simulations used realistic, fiberincluded heart models consisting of up to 18,000 nodes, much finer than any inverse models previously reported. With synthetic ischemia data we localized ischemic regions with roughly a 10% false-negative rate or a 20% false-positive rate under conditions up to 5% input noise. With ischemia data measured from animal experiments, we reconstructed TMPs with roughly 0.9 correlation with the ground truth. While precisely estimating the TMP in general cases remains an open problem, our study shows the feasibility of reconstructing TMP during the ST interval as a means of ischemia localization.
Keywords: cvrti, 2P41 GM103545-14
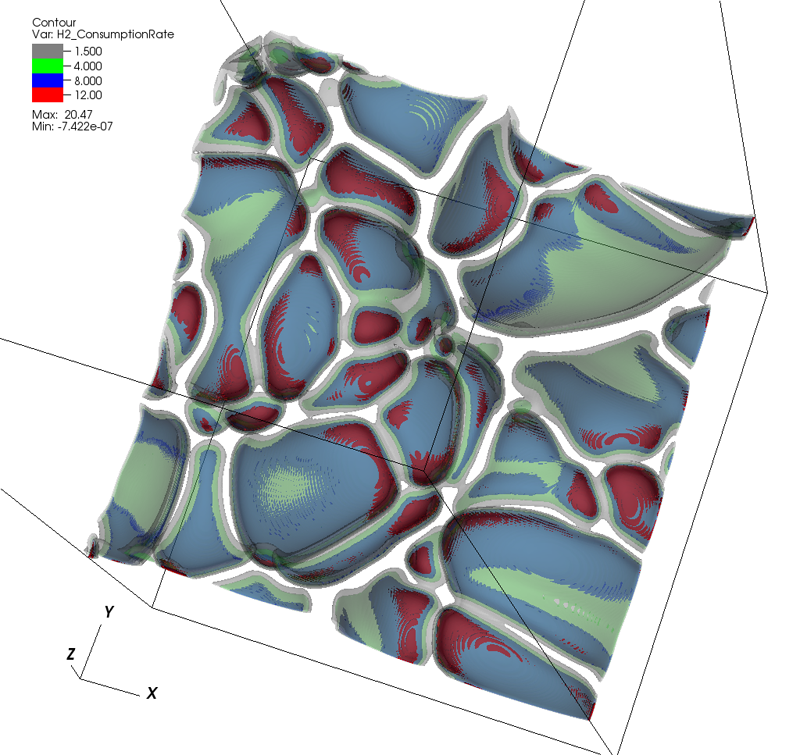
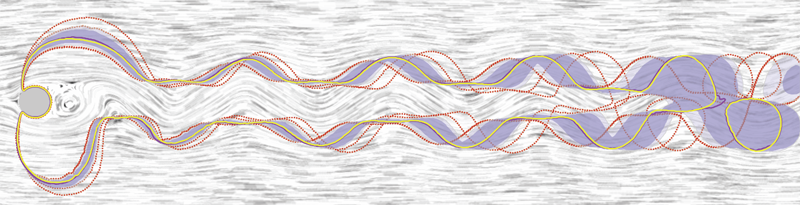
Bei Wang, P. Rosen, P. Skraba, H. Bhatia, V. Pascucci.
“Visualizing Robustness of Critical Points for 2D Time-Varying Vector Fields,” In Computer Graphics Forum, Vol. 32, No. 3, Wiley-Blackwell, pp. 221--230. jun, 2013.
DOI: 10.1111/cgf.12109
ABSTRACT
Analyzing critical points and their temporal evolutions plays a crucial role in understanding the behavior of vector fields. A key challenge is to quantify the stability of critical points: more stable points may represent more important phenomena or vice versa. The topological notion of robustness is a tool which allows us to quantify rigorously the stability of each critical point. Intuitively, the robustness of a critical point is the minimum amount of perturbation necessary to cancel it within a local neighborhood, measured under an appropriate metric. In this paper, we introduce a new analysis and visualization framework which enables interactive exploration of robustness of critical points for both stationary and time-varying 2D vector fields. This framework allows the end-users, for the first time, to investigate how the stability of a critical point evolves over time. We show that this depends heavily on the global properties of the vector field and that structural changes can correspond to interesting behavior. We demonstrate the practicality of our theories and techniques on several datasets involving combustion and oceanic eddy simulations and obtain some key insights regarding their stable and unstable features.
Y. Wan, H. Otsuna, C.D. Hansen.
“Synthetic Brainbows,” In Computer Graphics Forum, Vol. 32, No. 3pt4, Wiley-Blackwell, pp. 471--480. jun, 2013.
DOI: 10.1111/cgf.12134
ABSTRACT
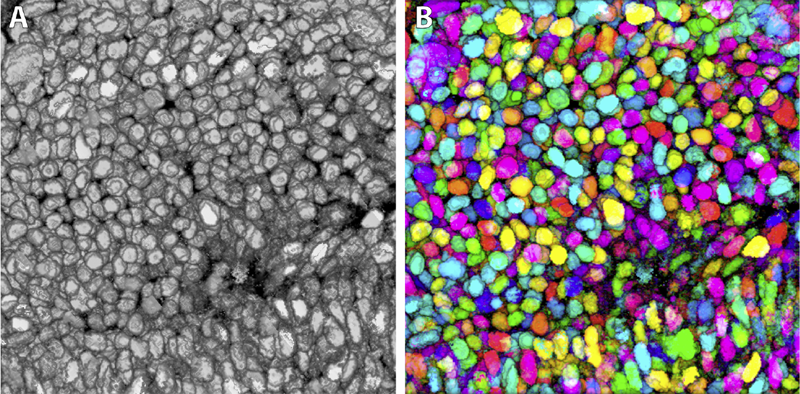
Brainbow is a genetic engineering technique that randomly colorizes cells. Biological samples processed with this technique and imaged with confocal microscopy have distinctive colors for individual cells. Complex cellular structures can then be easily visualized. However, the complexity of the Brainbow technique limits its applications. In practice, most confocal microscopy scans use different florescence staining with typically at most three distinct cellular structures. These structures are often packed and obscure each other in rendered images making analysis difficult. In this paper, we leverage a process known as GPU framebuffer feedback loops to synthesize Brainbow-like images. In addition, we incorporate ID shuffling and Monte-Carlo sampling into our technique, so that it can be applied to single-channel confocal microscopy data. The synthesized Brainbow images are presented to domain experts with positive feedback. A user survey demonstrates that our synthetic Brainbow technique improves visualizations of volume data with complex structures for biologists.
Bo Wang, M. Prastawa, A. Saha, S.P. Awate, A. Irimia, M.C. Chambers, P.M. Vespa, J.D. Van Horn, V. Pascucci, G. Gerig.
“Modeling 4D changes in pathological anatomy using domain adaptation: analysis of TBI imaging using a tumor database,” In Proceedings of the 2013 MICCAI-MBIA Workshop, Lecture Notes in Computer Science (LNCS), Vol. 8159, Note: Awarded Best Paper!, pp. 31--39. 2013.
DOI: 10.1007/978-3-319-02126-3_4
ABSTRACT
Analysis of 4D medical images presenting pathology (i.e., lesions) is signi cantly challenging due to the presence of complex changes over time. Image analysis methods for 4D images with lesions need to account for changes in brain structures due to deformation, as well as the formation and deletion of new structures (e.g., edema, bleeding) due to the physiological processes associated with damage, intervention, and recovery. We propose a novel framework that models 4D changes in pathological anatomy across time, and provides explicit mapping from a healthy template to subjects with pathology. Moreover, our framework uses transfer learning to leverage rich information from a known source domain, where we have a collection of completely segmented images, to yield effective appearance models for the input target domain. The automatic 4D segmentation method uses a novel domain adaptation technique for generative kernel density models to transfer information between different domains, resulting in a fully automatic method that requires no user interaction. We demonstrate the effectiveness of our novel approach with the analysis of 4D images of traumatic brain injury (TBI), using a synthetic tumor database as the source domain.
Y. Wan.
“Fluorender, An Interactive Tool for Confocal Microscopy Data Visualization and Analysis,” Note: Ph.D. Thesis, School of Computing, University of Utah, June, 2013.
ABSTRACT
Confocal microscopy has become a popular imaging technique in biology research in recent years. It is often used to study three-dimensional (3D) structures of biological samples. Confocal data are commonly multi-channel, with each channel resulting from a different fluorescent staining. This technique also results finely detailed structures in 3D, such as neuron fibers. Despite the plethora of volume rendering techniques that have been available for many years, there is a demand from biologists for a flexible tool that allows interactive visualization and analysis of multi-channel confocal data. Together with biologists, we have designed and developed FluoRender. It incorporates volume rendering techniques such as a two-dimensional (2D) transfer function and multi-channel intermixing. Rendering results can be enhanced through tone-mappings and overlays. To facilitate analyses of confocal data, FluoRender provides interactive operations for extracting complex structures. Furthermore, we developed the Synthetic Brainbow technique, which takes advantage of the asynchronous behavior in Graphics Processing Unit (GPU) framebuffer loops and generates random colorizations for different structures in single-channel confocal data. The results from our Synthetic Brainbows, when applied to a sequence of developing cells, can then be used for tracking the movements of these cells. Finally, we present an application of FluoRender in the workflow of constructing anatomical atlases.
Keywords: confocal microscopy, visualization, software
G.H. Weber, K. Beketayev, P.-T. Bremer, B. Hamann, M. Haranczyk, M. Hlawitschka, V. Pascucci.
“Comprehensible Presentation of Topological Information,” No. LBNL-5693E, Lawrence Berkeley National Laboratory, 2013.
ABSTRACT
Topological information has proven very valuable in the analysis of scientific data. An important challenge that remains is presenting this highly abstract information in a way that it is comprehensible even if one does not have an in-depth background in topology. Furthermore, it is often desirable to combine the structural insight gained by topological analysis with complementary information, such as geometric information. We present an overview over methods that use metaphors to make topological information more accessible to non-expert users, and we demonstrate their applicability to a range of scientific data sets. With the increasingly complex output of exascale simulations, the importance of having effective means of providing a comprehensible, abstract overview over data will grow. The techniques that we present will serve as an important foundation for this purpose.
R.T. Whitaker, M. Mirzargar, R.M. Kirby.
“Contour Boxplots: A Method for Characterizing Uncertainty in Feature Sets from Simulation Ensembles,” In IEEE Transactions on Visualization and Computer Graphics, Vol. 19, No. 12, pp. 2713--2722. December, 2013.
DOI: 10.1109/TVCG.2013.143
PubMed ID: 24051838
ABSTRACT
Ensembles of numerical simulations are used in a variety of applications, such as meteorology or computational solid mechanics, in order to quantify the uncertainty or possible error in a model or simulation. Deriving robust statistics and visualizing the variability of an ensemble is a challenging task and is usually accomplished through direct visualization of ensemble members or by providing aggregate representations such as an average or pointwise probabilities. In many cases, the interesting quantities in a simulation are not dense fields, but are sets of features that are often represented as thresholds on physical or derived quantities. In this paper, we introduce a generalization of boxplots, called contour boxplots, for visualization and exploration of ensembles of contours or level sets of functions. Conventional boxplots have been widely used as an exploratory or communicative tool for data analysis, and they typically show the median, mean, confidence intervals, and outliers of a population. The proposed contour boxplots are a generalization of functional boxplots, which build on the notion of data depth. Data depth approximates the extent to which a particular sample is centrally located within its density function. This produces a center-outward ordering that gives rise to the statistical quantities that are essential to boxplots. Here we present a generalization of functional data depth to contours and demonstrate methods for displaying the resulting boxplots for two-dimensional simulation data in weather forecasting and computational fluid dynamics.
W. Widanagamaachchi, P. Rosen, V. Pascucci.
“A Flexible Framework for Fusing Image Collections into Panoramas,” In Proceedings of the 2013 SIBGRAPI Conference on Graphics, Patterns, and Images, Note: Awarded Best Paper., pp. 195-202. 2013.
DOI: 10.1109/SIBGRAPI.2013.35
ABSTRACT

Panoramas create summary views of multiple images, which make them a valuable means of analyzing huge quantities of image and video data. This paper introduces the Ray Graph - a general framework for panorama construction. With rays as its vertices, the Ray Graph uses its edges to specify a set of coherency relationships among all input rays. Consequently, by using a set of simple graph traversal rules, a diverse set of panorama structures can be enumerated, which can be used to efficiently and robustly generate panoramic images from image collections. To demonstrate this framework, we first use it to recreate both 360° and street panoramas. We further introduce two new panorama models, the centipede panorama - a hybrid of the 360° and street panoramas, and the storytelling panorama - a time encoding panorama. Finally, we demonstrate the flexibility of this framework by enabling interactive brushing of panoramic regions for removal of undesired features such as occlusions and moving objects.
E. Wong, S.P. Awate, P.T. Fletcher.
“Adaptive Sparsity in Gaussian Graphical Models,” In Proceedings of the 30th International Conference on Machine Learning (ICML), pp. (accepted). 2013.
ABSTRACT
An effective approach to structure learning and parameter estimation for Gaussian graphical models is to impose a sparsity prior, such as a Laplace prior, on the entries of the precision matrix. Such an approach involves a hyperparameter that must be tuned to control the amount of sparsity. In this paper, we introduce a parameter-free method for estimating a precision matrix with sparsity that adapts to the data automatically. We achieve this by formulating a hierarchical Bayesian model of the precision matrix with a noninformative Jeffreys' hyperprior. We also naturally enforce the symmetry and positivede definiteness constraints on the precision matrix by parameterizing it with the Cholesky decomposition. Experiments on simulated and real (cell signaling) data demonstrate that the proposed approach not only automatically adapts the sparsity of the model, but it also results in improved estimates of the precision matrix compared to the Laplace prior model with sparsity parameter chosen by cross-validation.
M. Zhang, N.P. Singh, P.T. Fletcher.
“Bayesian Estimation of Regularization and Atlas Building in Diffeomorphic Image Registration,” In Proceedings of the International Conference on Information Processing in Medical Imaging (IPMI), Lecture Notes in Computer Science (LNCS), pp. (accepted). 2013.
ABSTRACT
This paper presents a generative Bayesian model for diffeomorphic image registration and atlas building. We develop an atlas estimation procedure that simultaneously estimates the parameters controlling the smoothness of the diffeomorphic transformations. To achieve this, we introduce a Monte Carlo Expectation Maximization algorithm, where the expectation step is approximated via Hamiltonian Monte Carlo sampling on the manifold of diffeomorphisms. An added benefit of this stochastic approach is that it can successfully solve difficult registration problems involving large deformations, where direct geodesic optimization fails. Using synthetic data generated from the forward model with known parameters, we demonstrate the ability of our model to successfully recover the atlas and regularization parameters. We also demonstrate the effectiveness of the proposed method in the atlas estimation problem for 3D brain images.
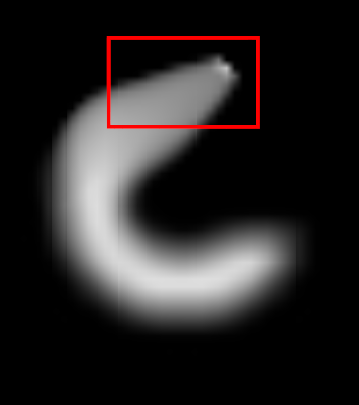
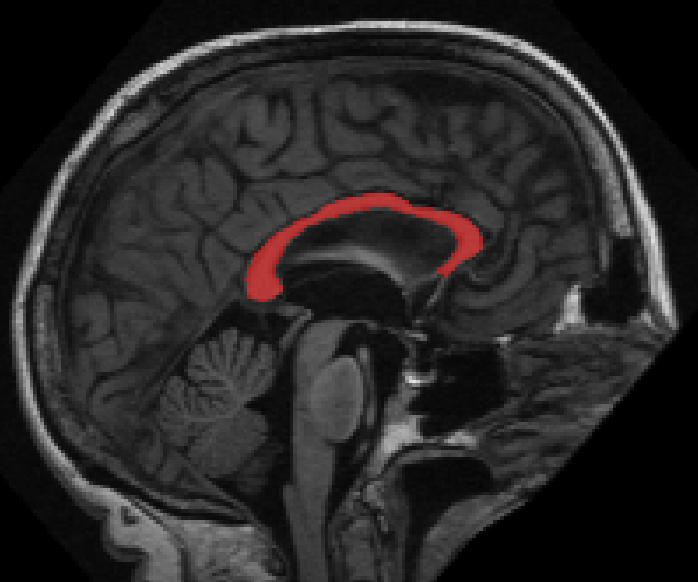
M. Zhang, P.T. Fletcher.
“Probabilistic Principal Geodesic Analysis,” In Proceedings of the 2013 Conference on Neural Information Processing Systems (NIPS), pp. (accepted). 2013.
ABSTRACT
Principal geodesic analysis (PGA) is a generalization of principal component analysis (PCA) for dimensionality reduction of data on a Riemannian manifold. Currently PGA is defined as a geometric fit to the data, rather than as a probabilistic model. Inspired by probabilistic PCA, we present a latent variable model for PGA that provides a probabilistic framework for factor analysis on manifolds. To compute maximum likelihood estimates of the parameters in our model, we develop a Monte Carlo Expectation Maximization algorithm, where the expectation is approximated by Hamiltonian Monte Carlo sampling of the latent variables. We demonstrate the ability of our method to recover the ground truth parameters in simulated sphere data, as well as its effectiveness in analyzing shape variability of a corpus callosum data set from human brain images.
L. Zhou, C.D. Hansen.
“Transfer Function Design based on User Selected Samples for Intuitive Multivariate Volume Exploration,” In Proceedings of the 2013 IEEE Pacific Visualization Symposium (PacificVis), pp. 73--80. 2013.
ISSN: 2165-8765
DOI: 10.1109/PacificVis.2013.6596130
ABSTRACT
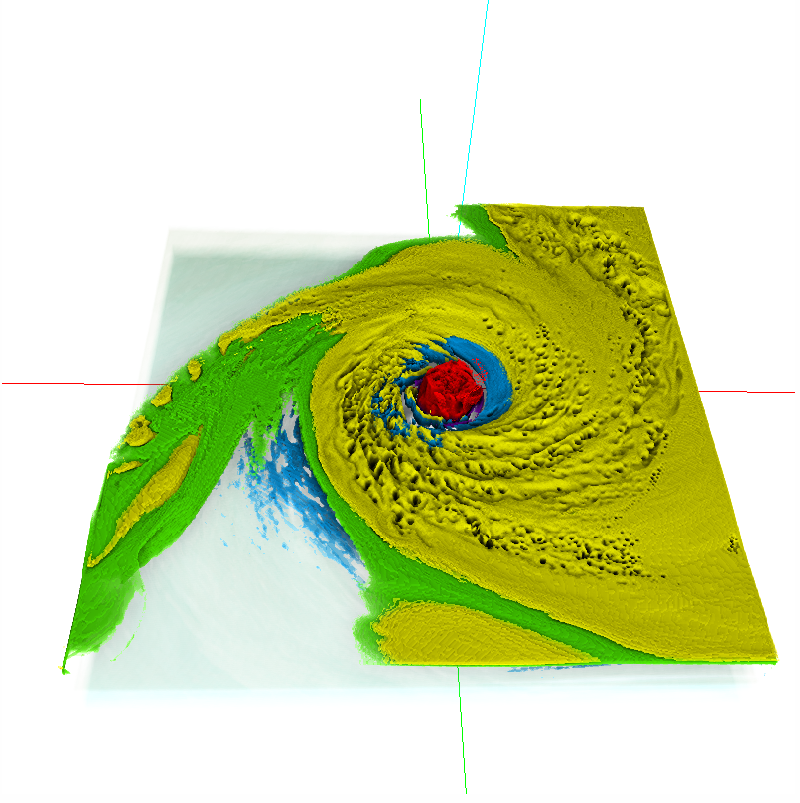
Multivariate volumetric datasets are important to both science and medicine. We propose a transfer function (TF) design approach based on user selected samples in the spatial domain to make multivariate volumetric data visualization more accessible for domain users. Specifically, the user starts the visualization by probing features of interest on slices and the data values are instantly queried by user selection. The queried sample values are then used to automatically and robustly generate high dimensional transfer functions (HDTFs) via kernel density estimation (KDE). Alternatively, 2D Gaussian TFs can be automatically generated in the dimensionality reduced space using these samples. With the extracted features rendered in the volume rendering view, the user can further refine these features using segmentation brushes. Interactivity is achieved in our system and different views are tightly linked. Use cases show that our system has been successfully applied for simulation and complicated seismic data sets.
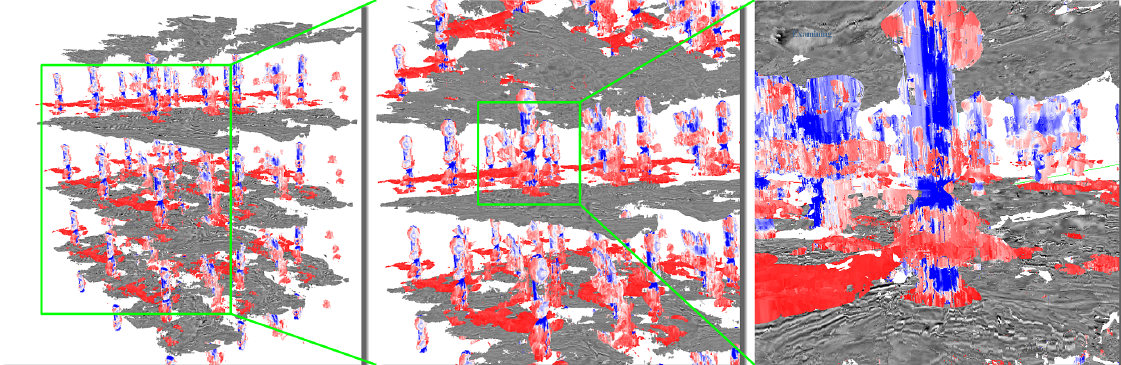
L. Zhou, C.D. Hansen.
“Interactive rendering and efficient querying for large multivariate seismic volumes on consumer level PCs,” In Proceedings of the 2013 IEEE Symposium on Large-Scale Data Analysis and Visualization (LDAV), pp. 117--118. 2013.
DOI: 10.1109/LDAV.2013.6675167
ABSTRACT
We present a volume visualization method that allows interactive rendering and efficient querying of large multivariate seismic volume data on consumer level PCs. The volume rendering pipeline utilizes a virtual memory structure that supports out-of-core multivariate multi-resolution data and a GPU-based ray caster that allows interactive multivariate transfer function design. A Gaussian mixture model representation is precomputed and nearly interactive querying is achieved by testing the Gaussian functions against user defined transfer functions on the GPU in the runtime. Finally, the method has been tested on a multivariate 3D seismic dataset which is larger than the size of the main memory of the testing machine.
X. Zhu, Y. Gur, W. Wang, P.T. Fletcher.
“Model Selection and Estimation of Multi-Compartment Models in Diffusion MRI with a Rician Noise Model,” In Proceedings of the International Conference on Information Processing in Medical Imaging (IPMI), Lecture Notes in Computer Science (LNCS), Vol. 23, pp. 644--655. 2013.
PubMed ID: 24684006
ABSTRACT

Multi-compartment models in diffusion MRI (dMRI) are used to describe complex white matter fiber architecture of the brain. In this paper, we propose a novel multi-compartment estimation method based on the ball-and-stick model, which is composed of an isotropic diffusion compartment (\"ball\") as well as one or more perfectly linear diffusion compartments (\"sticks\"). To model the noise distribution intrinsic to dMRI measurements, we introduce a Rician likelihood term and estimate the model parameters by means of an Expectation Maximization (EM) algorithm. This paper also addresses the problem of selecting the number of fiber compartments that best fit the data, by introducing a sparsity prior on the volume mixing fractions. This term provides automatic model selection and enables us to discriminate different fiber populations. When applied to simulated data, our method provides accurate estimates of the fiber orientations, diffusivities, and number of compartments, even at low SNR, and outperforms similar methods that rely on a Gaussian noise distribution assumption. We also apply our method to
in vivo brain data and show that it can successfully capture complex fiber structures that match the known anatomy.
2012
Y.-J. Ahn, C. Hoffmann, P. Rosen.
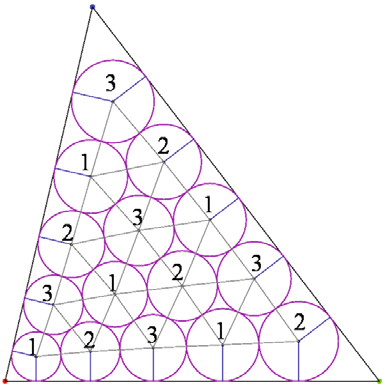
“A Note on Circle Packing,” In Journal of Zhejiang University SCIENCE C, Vol. 13, No. 8, pp. 559--564. 2012.
ABSTRACT
The problem of packing circles into a domain of prescribed topology is considered. The circles need not have equal radii. The Collins-Stephenson algorithm computes such a circle packing. This algorithm is parallelized in two different ways and its performance is reported for a triangular, planar domain test case. The implementation uses the highly parallel graphics processing unit (GPU) on commodity hardware. The speedups so achieved are discussed based on a number of experiments.
Keywords: Circle packing, Algorithm performance, Parallel computation, Graphics processing unit (GPU)
N.W. Akoum, C.J. McGann, G. Vergara, T. Badger, R. Ranjan, C. Mahnkopf, E.G. Kholmovski, R.S. Macleod, N.F. Marrouche.
“Atrial Fibrosis Quantified Using Late Gadolinium Enhancement MRI is AssociatedWith Sinus Node Dysfunction Requiring Pacemaker Implant,” In Journal of Cardiovascular Electrophysiology, Vol. 23, No. 1, pp. 44--50. 2012.
DOI: 10.1111/j.1540-8167.2011.02140.x
ABSTRACT
Atrial Fibrosis and Sinus Node Dysfunction. Introduction: Sinus node dysfunction (SND) commonly manifests with atrial arrhythmias alternating with sinus pauses and sinus bradycardia. The underlying process is thought to be because of atrial fibrosis. We assessed the value of atrial fibrosis, quantified using Late Gadolinium Enhanced-MRI (LGE-MRI), in predicting significant SND requiring pacemaker implant.
Methods: Three hundred forty-four patients with atrial fibrillation (AF) presenting for catheter ablation underwent LGE-MRI. Left atrial (LA) fibrosis was quantified in all patients and right atrial (RA) fibrosis in 134 patients. All patients underwent catheter ablation with pulmonary vein isolation with posterior wall and septal debulking. Patients were followed prospectively for 329 ± 245 days. Ambulatory monitoring was instituted every 3 months. Symptomatic pauses and bradycardia were treated with pacemaker implantation per published guidelines.
Results: The average patient age was 65 ± 12 years. The average wall fibrosis was 16.7 ± 11.1% in the LA, and 5.3 ± 6.4% in the RA. RA fibrosis was correlated with LA fibrosis (R2= 0.26; P < 0.01). Patients were divided into 4 stages of LA fibrosis (Utah I: 35%). Twenty-two patients (mean atrial fibrosis, 23.9%) required pacemaker implantation during follow-up. Univariate and multivariate analysis identified LA fibrosis stage (OR, 2.2) as a significant predictor for pacemaker implantation with an area under the curve of 0.704.
Conclusions: In patients with AF presenting for catheter ablation, LGE-MRI quantification of atrial fibrosis demonstrates preferential LA involvement. Significant atrial fibrosis is associated with clinically significant SND requiring pacemaker implantation. (J Cardiovasc Electrophysiol, Vol. 23, pp. 44-50, January 2012)
G.A. Ateshian, S.A. Maas, J.A. Weiss.
“Solute transport across a contact interface in deformable porous media,” In Journal of Biomechanics, Vol. 45, No. 6, pp. 1023-–1027. 2012.
DOI: 10.1016/j.jbiomech.2012.01.003
ABSTRACT
A finite element formulation of neutral solute transport across a contact interface between deformable porous media is implemented and validated against analytical solutions. By reducing the integral statements of external virtual work on the two contacting surfaces into a single contact integral, the algorithm automatically enforces continuity of solute molar flux across the contact interface, whereas continuity of the effective solute concentration (a measure of the solute mechano-chemical potential) is achieved using a penalty method. This novel formulation facilitates the analysis of problems in biomechanics where the transport of metabolites across contact interfaces of deformable tissues may be of interest. This contact algorithm is the first to address solute transport across deformable interfaces, and is made available in the public domain, open-source finite element code FEBio (http://www.febio.org).
Keywords: FEBio, Finite element modeling, Contact mechanics, Solute transport, Porous media, Biphasic theory
S.P. Awate, P. Zhu, R.T. Whitaker.
“How Many Templates Does It Take for a Good Segmentation?: Error Analysis in Multiatlas Segmentation as a Function of Database Size,” In Int. Workshop Multimodal Brain Image Analysis (MBIA) at Int. Conf. MICCAI, Lecture Notes in Computer Science (LNCS), Vol. 2, Note: Recieved Best Paper Award, pp. 103--114. 2012.
PubMed ID: 24501720
PubMed Central ID: PMC3910563
ABSTRACT
This paper proposes a novel formulation to model and analyze the statistical characteristics of some types of segmentation problems that are based on combining label maps / templates / atlases. Such segmentation-by-example approaches are quite powerful on their own for several clinical applications and they provide prior information, through spatial context, when combined with intensity-based segmentation methods. The proposed formulation models a class of multiatlas segmentation problems as nonparametric regression problems in the high-dimensional space of images. The paper presents a systematic analysis of the nonparametric estimation's convergence behavior (i.e. characterizing segmentation error as a function of the size of the multiatlas database) and shows that it has a specific analytic form involving several parameters that are fundamental to the specific segmentation problem (i.e. chosen anatomical structure, imaging modality, registration method, label-fusion algorithm, etc.). We describe how to estimate these parameters and show that several brain anatomical structures exhibit the trends determined analytically. The proposed framework also provides per-voxel confidence measures for the segmentation. We show that the segmentation error for large database sizes can be predicted using small-sized databases. Thus, small databases can be exploited to predict the database sizes required (\"how many templates\") to achieve \"good\" segmentations having errors lower than a specified tolerance. Such cost-benefit analysis is crucial for designing and deploying multiatlas segmentation systems.
A. Barg, N. Knupp, H.B. Henninger, L. Zwicky, B. Hintermann.
“Total ankle replacement using HINTEGRA, an unconstrained, three-component system: surgical technique and pitfalls,” In Foot and Ankle Clinics, Vol. 17, No. 4, pp. 607--635. 2012.
DOI: 10.1016/j.fcl.2012.08.006