


Visualization
Visualization, sometimes referred to as visual data analysis, uses the graphical representation of data as a means of gaining understanding and insight into the data. Visualization research at SCI has focused on applications spanning computational fluid dynamics, medical imaging and analysis, biomedical data analysis, healthcare data analysis, weather data analysis, poetry, network and graph analysis, financial data analysis, etc.Research involves novel algorithm and technique development to building tools and systems that assist in the comprehension of massive amounts of (scientific) data. We also research the process of creating successful visualizations.
We strongly believe in the role of interactivity in visual data analysis. Therefore, much of our research is concerned with creating visualizations that are intuitive to interact with and also render at interactive rates.
Visualization at SCI includes the academic subfields of Scientific Visualization, Information Visualization and Visual Analytics.


Mike Kirby
Uncertainty Visualization

Alex Lex
Information Visualization
Centers and Labs:
- Visualization Design Lab (VDL)
- CEDMAV
- POWDER Display Wall
- Modeling, Display, and Understanding Uncertainty in Simulations for Policy Decision Making
- Topological Data Analysis for Large Network Visualization
Funded Research Projects:
Publications in Visualization:
|
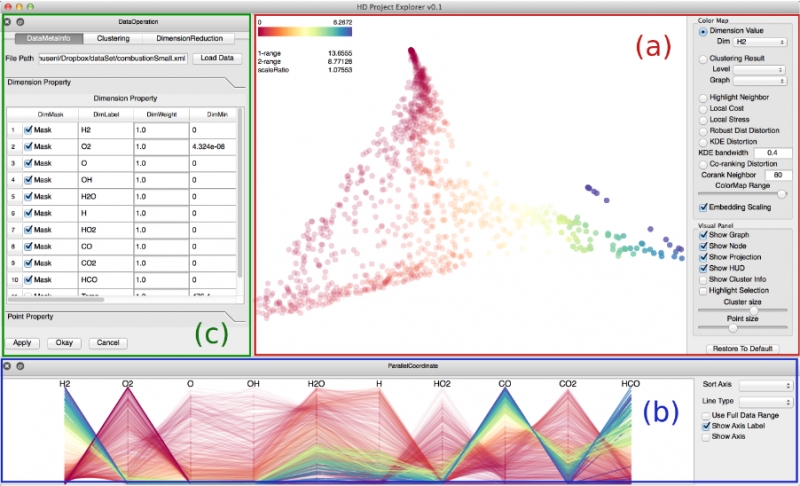
  Distortion-Guided Structure-Driven Interactive Exploration of High-Dimensional Data S. Liu, Bei Wang, P.-T. Bremer, V. Pascucci. In Computer Graphics Forum, Vol. 33, No. 3, Wiley-Blackwell, pp. 101--110. June, 2014. Dimension reduction techniques are essential for feature selection and feature extraction of complex high-dimensional data. These techniques, which construct low-dimensional representations of data, are typically geometrically motivated, computationally efficient and approximately preserve certain structural properties of the data. However, they are often used as black box solutions in data exploration and their results can be difficult to interpret. To assess the quality of these results, quality measures, such as co-ranking [ LV09 ], have been proposed to quantify structural distortions that occur between high-dimensional and low-dimensional data representations. Such measures could be evaluated and visualized point-wise to further highlight erroneous regions [ MLGH13 ]. In this work, we provide an interactive visualization framework for exploring high-dimensional data via its two-dimensional embeddings obtained from dimension reduction, using a rich set of user interactions. We ask the following question: what new insights do we obtain regarding the structure of the data, with interactive manipulations of its embeddings in the visual space? We augment the two-dimensional embeddings with structural abstrac- tions obtained from hierarchical clusterings, to help users navigate and manipulate subsets of the data. We use point-wise distortion measures to highlight interesting regions in the domain, and further to guide our selection of the appropriate level of clusterings that are aligned with the regions of interest. Under the static setting, point-wise distortions indicate the level of structural uncertainty within the embeddings. Under the dynamic setting, on-the-fly updates of point-wise distortions due to data movement and data deletion reflect structural relations among different parts of the data, which may lead to new and valuable insights. |
|
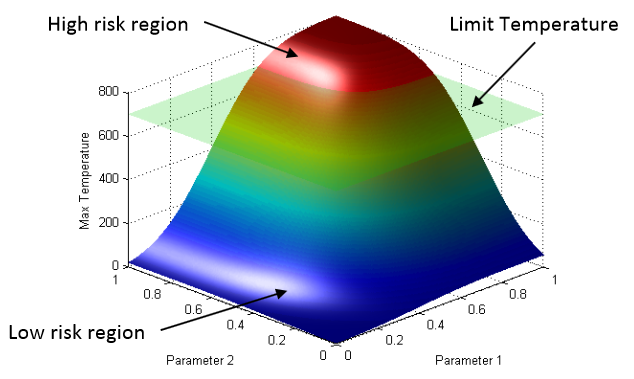
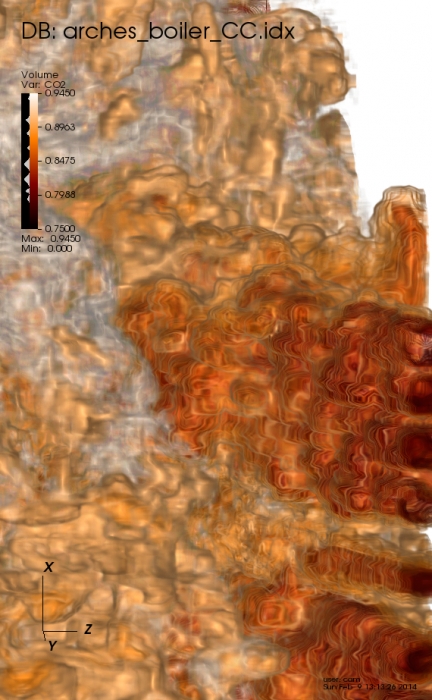
Overview of New Tools to Perform Safety Analysis: BWR Station Black Out Test Case D. Mandelli, C. Smith, T. Riley, J. Nielsen, J. Schroeder, C. Rabiti, A. Alfonsi, J. Cogliati, R. Kinoshita, V. Pascucci, Bei Wang, D. Maljovec. In Proceedings of the Probabilistic Safety Assessment & Management conference (PSAM), 2014. The existing fleet of nuclear power plants is in the process of extending its lifetime and increasing the power generated from these plants via power uprates. In order to evaluate the impacts of these two factors on the safety of the plant, the Risk Informed Safety Margin Characterization project aims to provide insights to decision makers through a series of simulations of the plant dynamics for different initial conditions (e.g., probabilistic analysis and uncertainty quantification). This paper focuses on the impacts of power uprate on the safety margin of a boiling water reactor for a station black-out event. Analysis is performed by using a combination of thermal-hydraulic codes and a stochastic analysis tool currently under development at the Idaho National Laboratory, i.e. RAVEN. We employed both classical statistical tools, i.e. Monte-Carlo, and more advanced machine learning based algorithms to perform uncertainty quantification in order to quantify changes in system performance and limitations as a consequence of power uprate. We also employed advanced data analysis and visualization tools that helped us to correlate simulation outcomes such as maximum core temperature with a set of input uncertain parameters. Results obtained give a detailed investigation of the issues associated with a plant power uprate including the effects of station black-out accident scenarios. We were able to quantify how the timing of specific events was impacted by a higher nominal reactor core power. Such safety insights can provide useful information to the decision makers to perform risk-informed margins management. |
|
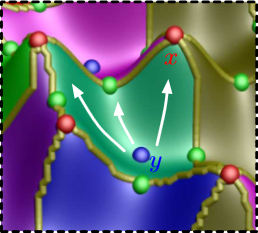
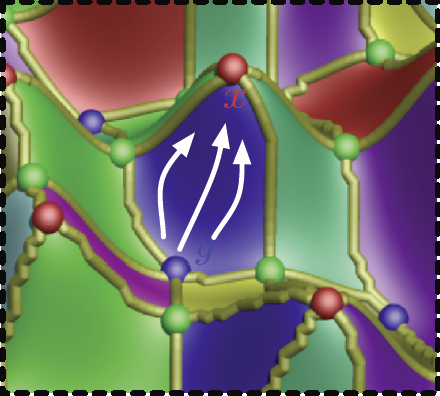
Analyzing Simulation-Based PRA Data Through Clustering: a BWR Station Blackout Case Study D. Maljovec, S. Liu, Bei Wang, V. Pascucci, P.-T. Bremer, D. Mandelli, C. Smith. In Proceedings of the Probabilistic Safety Assessment & Management conference (PSAM), 2014. Dynamic probabilistic risk assessment (DPRA) methodologies couple system simulator codes (e.g., RELAP, MELCOR) with simulation controller codes (e.g., RAVEN, ADAPT). Whereas system simulator codes accurately model system dynamics deterministically, simulation controller codes introduce both deterministic (e.g., system control logic, operating procedures) and stochastic (e.g., component failures, parameter uncertainties) elements into the simulation. Typically, a DPRA is performed by 1) sampling values of a set of parameters from the uncertainty space of interest (using the simulation controller codes), and 2) simulating the system behavior for that specific set of parameter values (using the system simulator codes). For complex systems, one of the major challenges in using DPRA methodologies is to analyze the large amount of information (i.e., large number of scenarios ) generated, where clustering techniques are typically employed to allow users to better organize and interpret the data. In this paper, we focus on the analysis of a nuclear simulation dataset that is part of the risk-informed safety margin characterization (RISMC) boiling water reactor (BWR) station blackout (SBO) case study. We apply a software tool that provides the domain experts with an interactive analysis and visualization environment for understanding the structures of such high-dimensional nuclear simulation datasets. Our tool encodes traditional and topology-based clustering techniques, where the latter partitions the data points into clusters based on their uniform gradient flow behavior. We demonstrate through our case study that both types of clustering techniques complement each other in bringing enhanced structural understanding of the data. Keywords: PRA, computational topology, clustering, high-dimensional analysis |
Topological Methods in Data Analysis and Visualization III Edited by Peer-Timo Bremer and Ingrid Hotz and Valerio Pascucci and Ronald Peikert, Springer International Publishing, 2014. ISBN: 978-3-319-04099-8 |
|
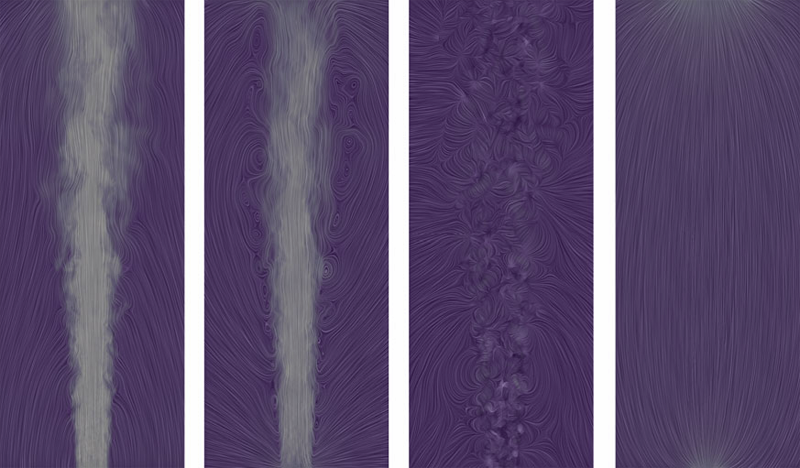
The Natural Helmholtz-Hodge Decomposition For Open-Boundary Flow Analysis H. Bhatia, V. Pascucci, P.-T. Bremer. In IEEE Transactions on Visualization and Computer Graphics (TVCG), Vol. 99, pp. 1566--1578. 2014. DOI: 10.1109/TVCG.2014.2312012 The Helmholtz-Hodge decomposition (HHD) describes a flow as the sum of an incompressible, an irrotational, and a harmonic flow, and is a fundamental tool for simulation and analysis. Unfortunately, for bounded domains, the HHD is not uniquely defined, and traditionally, boundary conditions are imposed to obtain a unique solution. However, in general, the boundary conditions used during the simulation may not be known and many simulations use open boundary conditions. In these cases, the flow imposed by traditional boundary conditions may not be compatible with the given data, which leads to sometimes drastic artifacts and distortions in all three components, hence producing unphysical results. Instead, this paper proposes the natural HHD, which is defined by separating the flow into internal and external components. Using a completely data-driven approach, the proposed technique obtains uniqueness without assuming boundary conditions a priori. As a result, it enables a reliable and artifact-free analysis for flows with open boundaries or unknown boundary conditions. Furthermore, our approach computes the HHD on a point-wise basis in contrast to the existing global techniques, and thus supports computing inexpensive local approximations for any subset of the domain. Finally, the technique is easy to implement for a variety of spatial discretizations and interpolated fields in both two and three dimensions. |
|
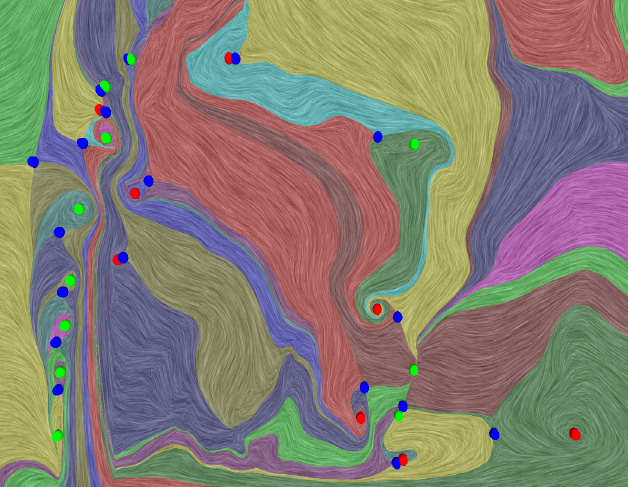
Extracting Features from Time-Dependent Vector Fields Using Internal Reference Frames H. Bhatia, V. Pascucci, R.M. Kirby, P.-T. Bremer. In Computer Graphics Forum, Vol. 33, No. 3, pp. 21--30. June, 2014. DOI: 10.1111/cgf.12358 Extracting features from complex, time-dependent flow fields remains a significant challenge despite substantial research efforts, especially because most flow features of interest are defined with respect to a given reference frame. Pathline-based techniques, such as the FTLE field, are complex to implement and resource intensive, whereas scalar transforms, such as λ2, often produce artifacts and require somewhat arbitrary thresholds. Both approaches aim to analyze the flow in a more suitable frame, yet neither technique explicitly constructs one. |
|
Topology-Based Active Learning SCI Technical Report, D. Maljovec, Bei Wang, J. Moeller, V. Pascucci. No. UUSCI-2014-001, SCI Institute, University of Utah, 2014. A common problem in simulation and experimental research involves obtaining time-consuming, expensive, or potentially hazardous samples from an arbitrary dimension parameter space. For example, many simulations modeled on supercomputers can take days or weeks to complete, so it is imperative to select samples in the most informative and interesting areas of the parameter space. In such environments, maximizing the potential gain of information is achieved through active learning (adaptive sampling). Though the topic of active learning is well-studied, this paper provides a new perspective on the problem. We consider topologybased batch selection strategies for active learning which are ideal for environments where parallel or concurrent experiments are able to be run, yet each has a heavy cost. These strategies utilize concepts derived from computational topology to choose a collection of locally distinct, optimal samples before updating the surrogate model. We demonstrate through experiments using a several different batch sizes that topology-based strategies have comparable and sometimes superior performance, compared to conventional approaches. |
|
Fast Multi-Resolution Reads of Massive Simulation Datasets S. Kumar, C. Christensen, P.-T. Bremer, E. Brugger, V. Pascucci, J. Schmidt, M. Berzins, H. Kolla, J. Chen, V. Vishwanath, P. Carns, R. Grout. In Proceedings of the International Supercomputing Conference ISC'14, Leipzig, Germany, June, 2014. Today's massively parallel simulation code can produce output ranging up to many terabytes of data. Utilizing this data to support scientific inquiry requires analysis and visualization, yet the sheer size of the data makes it cumbersome or impossible to read without computational resources similar to the original simulation. We identify two broad classes of problems for reading data and present effective solutions for both. The first class of data reads depends on user requirements and available resources. Tasks such as visualization and user-guided analysis may be accomplished using only a subset of variables with restricted spatial extents at a reduced resolution. The other class of reads require full resolution multi-variate data to be loaded, for example to restart a simulation. We show that utilizing the hierarchical multi-resolution IDX data format enables scalable and efficient serial and parallel read access on a variety of hardware from supercomputers down to portable devices. We demonstrate interactive view-dependent visualization and analysis of massive scientific datasets using low-power commodity hardware, and we compare read performance with other parallel file formats for both full and partial resolution data. |
| Freeprocessing: Transparent in situ visualization via data interception T. Fogal, F. Proch, A. Schiewe, O. Hasemann, A. Kempf, J. Krüger. In Proceedings of the 14th Eurographics Conference on Parallel Graphics and Visualization, EGPGV, Eurographics Association, 2014. In situ visualization has become a popular method for avoiding the slowest component of many visualization pipelines: reading data from disk. Most previous in situ work has focused on achieving visualization scalability on par with simulation codes, or on the data movement concerns that become prevalent at extreme scales. In this work, we consider in situ analysis with respect to ease of use and programmability. We describe an abstraction that opens up new applications for in situ visualization, and demonstrate that this abstraction and an expanded set of use cases can be realized without a performance cost. |
|
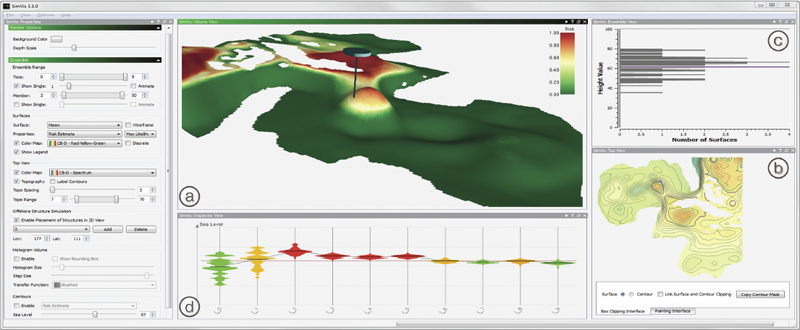
Ovis: A Framework for Visual Analysis of Ocean Forecast Ensembles T. Hollt, A. Magdy, P. Zhan, G. Chen, G. Gopalakrishnan, I. Hoteit, C.D. Hansen, M. Hadwiger. In IEEE Transactions on Visualization and Computer Graphics (TVCG), Vol. PP, No. 99, pp. 1. 2014. DOI: 10.1109/TVCG.2014.2307892 We present a novel integrated visualization system that enables interactive visual analysis of ensemble simulations of the sea surface height that is used in ocean forecasting. The position of eddies can be derived directly from the sea surface height and our visualization approach enables their interactive exploration and analysis. The behavior of eddies is important in different application settings of which we present two in this paper. First, we show an application for interactive planning of placement as well as operation of off-shore structures using real-world ensemble simulation data of the Gulf of Mexico. Off-shore structures, such as those used for oil exploration, are vulnerable to hazards caused by eddies, and the oil and gas industry relies on ocean forecasts for efficient operations. We enable analysis of the spatial domain, as well as the temporal evolution, for planning the placement and operation of structures. Eddies are also important for marine life. They transport water over large distances and with it also heat and other physical properties as well as biological organisms. In the second application we present the usefulness of our tool, which could be used for planning the paths of autonomous underwater vehicles, so called gliders, for marine scientists to study simulation data of the largely unexplored Red Sea. Keywords: Ensemble Visualization, Ocean Visualization, Ocean Forecast, Risk Estimation |
|
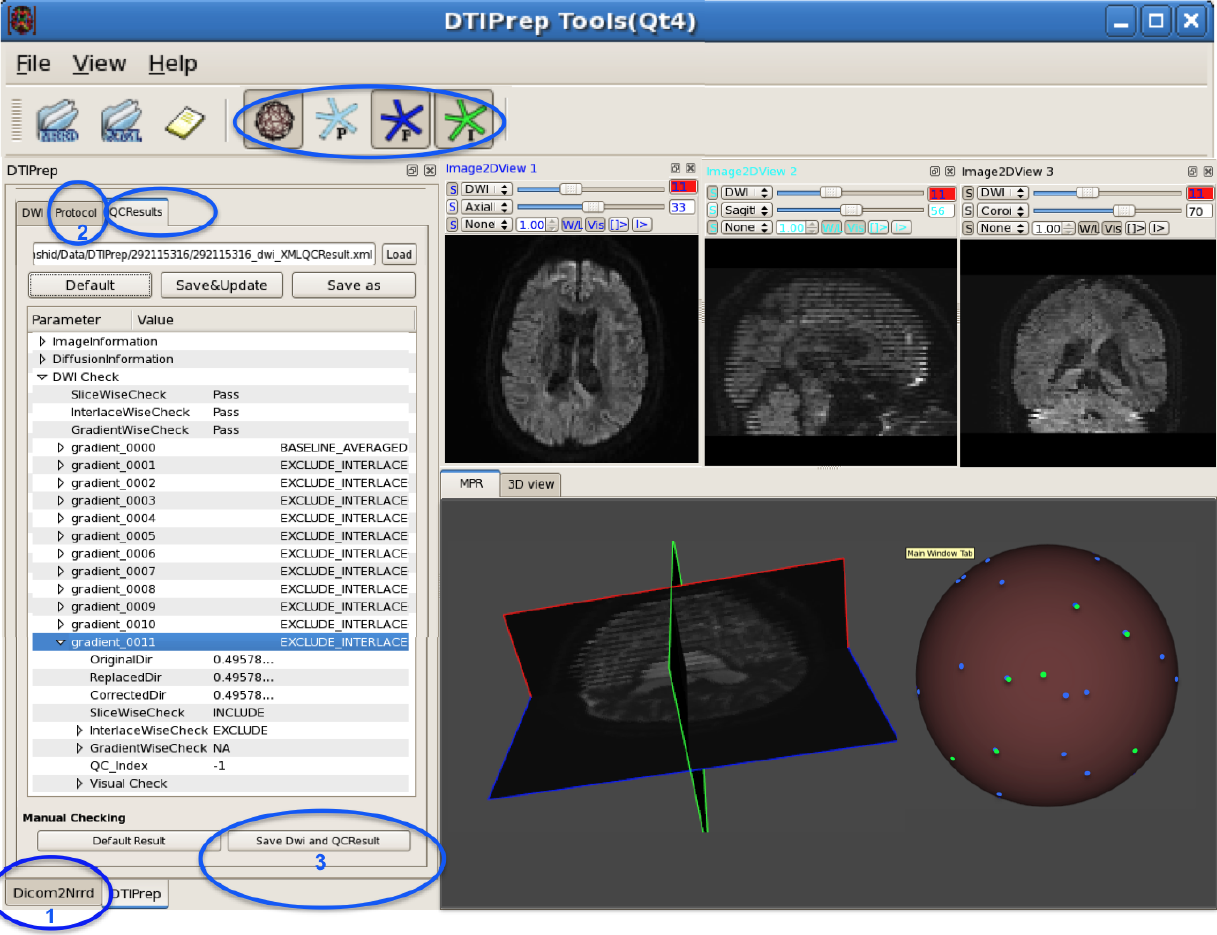
DTIPrep: Quality Control of Diffusion-Weighted Images I. Oguz, M. Farzinfar, J. Matsui, F. Budin, Z. Liu, G. Gerig, H.J. Johnson, M.A. Styner. In Frontiers in Neuroinformatics, Vol. 8, No. 4, 2014. DOI: 10.3389/fninf.2014.00004 In the last decade, diffusion MRI (dMRI) studies of the human and animal brain have been used to investigate a multitude of pathologies and drug-related effects in neuroscience research. Study after study identifies white matter (WM) degeneration as a crucial biomarker for all these diseases. The tool of choice for studying WM is dMRI. However, dMRI has inherently low signal-to-noise ratio and its acquisition requires a relatively long scan time; in fact, the high loads required occasionally stress scanner hardware past the point of physical failure. As a result, many types of artifacts implicate the quality of diffusion imagery. Using these complex scans containing artifacts without quality control (QC) can result in considerable error and bias in the subsequent analysis, negatively affecting the results of research studies using them. However, dMRI QC remains an under-recognized issue in the dMRI community as there are no user-friendly tools commonly available to comprehensively address the issue of dMRI QC. As a result, current dMRI studies often perform a poor job at dMRI QC. Thorough QC of diffusion MRI will reduce measurement noise and improve reproducibility, and sensitivity in neuroimaging studies; this will allow researchers to more fully exploit the power of the dMRI technique and will ultimately advance neuroscience. Therefore, in this manuscript, we present our open-source software, DTIPrep, as a unified, user friendly platform for thorough quality control of dMRI data. These include artifacts caused by eddy-currents, head motion, bed vibration and pulsation, venetian blind artifacts, as well as slice-wise and gradient-wise intensity inconsistencies. This paper summarizes a basic set of features of DTIPrep described earlier and focuses on newly added capabilities related to directional artifacts and bias analysis. Keywords: diffusion MRI, Diffusion Tensor Imaging, Quality control, Software, open-source, preprocessing |
| Entourage: Visualizing Relationships between Biological Pathways using Contextual Subsets A. Lex, C. Partl, D. Kalkofen, M. Streit, A. Wasserman, S. Gratzl, D. Schmalstieg, H. Pfister. In IEEE Transactions on Visualization and Computer Graphics (InfoVis '13), Vol. 19, No. 12, pp. 2536--2545. 2013. ISSN: 1077-2626 DOI: 10.1109/TVCG.2013.154 Biological pathway maps are highly relevant tools for many tasks in molecular biology. They reduce the complexity of the overall biological network by partitioning it into smaller manageable parts. While this reduction of complexity is their biggest strength, it is, at the same time, their biggest weakness. By removing what is deemed not important for the primary function of the pathway, biologists lose the ability to follow and understand cross-talks between pathways. Considering these cross-talks is, however, critical in many analysis scenarios, such as, judging effects of drugs. |
| LineUp: Visual Analysis of Multi-Attribute Rankings S. Gratzl, A. Lex, N. Gehlenborg, H. Pfister,, M. Streit. In IEEE Transactions on Visualization and Computer Graphics (InfoVis '13), Vol. 19, No. 12, pp. 2277--2286. 2013. ISSN: 1077-2626 DOI: 10.1109/TVCG.2013.173 Rankings are a popular and universal approach to structure otherwise unorganized collections of items by computing a rank for each item based on the value of one or more of its attributes. This allows us, for example, to prioritize tasks or to evaluate the performance of products relative to each other. While the visualization of a ranking itself is straightforward, its interpretation is not because the rank of an item represents only a summary of a potentially complicated relationship between its attributes and those of the other items. It is also common that alternative rankings exist that need to be compared and analyzed to gain insight into how multiple heterogeneous attributes affect the rankings. Advanced visual exploration tools are needed to make this process efficient. |
| enRoute: Dynamic Path Extraction from Biological Pathway Maps for Exploring Heterogeneous Experimental Datasets C. Partl, A. Lex, M. Streit, D. Kalkofen, K. Kashofer, D. Schmalstieg. In BMC Bioinformatics, Vol. 14, No. Suppl 19, Nov, 2013. ISSN: 1471-2105 DOI: 10.1186/1471-2105-14-S19-S3 Jointly analyzing biological pathway maps and experimental data is critical for understanding how biological processes work in different conditions and why different samples exhibit certain characteristics. This joint analysis, however, poses a significant challenge for visualization. Current techniques are either well suited to visualize large amounts of pathway node attributes, or to represent the topology of the pathway well, but do not accomplish both at the same time. To address this we introduce enRoute, a technique that enables analysts to specify a path of interest in a pathway, extract this path into a separate, linked view, and show detailed experimental data associated with the nodes of this extracted path right next to it. This juxtaposition of the extracted path and the experimental data allows analysts to simultaneously investigate large amounts of potentially heterogeneous data, thereby solving the problem of joint analysis of topology and node attributes. As this approach does not modify the layout of pathway maps, it is compatible with arbitrary graph layouts, including those of hand-crafted, image-based pathway maps. We demonstrate the technique in context of pathways from the KEGG and the Wikipathways databases. We apply experimental data from two public databases, the Cancer Cell Line Encyclopedia (CCLE) and The Cancer Genome Atlas (TCGA) that both contain a wide variety of genomic datasets for a large number of samples. In addition, we make use of a smaller dataset of hepatocellular carcinoma and common xenograft models. To verify the utility of enRoute, domain experts conducted two case studies where they explore data from the CCLE and the hepatocellular carcinoma datasets in the context of relevant pathways. |
|
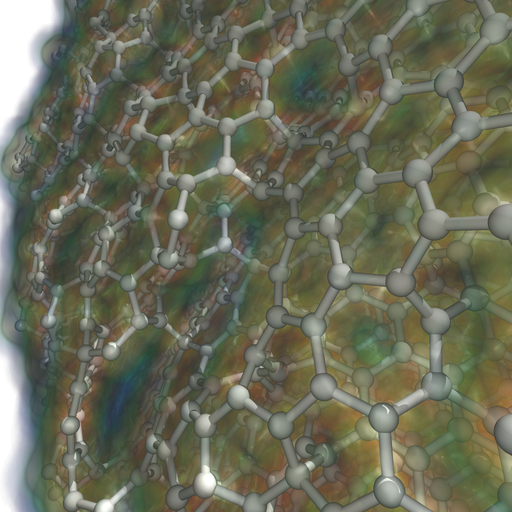
Ray Tracing and Volume Rendering Large Molecular Data on Multi-core and Many-core Architectures. A. Knoll, I. Wald, P. Navratil, M. E Papka,, K. P Gaither. In Proc. 8th International Workshop on Ultrascale Visualization at SC13 (Ultravis), 2013, 2013. Visualizing large molecular data requires efficient means of rendering millions of data elements that combine glyphs, geometry and volumetric techniques. The geometric and volumetric loads challenge traditional rasterization-based vis methods. Ray casting presents a scalable and memory- efficient alternative, but modern techniques typically rely on GPU-based acceleration to achieve interactive rendering rates. In this paper, we present bnsView, a molecular visualization ray tracing framework that delivers fast volume rendering and ball-and-stick ray casting on both multi-core CPUs andmany-core Intel ® Xeon PhiTM co-processors, implemented in a SPMD language that generates efficient SIMD vector code for multiple platforms without source modification. We show that our approach running on co- processors is competitive with similar techniques running on GPU accelerators, and we demonstrate large-scale parallel remote visualization from TACC's Stampede supercomputer to large-format display walls using this system. |
International Journal for Uncertainty Quantification, Subtitled “Special Issue on Working with Uncertainty: Representation, Quantification, Propagation, Visualization, and Communication of Uncertainty,” C.R. Johnson, A. Pang (Eds.). In Int. J. Uncertainty Quantification, Vol. 3, No. 3, Begell House, Inc., 2013. ISSN: 2152-5080 DOI: 10.1615/Int.J.UncertaintyQuantification.v3.i3 |
International Journal for Uncertainty Quantification, Subtitled “Special Issue on Working with Uncertainty: Representation, Quantification, Propagation, Visualization, and Communication of Uncertainty,” C.R. Johnson, A. Pang (Eds.). In Int. J. Uncertainty Quantification, Vol. 3, No. 2, Begell House, Inc., pp. vii--viii. 2013. ISSN: 2152-5080 DOI: 10.1615/Int.J.UncertaintyQuantification.v3.i2 |
| The impact of display bezels on stereoscopic vision for tiled displays J. Grüninger, J. Krüger. In Proceedings of the 19th ACM Symposium on Virtual Reality Software and Technology (VRST), pp. 241--250. 2013. DOI: 10.1145/2503713.2503717 In recent years high-resolution tiled display systems have gained significant attention in scientific and information visualization of large-scale data. Modern tiled display setups are based on either video projectors or LCD screens. While LCD screens are the preferred solution for monoscopic setups, stereoscopic displays almost exclusively consist of some kind of video projection. This is because projections can significantly reduce gaps between tiles, while LCD screens require a bezel around the panel. Projection setups, however, suffer from a number of maintenance issues that are avoided by LCD screens. For example, projector alignment is a very time-consuming task that needs to be repeated at intervals, and different aging states of lamps and filters cause color inconsistencies. The growing availability of inexpensive stereoscopic LCDs for television and gaming allows one to build high-resolution stereoscopic tiled display walls with the same dimensions and resolution as projection systems at a fraction of the cost, while avoiding the aforementioned issues. The only drawback is the increased gap size between tiles. |
|
Visualization Collaborations: What Works and Why R.M. Kirby, M.D. Meyer. In IEEE Computer Graphics and Applications: Visualization Viewpoints, Vol. 33, No. 6, pp. 82--88. 2013. In 1987, Bruce McCormick and his colleagues outlined the current state and future vision of visualization in scientific computing.1 That same year, Donna Cox pioneered her concept of the "Renaissance team"-a multidisciplinary team of experts focused on solving visualization problems.2 Even if a member of the visualization community has never read McCormick and his colleagues' report or heard Donna Cox speak, he or she has probably been affected by some of their ideas. |
|
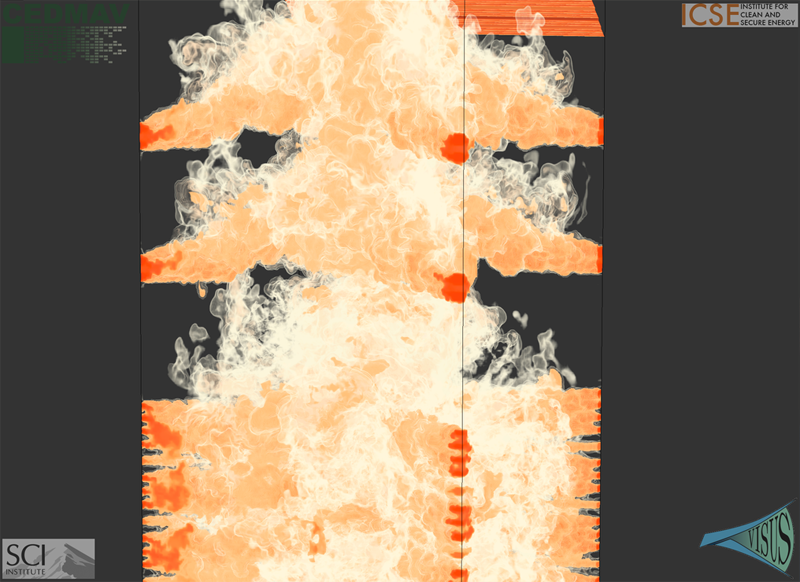
Scalable Visualization and Interactive Analysis Using Massive Data Streams V. Pascucci, P.-T. Bremer, A. Gyulassy, G. Scorzelli, C. Christensen, B. Summa, S. Kumar. In Cloud Computing and Big Data, Advances in Parallel Computing, Vol. 23, IOS Press, pp. 212--230. 2013. Historically, data creation and storage has always outpaced the infrastructure for its movement and utilization. This trend is increasing now more than ever, with the ever growing size of scientific simulations, increased resolution of sensors, and large mosaic images. Effective exploration of massive scientific models demands the combination of data management, analysis, and visualization techniques, working together in an interactive setting. The ViSUS application framework has been designed as an environment that allows the interactive exploration and analysis of massive scientific models in a cache-oblivious, hardware-agnostic manner, enabling processing and visualization of possibly geographically distributed data using many kinds of devices and platforms. For general purpose feature segmentation and exploration we discuss a new paradigm based on topological analysis. This approach enables the extraction of summaries of features present in the data through abstract models that are orders of magnitude smaller than the raw data, providing enough information to support general queries and perform a wide range of analyses without access to the original data. Keywords: Visualization, data analysis, topological data analysis, Parallel I/O |