


Visualization
Visualization, sometimes referred to as visual data analysis, uses the graphical representation of data as a means of gaining understanding and insight into the data. Visualization research at SCI has focused on applications spanning computational fluid dynamics, medical imaging and analysis, biomedical data analysis, healthcare data analysis, weather data analysis, poetry, network and graph analysis, financial data analysis, etc.Research involves novel algorithm and technique development to building tools and systems that assist in the comprehension of massive amounts of (scientific) data. We also research the process of creating successful visualizations.
We strongly believe in the role of interactivity in visual data analysis. Therefore, much of our research is concerned with creating visualizations that are intuitive to interact with and also render at interactive rates.
Visualization at SCI includes the academic subfields of Scientific Visualization, Information Visualization and Visual Analytics.


Mike Kirby
Uncertainty Visualization

Alex Lex
Information Visualization
Centers and Labs:
- Visualization Design Lab (VDL)
- CEDMAV
- POWDER Display Wall
- Modeling, Display, and Understanding Uncertainty in Simulations for Policy Decision Making
- Topological Data Analysis for Large Network Visualization
Funded Research Projects:
Publications in Visualization:
|
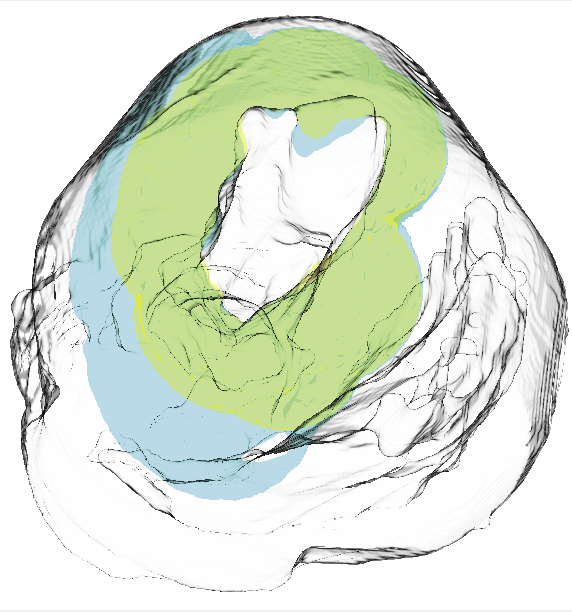
  Visualization for understanding uncertainty in the simulation of myocardial ischemia P. Rosen, B. Burton, K. Potter, C.R. Johnson. In Proceedings of the 2013 Workshop on Visualization in Medicine and Life Sciences, 2013. We have created the Myocardial Uncertainty Viewer (muView) tool for exploring data stemming from the forward simulation of cardiac ischemia. The simulation uses a collection of conductivity values to understand how ischemic regions effect the undamaged anisotropic heart tissue. The data resulting from the simulation is multivalued and volumetric and thus, for every data point, we have a collection of samples describing cardiac electrical properties. muView combines a suite of visual analysis methods to explore the area surrounding the ischemic zone and identify how perturbations of variables changes the propagation of their effects. |
|
Visualization of Uncertainty without a Mean K. Potter, S. Gerber, E.W. Anderson. In IEEE Computer Graphics and Applications, Visualization Viewpoints, Vol. 33, No. 1, pp. 75--79. 2013. As dataset size and complexity steadily increase, uncertainty is becoming an important data aspect. So, today's visualizations need to incorporate indications of uncertainty. However, characterizing uncertainty for visualization isn't always straightforward. Entropy, in the information-theoretic sense, can be a measure for uncertainty in categorical datasets. The authors discuss the mathematical formulation, interpretation, and use of entropy in visualizations. This research aims to demonstrate entropy as a metric and expand the vocabulary of uncertainty measures for visualization. |
|
Rule-based Visual Mappings - with a Case Study on Poetry Visualization A. Abdul-Rahman, J. Lein, K. Coles, E. Maguire, M.D. Meyer, M. Wynne, C.R. Johnson, A. Trefethen, M. Chen. In Proceedings of the 2013 Eurographics Conference on Visualization (EuroVis), Vol. 32, No. 3, pp. 381--390. June, 2013. In this paper, we present a user-centered design study on poetry visualization. We develop a rule-based solution to address the conflicting needs for maintaining the flexibility of visualizing a large set of poetic variables and for reducing the tedium and cognitive load in interacting with the visual mapping control panel. We adopt Munzner's nested design model to maintain high-level interactions with the end users in a closed loop. In addition, we examine three design options for alleviating the difficulty in visualizing poems latitudinally. We present several example uses of poetry visualization in scholarly research on poetry. |
|
Synergistic Challenges in Data-Intensive Science and Exascale Computing J. Chen, A. Choudhary, S. Feldman, B. Hendrickson, C.R. Johnson, R. Mount, V. Sarkar, V. White, D. Williams. Note: Summary Report of the Advanced Scientific Computing Advisory Committee (ASCAC) Subcommittee, March, 2013. The ASCAC Subcommittee on Synergistic Challenges in Data-Intensive Science and Exascale Computing has reviewed current practice and future plans in multiple science domains in the context of the challenges facing both Big Data and the Exascale Computing. challenges. The review drew from public presentations, workshop reports and expert testimony. Data-intensive research activities are increasing in all domains of science, and exascale computing is a key enabler of these activities. We briefly summarize below the key findings and recommendations from this report from the perspective of identifying investments that are most likely to positively impact both data-intensive science goals and exascale computing goals. |
|
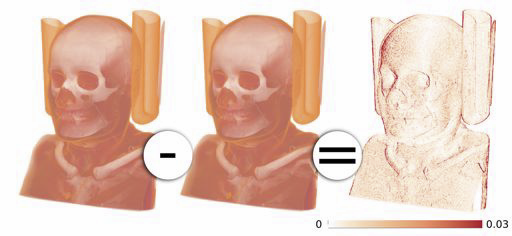
Verifying Volume Rendering Using Discretization Error Analysis SCI Technical Report, T. Etiene, D. Jonsson, T. Ropinski, C. Scheidegger, J. Comba, L. Gustavo Nonato, R.M. Kirby, A. Ynnerman, C.T. Silva. No. UUSCI-2013-001, SCI Institute, University of Utah, 2013. We propose an approach for verification of volume rendering correctness based on an analysis of the volume rendering integral, the basis for most DVR algorithms. With respect to the most common discretization of this continuous model, we make assumptions about the impact of parameter changes on the rendered results and derive convergence curves describing the expected behavior. Specifically, we progressively refine the number of samples along the ray, the grid size, and the pixel size, and evaluate how the errors observed during refinement compare against the expected approximation errors. We will derive the theoretical foundations of our verification approach, explain how to realize it in practice and discuss its limitations as well as the identified errors. Keywords: discretization errors, volume rendering, verifiable visualization |
|
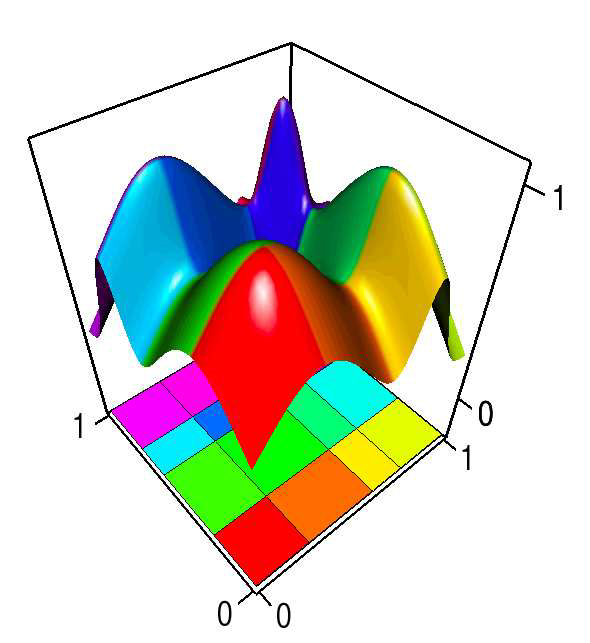
Morse-Smale Regression S. Gerber, O. Reubel, P.-T. Bremer, V. Pascucci, R.T. Whitaker. In Journal of Computational and Graphical Statistics, Vol. 22, No. 1, pp. 193--214. 2013. DOI: 10.1080/10618600.2012.657132 This paper introduces a novel partition-based regression approach that incorporates topological information. Partition-based regression typically introduce a quality-of-fit-driven decomposition of the domain. The emphasis in this work is on a topologically meaningful segmentation. Thus, the proposed regression approach is based on a segmentation induced by a discrete approximation of the Morse-Smale complex. This yields a segmentation with partitions corresponding to regions of the function with a single minimum and maximum that are often well approximated by a linear model. This approach yields regression models that are amenable to interpretation and have good predictive capacity. Typically, regression estimates are quantified by their geometrical accuracy. For the proposed regression, an important aspect is the quality of the segmentation itself. Thus, this paper introduces a new criterion that measures the topological accuracy of the estimate. The topological accuracy provides a complementary measure to the classical geometrical error measures and is very sensitive to over-fitting. The Morse-Smale regression is compared to state-of-the-art approaches in terms of geometry and topology and yields comparable or improved fits in many cases. Finally, a detailed study on climate-simulation data demonstrates the application of the Morse-Smale regression. Supplementary materials are available online and contain an implementation of the proposed approach in the R package msr, an analysis and simulations on the stability of the Morse-Smale complex approximation and additional tables for the climate-simulation study. |
| Comments on the “Meshless Helmholtz-Hodge decomposition” H. Bhatia, G. Norgard, V. Pascucci, P.-T. Bremer. In IEEE Transactions on Visualization and Computer Graphics, Vol. 19, No. 3, pp. 527--528. 2013. DOI: 10.1109/TVCG.2012.62 The Helmholtz-Hodge decomposition (HHD) is one of the fundamental theorems of fluids describing the decomposition of a flow field into its divergence-free, curl-free and harmonic components. Solving for an HDD is intimately connected to the choice of boundary conditions which determine the uniqueness and orthogonality of the decomposition. This article points out that one of the boundary conditions used in a recent paper \"Meshless Helmholtz-Hodge decomposition\" [5] is, in general, invalid and provides an analytical example demonstrating the problem. We hope that this clarification on the theory will foster further research in this area and prevent undue problems in applying and extending the original approach. |
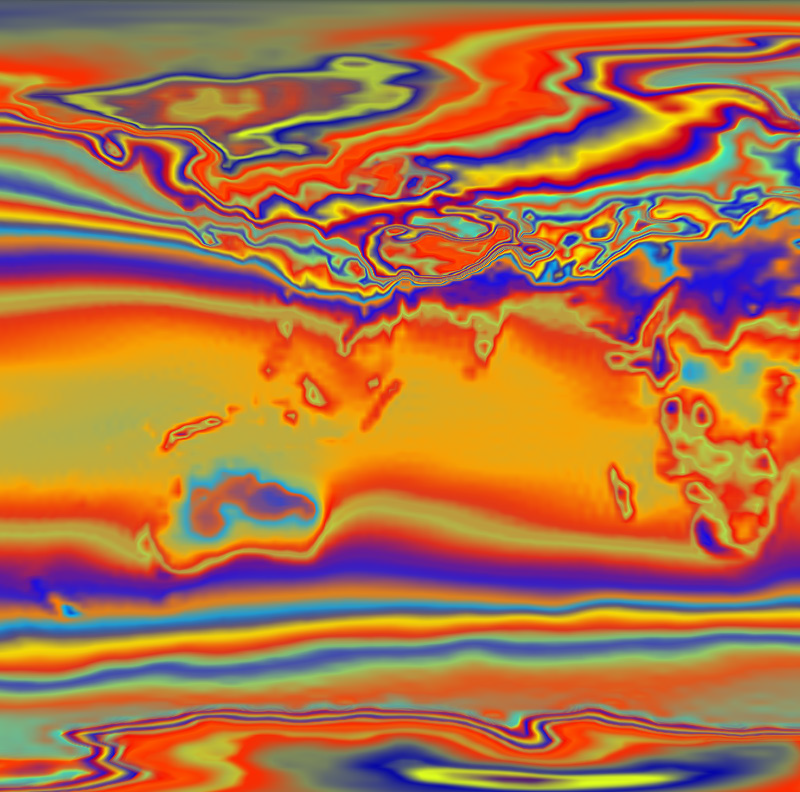
| Visualizing Invariant Manifolds in Area-Preserving Maps X. Tricoche, C. Garth, A. Sanderson, K. Joy. In Topological Methods in Data Analysis and Visualization II: Theory, Algorithms, and Applications, Edited by R. Peikert, H. Hauser, H. Carr, R. Fuchs, Springer Berlin Heidelberg, pp. 109--124. 2012. ISBN: 978-3-642-23175-9 DOI: 10.1007/978-3-642-23175-9_8 Area-preserving maps arise in the study of conservative dynamical systems describing a wide variety of physical phenomena, from the rotation of planets to the dynamics of a fluid. The visual inspection of these maps reveals a remarkable topological picture in which invariant manifolds form the fractal geometric scaffold of both quasi-periodic and chaotic regions. We discuss in this paper the visualization of such maps built upon these invariant manifolds. This approach is in stark contrast with the discrete Poincare plots that are typically used for the visual inspection of maps. We propose to that end several modified definitions of the finite-time Lyapunov exponents that we apply to reveal the underlying structure of the dynamics. We examine the impact of various parameters and the numerical aspects that pertain to the implementation of this method. We apply our technique to a standard analytical example and to a numerical simulation of magnetic confinement in a fusion reactor. In both cases our simple method is able to reveal salient structures across spatial scales and to yield expressive images across application domains. |
| enRoute: Dynamic Path Extraction from Biological Pathway Maps for In-Depth Experimental Data Analysis C Partl, A Lex, M Streit, D Kalkofen, K Kashofer, D Schmalstieg. In Proceedings of the IEEE Symposium on Biological Data Visualization (BioVis '12), IEEE, pp. 107--114. 2012. DOI: 10.1109/BioVis.2012.6378600 Pathway maps are an important source of information when analyzing functional implications of experimental data on biological processes. However, associating large quantities of data with nodes on a pathway map and allowing in depth-analysis at the same time is a challenging task. While a wide variety of approaches for doing so exist, they either do not scale beyond a few experiments or fail to represent the pathway appropriately. To remedy this, we introduce enRoute, a new approach for interactively exploring experimental data along paths that are dynamically extracted from pathways. By showing an extracted path side-by-side with experimental data, enRoute can present large amounts of data for every pathway node. It can visualize hundreds of samples, dozens of experimental conditions, and even multiple datasets capturing different aspects of a node at the same time. Another important property of this approach is its conceptual compatibility with arbitrary forms of pathways. Most notably, enRoute works well with pathways that are manually created, as they are available in large, public pathway databases. We demonstrate enRoute with pathways from the well-established KEGG database and expression as well as copy number datasets from humans and mice with more than 1,000 experiments. We validate enRoute using case studies with domain experts, who used enRoute to explore data for glioblastoma multiforme in humans and a model of steatohepatitis in mice. |
| StratomeX: Visual Analysis of Large-Scale Heterogeneous Genomics Data for Cancer Subtype Characterization A. Lex, M. Streit, H. Schulz, C. Partl, D. Schmalstieg, P.. Park, N. Gehlenborg. In Computer Graphics Forum (EuroVis '12), Vol. 31, No. 3, pp. 1175--1184. 2012. ISSN: 0167-7055 DOI: 10.1111/j.1467-8659.2012.03110.x dentification and characterization of cancer subtypes are important areas of research that are based on the integrated analysis of multiple heterogeneous genomics datasets. Since there are no tools supporting this process, much of this work is done using ad-hoc scripts and static plots, which is inefficient and limits visual exploration of the data. To address this, we have developed StratomeX, an integrative visualization tool that allows investigators to explore the relationships of candidate subtypes across multiple genomic data types such as gene expression, DNA methylation, or copy number data. StratomeX represents datasets as columns and subtypes as bricks in these columns. Ribbons between the columns connect bricks to show subtype relationships across datasets. Drill-down features enable detailed exploration. StratomeX provides insights into the functional and clinical implications of candidate subtypes by employing small multiples, which allow investigators to assess the effect of subtypes on molecular pathways or outcomes such as patient survival. As the configuration of viewing parameters in such a multi-dataset, multi-view scenario is complex, we propose a meta visualization and configuration interface for dataset dependencies and data-view relationships. StratomeX is developed in close collaboration with domain experts. We describe case studies that illustrate how investigators used the tool to explore subtypes in large datasets and demonstrate how they efficiently replicated findings from the literature and gained new insights into the data. |
| Visualizing Uncertainty in Biological Expression Data C. Holzhüter, A. Lex, D. Schmalstieg, H. Schulz, H. Schumann, M. Streit. In Proceedings of the SPIE Conference on Visualization and Data Analysis (VDA '12), Vol. 8294, pp. 82940O-82940O-11. 2012. DOI: 10.1117/12.908516 Expression analysis of ~omics data using microarrays has become a standard procedure in the life sciences. However, microarrays are subject to technical limitations and errors, which render the data gathered likely to be uncertain. While a number of approaches exist to target this uncertainty statistically, it is hardly ever even shown when the data is visualized using for example clustered heatmaps. Yet, this is highly useful when trying not to omit data that is "good enough" for an analysis, which otherwise would be discarded as too unreliable by established conservative thresholds. Our approach addresses this shortcoming by first identifying the margin above the error threshold of uncertain, yet possibly still useful data. It then displays this uncertain data in the context of the valid data by enhancing a clustered heatmap. We employ different visual representations for the different kinds of uncertainty involved. Finally, it lets the user interactively adjust the thresholds, giving visual feedback in the heatmap representation, so that an informed choice on which thresholds to use can be made instead of applying the usual rule-of-thumb cut-offs. We exemplify the usefulness of our concept by giving details for a concrete use case from our partners at the Medical University of Graz, thereby demonstrating our implementation of the general approach. |
| Model-Driven Design for the Visual Analysis of Heterogeneous Data M. Streit, H. Schulz, A. Lex, D. Schmalstieg, H. Schumann. In IEEE Transactions on Visualization and Computer Graphics, Vol. 18, No. 6, IEEE, pp. 998--1010. 2012. DOI: 10.1109/TVCG.2011.108 As heterogeneous data from different sources are being increasingly linked, it becomes difficult for users to understand how the data are connected, to identify what means are suitable to analyze a given data set, or to find out how to proceed for a given analysis task. We target this challenge with a new model-driven design process that effectively codesigns aspects of data, view, analytics, and tasks. We achieve this by using the workflow of the analysis task as a trajectory through data, interactive views, and analytical processes. The benefits for the analysis session go well beyond the pure selection of appropriate data sets and range from providing orientation or even guidance along a preferred analysis path to a potential overall speedup, allowing data to be fetched ahead of time. We illustrate the design process for a biomedical use case that aims at determining a treatment plan for cancer patients from the visual analysis of a large, heterogeneous clinical data pool. As an example for how to apply the comprehensive design approach, we present Stack'n'flip, a sample implementation which tightly integrates visualizations of the actual data with a map of available data sets, views, and tasks, thus capturing and communicating the analytical workflow through the required data sets. |
|
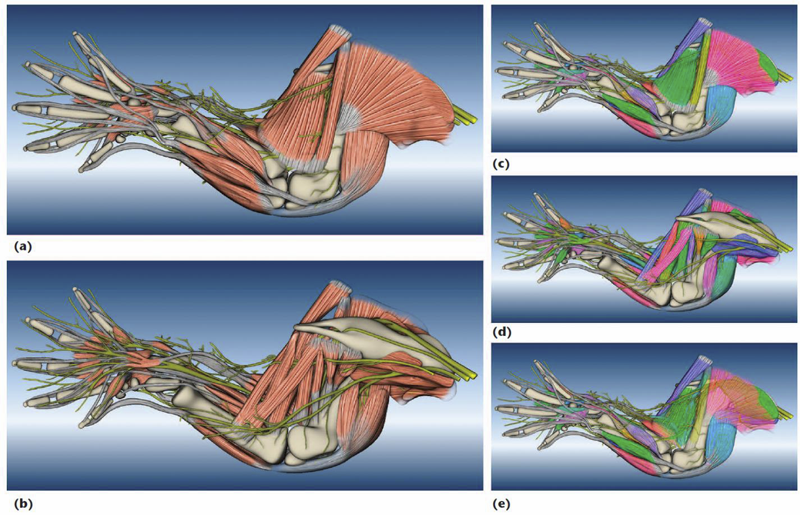
A Practical Workflow for Making Anatomical Atlases in Biological Research Y. Wan, A.K. Lewis, M. Colasanto, M. van Langeveld, G. Kardon, C.D. Hansen. In IEEE Computer Graphics and Applications, Vol. 32, No. 5, pp. 70--80. 2012. DOI: 10.1109/MCG.2012.64 An anatomical atlas provides a detailed map for medical and biological studies of anatomy. These atlases are important for understanding normal anatomy and the development and function of structures, and for determining the etiology of congenital abnormalities. Unfortunately, for biologists, generating such atlases is difficult, especially ones with the informative content and aesthetic quality that characterize human anatomy atlases. Building such atlases requires knowledge of the species being studied and experience with an art form that can faithfully record and present this knowledge, both of which require extensive training in considerably different fields. (For some background on anatomical atlases, see the related sidebar.) With the latest innovations in data acquisition and computing techniques, atlas building has changed dramatically. We can now create atlases from 3D images of biological specimens, allowing for high-quality, faithful representations. Labeling of structures using fluorescently tagged antibodies, confocal 3D scanning of these labeled structures, volume rendering, segmentation, and surface reconstruction techniques all promise solutions to the problem of building atlases. However, biology researchers still ask, \"Is there a set of tools we can use or a practical workflow we can follow so that we can easily build models from our biological data?\" To help answer this question, computer scientists have developed many algorithms, tools, and program codes. Unfortunately, most of these researchers have tackled only one aspect of the problem or provided solutions to special cases. So, the general question of how to build anatomical atlases remains unanswered. For a satisfactory answer, biologists need a practical workflow they can easily adapt for different applications. In addition, reliable tools that can fit into the workflow must be readily available. Finally, examples using the workflow and tools to build anatomical atlases would demonstrate these resources' utility for biological research. To build a mouse limb atlas for studying the development of the limb musculoskeletal system, University of Utah biologists, artists, and computer scientists have designed a generalized workflow for generating anatomical atlases. We adapted it from a CG artist's workflow of building 3D models for animated films and video games. The tools we used to build the atlas were mostly commercial, industry-standard software packages. Having been developed, tested, and employed for industrial use for decades, CG artists' workflow and tools, with certain adaptations, are the most suitable for making high-quality anatomical atlases, especially under strict budgetary and time limits. Biological researchers have been largely unaware of these resources. By describing our experiences in this project, we hope to show biologists how to use these resources to make anatomically accurate, high-quality, and useful anatomical atlases. |
|
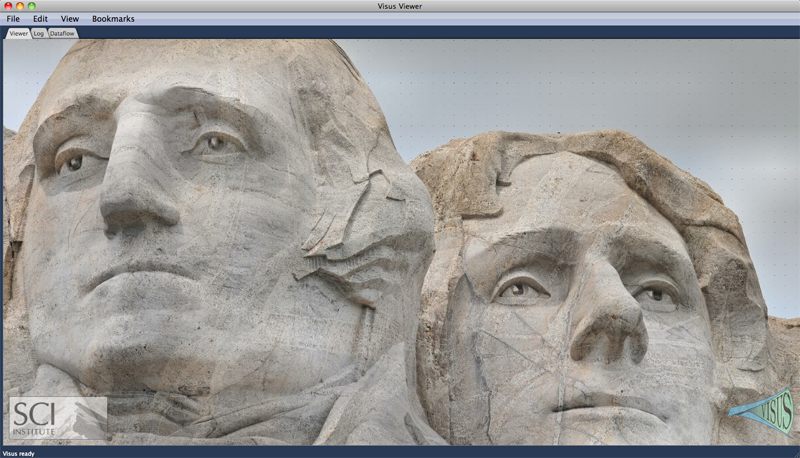
The ViSUS Visualization Framework V. Pascucci, G. Scorzelli, B. Summa, P.-T. Bremer, A. Gyulassy, C. Christensen, S. Philip, S. Kumar. In High Performance Visualization: Enabling Extreme-Scale Scientific Insight, Chapman and Hall/CRC Computational Science, Ch. 19, Edited by E. Wes Bethel and Hank Childs (LBNL) and Charles Hansen (UofU), Chapman and Hall/CRC, 2012. The ViSUS software framework was designed with the primary philosophy that the visualization of massive data need not be tied to specialized hardware or infrastructure. In other words, a visualization environment for large data can be designed to be lightweight, highly scalable and run on a variety of plat- forms or hardware. Moreover, if designed generally such an infrastructure can have a wide variety of applications, all from the same code base. Figure 19.1 details example applications and the major components of the ViSUS infrastructure. The components can be grouped into three major categories. First, a lightweight and fast out-of-core data management framework using multi- resolution space filling curves. This allows the organization of information in an order that exploits the cache hierarchies of any modern data storage architectures. Second, a data flow framework that allows data to be processed during movement. Processing massive datasets in their entirety would be a long and expensive operation which hinders interactive exploration. By designing new algorithms to fit within this framework, data can be processed as it moves. Third, a portable visualization layer which was designed to scale from mobile devices to powerwall displays with same code base. In this chapter we will describe the ViSUS infrastructure, as well as give practical examples of its use in real world applications. |
| Design Study Methodology: Reflections from the Trenches and the Stacks M. Sedlmair, M.D. Meyer, T. Munzner. In IEEE Transactions on Visualization and Computer Graphics, Vol. 18, No. 12, Note: Honorable Mention for Best Paper Award., pp. 2431--2440. 2012. Design studies are an increasingly popular form of problem-driven visualization research, yet there is little guidance available about how to do them effectively. In this paper we reflect on our combined experience of conducting twenty-one design studies, as well as reading and reviewing many more, and on an extensive literature review of other field work methods and methodologies. Based on this foundation we provide definitions, propose a methodological framework, and provide practical guidance for conducting design studies. We define a design study as a project in which visualization researchers analyze a specific real-world problem faced by domain experts, design a visualization system that supports solving this problem, validate the design, and reflect about lessons learned in order to refine visualization design guidelines. We characterize two axes—a task clarity axis from fuzzy to crisp and an information location axis from the domain expert’s head to the computer—and use these axes to reason about design study contributions, their suitability, and uniqueness from other approaches. The proposed methodological framework consists of 9 stages: learn, winnow, cast, discover, design, implement, deploy, reflect, and write. For each stage we provide practical guidance and outline potential pitfalls. We also conducted an extensive literature survey of related methodological approaches that involve a significant amount of qualitative field work, and compare design study methodology to that of ethnography, grounded theory, and action research. |
|
The Four-Level Nested Model Revisited: Blocks and Guidelines M.D. Meyer, M. Sedlmair, T. Munzner. In Workshop on BEyond time and errors: novel evaLuation methods for Information Visualization (BELIV), IEEE VisWeek 2012, 2012. We propose an extension to the four-level nested model for design and validation of visualization systems that defines the term \"guidelines\" in terms of blocks at each level. Blocks are the outcomes of the design process at a specific level, and guidelines discuss relationships between these blocks. Within-level guidelines provide comparisons for blocks within the same level, while between-level guidelines provide mappings between adjacent levels of design. These guidelines help a designer choose which abstractions, techniques, and algorithms are reasonable to combine when building a visualization system. This definition of guideline allows analysis of how the validation efforts in different kinds of papers typically lead to different kinds of guidelines. Analysis through the lens of blocks and guidelines also led us to identify four major needs: a definition of the meaning of block at the problem level; mid-level task taxonomies to fill in the blocks at the abstraction level; refinement of the model itself at the abstraction level; and a more complete set of guidelines that map up from the algorithm level to the technique level. These gaps in visualization knowledge present rich opportunities for future work. |
|
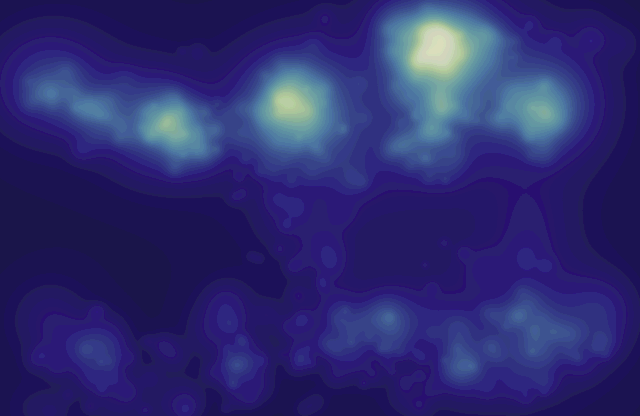
Aggregate Gaze Visualization with Real-Time Heatmaps A. Duchowski, M. Price, M.D. Meyer, P. Orero. In Proceedings of the ACM Symposium on Eye Tracking Research and Applications (ETRA), pp. 13--20. 2012. DOI: 10.1145/2168556.2168558 A GPU implementation is given for real-time visualization of aggregate eye movements (gaze) via heatmaps. Parallelization of the algorithm leads to substantial speedup over its CPU-based implementation and, for the first time, allows real-time rendering of heatmaps atop video. GLSL shader colorization allows the choice of color ramps. Several luminance-based color maps are advocated as alternatives to the popular rainbow color map, considered inappropriate (harmful) for depiction of (relative) gaze distributions. |
|
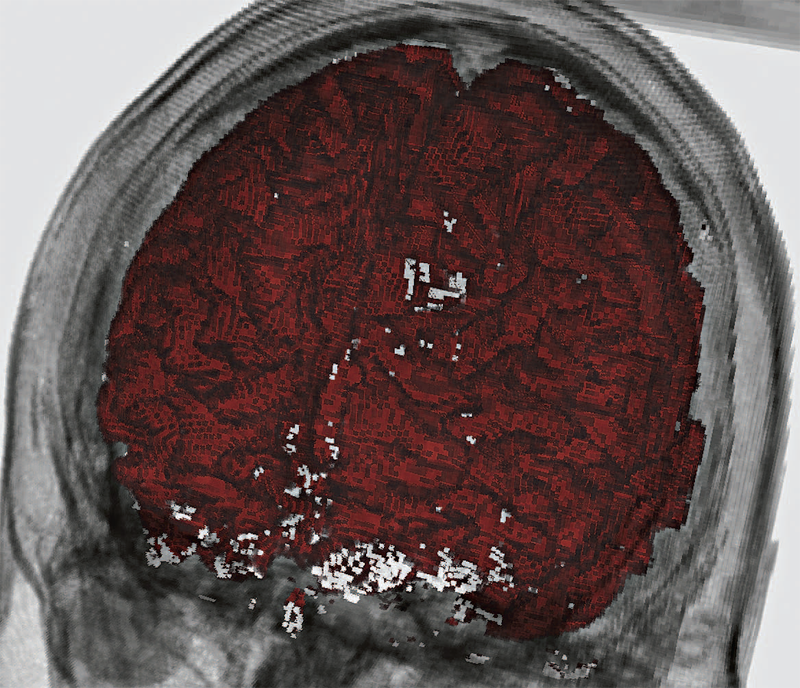
Gaussian Mixture Model Based Volume Visualization S. Liu, J.A. Levine, P.-T. Bremer, V. Pascucci. In Proceedings of the IEEE Large-Scale Data Analysis and Visualization Symposium 2012, Note: Received Best Paper Award, pp. 73--77. 2012. DOI: 10.1109/LDAV.2012.6378978 Representing uncertainty when creating visualizations is becoming more indispensable to understand and analyze scientific data. Uncertainty may come from different sources, such as, ensembles of experiments or unavoidable information loss when performing data reduction. One natural model to represent uncertainty is to assume that each position in space instead of a single value may take on a distribution of values. In this paper we present a new volume rendering method using per voxel Gaussian mixture models (GMMs) as the input data representation. GMMs are an elegant and compact way to drastically reduce the amount of data stored while still enabling realtime data access and rendering on the GPU. Our renderer offers efficient sampling of the data distribution, generating renderings of the data that flicker at each frame to indicate high variance. We can accumulate samples as well to generate still frames of the data, which preserve additional details in the data as compared to either traditional scalar indicators (such as a mean or a single nearest neighbor down sample) or to fitting the data with only a single Gaussian per voxel. We demonstrate the effectiveness of our method using ensembles of climate simulations and MRI scans as well as the down sampling of large scalar fields as examples. Keywords: Uncertainty Visualization, Volume Rendering, Gaussian Mixture Model, Ensemble Visualization |
|
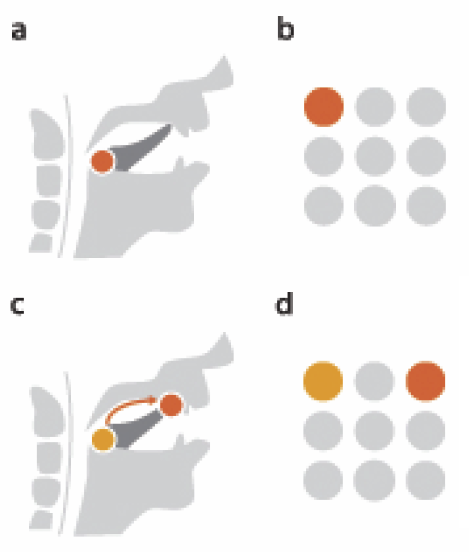
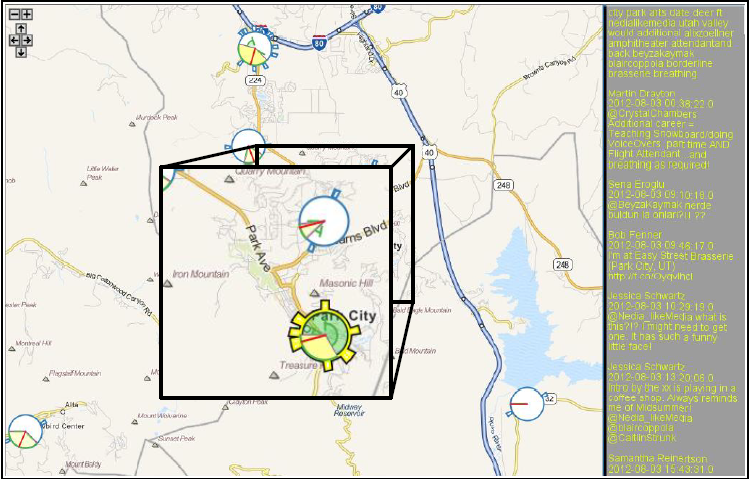
A Multiscale Approach to Network Event Identification using Geolocated Twitter Data C. Yang, I. Jensen, P. Rosen. In First IMC Workshop on Internet Visualization (WIV 2012), pp. (accepted). 2012. The large volume of data associated with social networks hinders the unaided user from interpreting network content in real time. This problem is compounded by the fact that there are limited tools available for enabling robust visual social network exploration. We present a network activity visualization using a novel aggregation glyph called the clyph. The clyph intuitively combines spatial, temporal, and quantity data about multiple network events. We also present several case studies where major network events were easily identified using clyphs, establishing them as a powerful aid for network users and owners. |
|
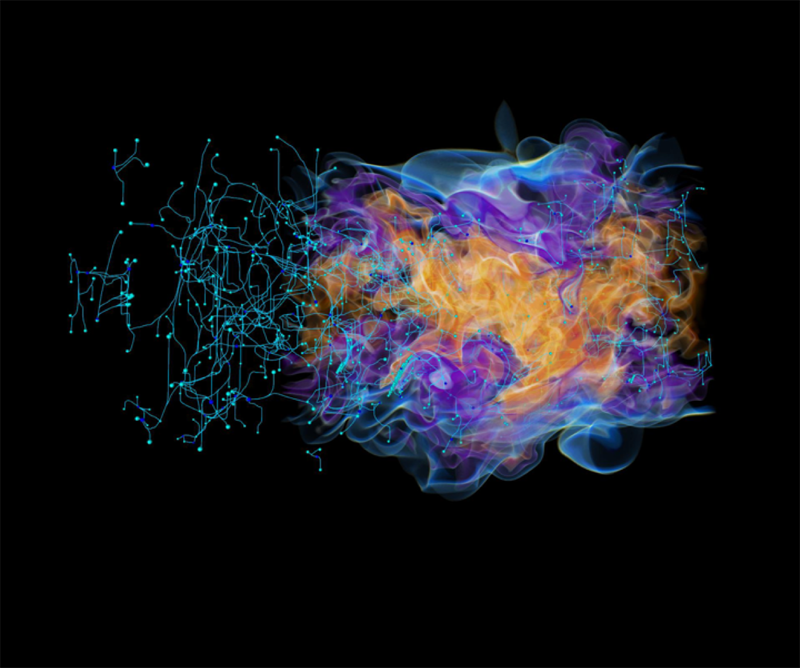
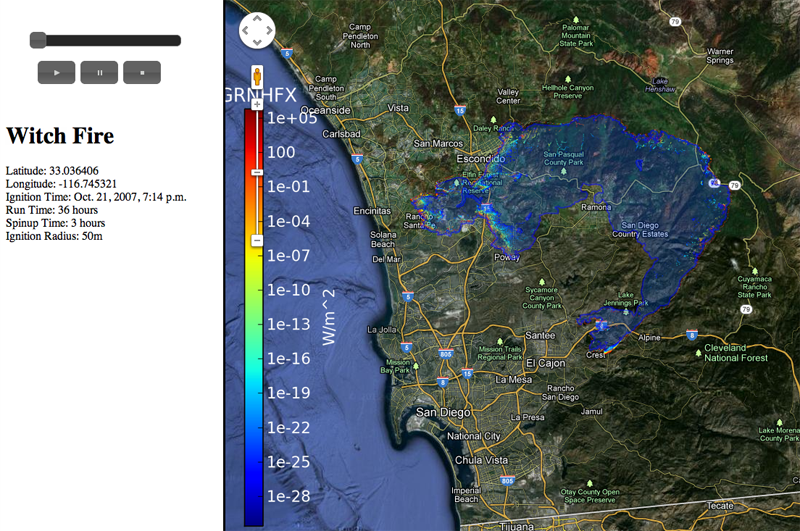
Data management and analysis with WRF and SFIRE J. Beezley, M. Martin, P. Rosen, J. Mandel, A. Kochanski. In Proceedings of the IEEE International Geoscience and Remote Sensing Symposium, Note: UCD CCM Report 312, 2012. We introduce several useful utilities in development for the creation and analysis of real wildland fire simulations using WRF and SFIRE. These utilities exist as standalone programs and scripts as well as extensions to other well known software. Python web scrapers automate the process of downloading and preprocessing atmospheric and surface data from common sources. Other scripts simplify the domain setup by creating parameter files automatically. Integration with Google Earth allows users to explore the simulation in a 3D environment along with real surface imagery. Postprocessing scripts provide the user with a number of output data formats compatible with many commonly used visualization suites allowing for the creation of high quality 3D renderings. As a whole, these improvements build toward a unified web application that brings a sophisticated wildland fire modeling environment to scientists and users alike. |