


Visualization
Visualization, sometimes referred to as visual data analysis, uses the graphical representation of data as a means of gaining understanding and insight into the data. Visualization research at SCI has focused on applications spanning computational fluid dynamics, medical imaging and analysis, biomedical data analysis, healthcare data analysis, weather data analysis, poetry, network and graph analysis, financial data analysis, etc.Research involves novel algorithm and technique development to building tools and systems that assist in the comprehension of massive amounts of (scientific) data. We also research the process of creating successful visualizations.
We strongly believe in the role of interactivity in visual data analysis. Therefore, much of our research is concerned with creating visualizations that are intuitive to interact with and also render at interactive rates.
Visualization at SCI includes the academic subfields of Scientific Visualization, Information Visualization and Visual Analytics.


Mike Kirby
Uncertainty Visualization

Alex Lex
Information Visualization
Centers and Labs:
- Visualization Design Lab (VDL)
- CEDMAV
- POWDER Display Wall
- Modeling, Display, and Understanding Uncertainty in Simulations for Policy Decision Making
- Topological Data Analysis for Large Network Visualization
Funded Research Projects:
Publications in Visualization:
|
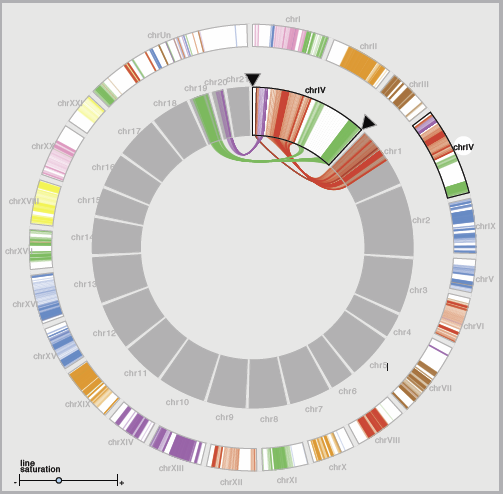
  MizBee: A Multiscale Synteny Browser M.D. Meyer, T. Munzner, H. Pfister. In IEEE Transactions on Visualization and Computer Graphics (Proceedings of InfoVis 2009), Vol. 15, No. 6, Note: Honorable Mention for Best Paper Award, pp. 897--904. 2009. In the field of comparative genomics, scientists seek to answer questions about evolution and genomic function by comparing the genomes of species to find regions of shared sequences. Conserved syntenic blocks are an important biological data abstraction for indicating regions of shared sequences. The goal of this work is to show multiple types of relationships at multiple scales in a way that is visually comprehensible in accordance with known perceptual principles. We present a task analysis for this domain where the fundamental questions asked by biologists can be understood by a characterization of relationships into the four types of proximity/location, size, orientation, and similarity/strength, and the four scales of genome, chromosome, block, and genomic feature. We also propose a new taxonomy of the design space for visually encoding conservation data. We present MizBee, a multiscale synteny browser with the unique property of providing interactive side-by-side views of the data across the range of scales supporting exploration of all of these relationship types. We conclude with case studies from two biologists who used MizBee to augment their previous automatic analysis work flow, providing anecdotal evidence about the efficacy of the system for the visualization of syntenic data, the analysis of conservation relationships, and the communication of scientific insights. |
| Microscopic Computed Tomography–Based Virtual Histology for Visualization and Morphometry of Atherosclerosis in Diabetic Apolipoprotein E Mutant Mice H. Martinez, S. Prajapati, C. Estrada, F. Jimenez, I. Wu, A. Bahadur, A. Sanderson, C.R. Johnson, M. Shim, C. Keller, S. Ahuja. In Circulation, Vol. 120, No. 821--822, 2009. |
| Ensemble-Vis: A Framework for the Statistical Visualization of Ensemble Data K. Potter, A. Wilson, P.-T. Bremer, D. Williams, C. Doutriaux, V. Pascucci, C.R. Johnson. In Proceedings of the 2009 IEEE International Conference on Data Mining Workshops, pp. 233--240. 2009. |
| A Framework for Exploring Numerical Solutions of Advection Reaction Diffusion Equations using a GPU Based Approach A.R. Sanderson, M.D. Meyer, R.M. Kirby, C.R. Johnson. In Journal of Computing and Visualization in Science, Vol. 12, pp. 155--170. 2009. DOI: 10.1007/s00791-008-0086-0 |
| Subject-specific, multiscale simulation of electrophysiology: a software pipeline for image-based models and application examples R.S. MacLeod, J.G. Stinstra, S. Lew, R.T. Whitaker, D.J. Swenson, M.J. Cole, J. Krüger, D.H. Brooks, C.R. Johnson. In Philosophical Transactions of The Royal Society A, Mathematical, Physical & Engineering Sciences, Vol. 367, No. 1896, pp. 2293--2310. 2009. |
| Microscopic Computed Tomography Based Virtual Histology for Visualization and Morphometry of Atherosclerosis in Diabetic Apolipoprotein E Mutant Mice H.G. Martinez, S.I. Prajapati, C.A. Estrada, F. Jimenez, M.P. Quinones, I. Wu, A. Bahadur, A. Sanderson, C.R. Johnson, M. Shim, C. Keller, S.S. Ahuja. In Circulation: Journal of the American Heart Association, Vol. 120, No. 9, pp. 821--822. 2009. |
| Visualization for Data-Intensive Science C.D. Hansen, C.R. Johnson, V. Pascucci, C.T. Silva. In The Fourth Paradigm: Data-Intensive Science, Edited by S. Tansley and T. Hey and K. Tolle, Microsoft Research, pp. 153--164. 2009. |
| Occam's Razor and Petascale Visual Data Analysis E.W. Bethel, C.R. Johnson, S. Ahern, J. Bell, P.-T. Bremer, H. Childs, E. Cormier-Michel, M. Day, E. Deines, P.T. Fogal, C. Garth, C.G.R. Geddes, H. Hagen, B. Hamann, C.D. Hansen, J. Jacobsen, K.I. Joy, J. Krüger, J. Meredith, P. Messmer, G. Ostrouchov, V. Pascucci, K. Potter, Prabhat, D. Pugmire, O. Rubel, A.R. Sanderson, C.T. Silva, D. Ushizima, G.H. Weber, B. Whitlock, K. Wu. In Journal of Physics: Conference Series, Journal of Physics: Conference Series, Vol. 180, No. 012084, pp. (published online). 2009. DOI: 10.1088/1742-6596/180/1/012084 One of the central challenges facing visualization research is how to effectively enable knowledge discovery. An effective approach will likely combine application architectures that are capable of running on today's largest platforms to address the challenges posed by large data with visual data analysis techniques that help find, represent, and effectively convey scientifically interesting features and phenomena. |
| Galerkin Method for Wave Equations with Uncertain Coefficients D. Gottlieb, D. Xiu. In Communications in Computational Physics, Vol. 3, No. 2, pp. 505--518. 2008. Polynomial chaos methods (and generalized polynomial chaos methods) have been extensively applied to analyze PDEs that contain uncertainties. However this approach is rarely applied to hyperbolic systems. In this paper we analyze the properties of the resulting deterministic system of equations obtained by stochastic Galerkin projection. We consider a simple model of a scalar wave equation with random wave speed. We show that when uncertainty causes the change of characteristic directions, the resulting deterministic system of equations is a symmetric hyperbolic system with both positive and negative eigenvalues. A consistent method of imposing the boundary conditions is proposed and its convergence is established. Numerical examples are presented to support the analysis. Keywords: Generalized polynomial chaos, stochastic PDE, Galerkin method, hyperbolic equation, uncertainty quantification |
|
Volume MLS Ray Casting C. Ledergerber, G. Guennebaud, M.D. Meyer, M. Bacher, H. Pfister. In IEEE Transactions on Visualization and Computer Graphics (Proceedings of Visualization 2008), Vol. 14, No. 6, pp. 1539--1546. 2008. The method of Moving Least Squares (MLS) is a popular framework for reconstructing continuous functions from scattered data due to its rich mathematical properties and well-understood theoretical foundations. This paper applies MLS to volume rendering, providing a unified mathematical framework for ray casting of scalar data stored over regular as well as irregular grids. We use the MLS reconstruction to render smooth isosurfaces and to compute accurate derivatives for high-quality shading effects. We also present a novel, adaptive preintegration scheme to improve the efficiency of the ray casting algorithm by reducing the overall number of function evaluations, and an efficient implementation of our framework exploiting modern graphics hardware. The resulting system enables high-quality volume integration and shaded isosurface rendering for regular and irregular volume data. |
|
Dynamic Particle Systems for Adaptive Sampling of Implicit Surfaces M.D. Meyer. School of Computing, University of Utah, 2008. A ubiquitous requirement in many mathematical and computational problems is a set of well-placed point samples. For producing very even distributions of samples across complex surfaces, a dynamic particle system is a controllable mechanism that naturally accommodates strict sampling requirements. The systemfirst constrains particles to a surface, and then moves the particles across the surface until they are arranged in minimal energy configurations. Adaptivity is added into the system by scaling the distance between particles, causing higher densities of points around surface features. In this dissertation we explore and refine the dynamics of particle systems for generating efficient and adaptive point samples of implicit surfaces. Throughout this dissertation, we apply the adaptive particle system framework to several application areas. First, efficient visualizations of high-order finite element datasets are generated by developing adaptivity metrics of surfaces that exist in the presence of curvilinear coordinate transformation. Second, a framework is proposed that meets fundamental sampling constraints of Delaunay-based surface reconstruction algorithms. In meeting these constraints, the particle distributions produce nearly-regular, efficient isosurface tessellation that are geometrically and topologically accurate. And third, a novel analytic representation of material boundaries in multimaterial volume datasets is developed, as well as a set of projection operators, that allow for explicit sampling of nonmanifold material intersections. Using a tetrahedral labeling algorithm, the material intersections are extracted as watertight, nonmanifold meshes that are well-suited for simulations. |
| Particle-based Sampling and Meshing of Surfaces in Multimaterial Volumes M.D. Meyer, R.T. Whitaker, R.M. Kirby, C. Ledergerber, H. Pfister. In IEEE Transactions on Visualization and Computer Graphics, Vol. 14, No. 6, pp. 1539--1546. 2008. |
| Biomedical Visualization C.R. Johnson, X. Tricoche. In Advances in Biomedical Engineering, Ch. 6, Edited by Pascal Verdonck, Elsvier Science, pp. 209--272. 2008. |
| Optimization of Volumetric Computed Tomography for Skeletal Analysis of Model Genetic Organisms S.X. Vasquez, M.S. Hansen, A.N. Bahadur, M.F. Hockin, G.L. Kindlmann, L. Nevell, I.Q. Wu, D.J. Grunwald, D.M. Weinstein, G.M. Jones, C.R. Johnson, J.L. Vandeberg, M.R. Capecchi, C. Keller. In The Anatomical Record: Advances in Integrative Anatomy and Evolutionary Biology, Vol. 291, pp. 475--487. 2008. PubMed ID: 18286615 |
| Volumetric Parameterization and Trivariate B-spline Fitting using Harmonic Functions T. Martin, E. Cohen, R.M. Kirby. In Proceedings of ACM Solid and Physical Modeling, Stony Brook, NY, Note: Awarded Best Paper, pp. 269-280. 2008. |
| Towards the Visualization of Multi-Dimentional Stochastic Distribution Data K. Potter, J. Krüger, C.R. Johnson. In Proceedings of The International Conference on Computer Graphics and Visualization (IADIS) 2008, pp. 191--196. 2008. |
| Unified Volume Format: A General System For Efficient Handling Of Large Volumetric Datasets J. Krüger, K. Potter, R.S. MacLeod, C.R. Johnson. In Proceedings of IADIS Computer Graphics and Visualization 2008 (CGV 2008), pp. 19--26. 2008. PubMed ID: 20953270 With the continual increase in computing power, volumetric datasets with sizes ranging from only a few megabytes to petascale are generated thousands of times per day. Such data may come from an ordinary source such as simple everyday medical imaging procedures, while larger datasets may be generated from cluster-based scientific simulations or measurements of large scale experiments. In computer science an incredible amount of work worldwide is put into the efficient visualization of these datasets. As researchers in the field of scientific visualization, we often have to face the task of handling very large data from various sources. This data usually comes in many different data formats. In medical imaging, the DICOM standard is well established, however, most research labs use their own data formats to store and process data. To simplify the task of reading the many different formats used with all of the different visualization programs, we present a system for the efficient handling of many types of large scientific datasets (see Figure 1 for just a few examples). While primarily targeted at structured volumetric data, UVF can store just about any type of structured and unstructured data. The system is composed of a file format specification with a reference implementation of a reader. It is not only a common, easy to implement format but also allows for efficient rendering of most datasets without the need to convert the data in memory. |
| The Need For Verifiable Visualization R.M. Kirby, C.T. Silva. In IEEE Computer Graphics and Applications, Vol. 28, No. 5, pp. 78--83. 2008. DOI: 10.1109/MCG.2008.103 Visualization is often employed as part of the simulation science pipeline, it's the window through which scientists examine their data for deriving new science, and the lens used to view modeling and discretization interactions within their simulations. We advocate that as a component of the simulation science pipeline, visualization must be explicitly considered as part of the validation and verification (V&V) process. In this article, the authors define V&V in the context of computational science, discuss the role of V&V in the scientific process, and present arguments for the need for verifiable visualization. |
| Visual Analysis of Bioelectric Fields X. Tricoche, R.S. MacLeod, C.R. Johnson. In Visualization in Medicine and Life Sciences, Mathematics and Visualization, Springer-Verlag, pp. 205--220. 2008. |
| Who Votes For What? A Visual Query Language for Opinion Data G. Draper, R. Riesenfeld. In IEEE Transactions on Visualization and Computer Graphics, Vol. 14, No. 6, IEEE, pp. 1197--1204. Nov, 2008. DOI: 10.1109/tvcg.2008.187 |