SCI Publications
2012


H. Tiesler, R.M. Kirby, D. Xiu, T. Preusser.
“Stochastic Collocation for Optimal Control Problems with Stochastic PDE Constraints,” In SIAM Journal on Control and Optimization, Vol. 50, No. 5, pp. 2659--2682. 2012.
DOI: 10.1137/110835438
We discuss the use of stochastic collocation for the solution of optimal control problems which are constrained by stochastic partial differential equations (SPDE). Thereby the constraining, SPDE depends on data which is not deterministic but random. Assuming a deterministic control, randomness within the states of the input data will propagate to the states of the system. For the solution of SPDEs there has recently been an increasing effort in the development of efficient numerical schemes based upon the mathematical concept of generalized polynomial chaos. Modal-based stochastic Galerkin and nodal-based stochastic collocation versions of this methodology exist, both of which rely on a certain level of smoothness of the solution in the random space to yield accelerated convergence rates. In this paper we apply the stochastic collocation method to develop a gradient descent as well as a sequential quadratic program (SQP) for the minimization of objective functions constrained by an SPDE. The stochastic function involves several higher-order moments of the random states of the system as well as classical regularization of the control. In particular we discuss several objective functions of tracking type. Numerical examples are presented to demonstrate the performance of our new stochastic collocation minimization approach.
Keywords: stochastic collocation, optimal control, stochastic partial differential equations
J. Tierny, V. Pascucci.
“Generalized Topological Simplification of Scalar Fields on Surfaces,” In IEEE Transactions on Visualization and Computer Graphics (TVCG), Vol. 18, No. 12, pp. 2005--2013. Dec, 2012.
DOI: 10.1109/TVCG.2012.228
L.T. Tran.
“Numerical Study and Improvement of the Methods in Uintah Framework: The Material Point Method and the Implicit Continuous-Fluid Eulerian Method,” Note: Advisor: Martin Berzins, School of Computing, University of Utah, December, 2012.
The Material Point Method (MPM) and the Implicit Continuous-fluid Eulerian method (ICE) have been used to simulate and solve many challenging problems in engineering applications, especially those involving large deformations in materials and multimaterial interactions. These methods were implemented within the Uintah Computational Framework (UCF) to simulate explosions, fires, and other fluids and fluid-structure interaction. For the purpose of knowing if the simulations represent the solutions of the actual mathematical models, it is important to fully understand the accuracy of these methods. At the time this research was initiated, there were hardly any error analysis being done on these two methods, though the range of their applications was impressive. This dissertation undertakes an analysis of the errors in computational properties of MPM and ICE in the context of model problems from compressible gas dynamics which are governed by the one-dimensional Euler system. The analysis for MPM includes the analysis of errors introduced when the information is projected from particles onto the grid and when the particles cross the grid cells. The analysis for ICE includes the analysis of spatial and temporal errors in the method, which can then be used to improve the method's accuracy in both space and time. The implementation of ICE in UCF, which is referred to as Production ICE, does not perform as well as many current methods for compressible flow problems governed by the one-dimensional Euler equations – which we know because the obtained numerical solutions exhibit unphysical oscillations and discrepancies in the shock speeds. By examining different choices in the implementation of ICE in this dissertation, we propose a method to eliminate the discrepancies and suppress the nonphysical oscillations in the numerical solutions of Production ICE – this improved Production ICE method (IMPICE) is extended to solve the multidimensional Euler equations. The discussion of the IMPICE method for multidimensional compressible flow problems includes the method’s detailed implementation and embedded boundary implementation. Finally, we propose a discrete adjoint-based approach to estimate the spatial and temporal errors in the numerical solutions obtained from IMPICE.
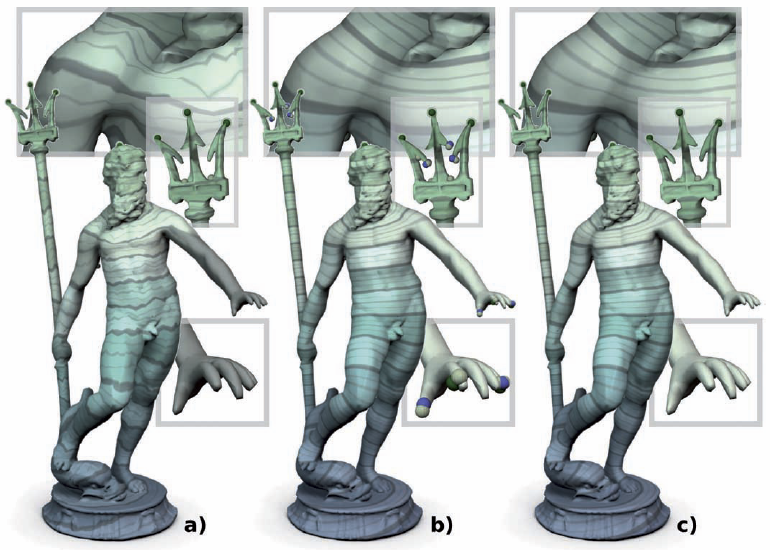
X. Tricoche, C. Garth, A. Sanderson, K. Joy.
“Visualizing Invariant Manifolds in Area-Preserving Maps,” In Topological Methods in Data Analysis and Visualization II: Theory, Algorithms, and Applications, Edited by R. Peikert, H. Hauser, H. Carr, R. Fuchs, Springer Berlin Heidelberg, pp. 109--124. 2012.
ISBN: 978-3-642-23175-9
DOI: 10.1007/978-3-642-23175-9_8
Area-preserving maps arise in the study of conservative dynamical systems describing a wide variety of physical phenomena, from the rotation of planets to the dynamics of a fluid. The visual inspection of these maps reveals a remarkable topological picture in which invariant manifolds form the fractal geometric scaffold of both quasi-periodic and chaotic regions. We discuss in this paper the visualization of such maps built upon these invariant manifolds. This approach is in stark contrast with the discrete Poincare plots that are typically used for the visual inspection of maps. We propose to that end several modified definitions of the finite-time Lyapunov exponents that we apply to reveal the underlying structure of the dynamics. We examine the impact of various parameters and the numerical aspects that pertain to the implementation of this method. We apply our technique to a standard analytical example and to a numerical simulation of magnetic confinement in a fusion reactor. In both cases our simple method is able to reveal salient structures across spatial scales and to yield expressive images across application domains.
C. Vachet, B. Yvernault, K. Bhatt, R.G. Smith, G. Gerig, H.C. Hazlett, M.A. Styner.
“Automatic corpus callosum segmentation using a deformable active Fourier contour model,” In Proceedings of Medical Imaging 2012: Biomedical Applications in Molecular, Structural, and Functional Imaging, SPIE, Vol. 8317, 831707, 2012.
DOI: 10.1117/12.911504
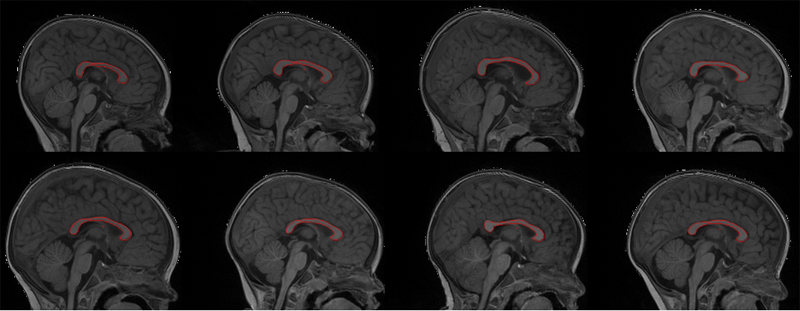
The corpus callosum (CC) is a structure of interest in many neuroimaging studies of neuro-developmental pathology such as autism. It plays an integral role in relaying sensory, motor and cognitive information from homologous regions in both hemispheres.
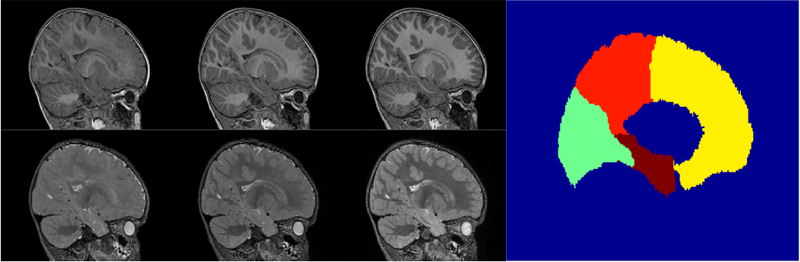
We have developed a framework that allows automatic segmentation of the corpus callosum and its lobar subdivisions. Our approach employs constrained elastic deformation of exible Fourier contour model, and is an extension of Szekely's 2D Fourier descriptor based Active Shape Model. The shape and appearance model, derived from a large mixed population of 150+ subjects, is described with complex Fourier descriptors in a principal component shape space. Using MNI space aligned T1w MRI data, the CC segmentation is initialized on the mid-sagittal plane using the tissue segmentation. A multi-step optimization strategy, with two constrained steps and a final unconstrained step, is then applied. If needed, interactive segmentation can be performed via contour repulsion points. Lobar connectivity based parcellation of the corpus callosum can finally be computed via the use of a probabilistic CC subdivision model.
Our analysis framework has been integrated in an open-source, end-to-end application called CCSeg both with a command line and Qt-based graphical user interface (available on NITRC). A study has been performed to quantify the reliability of the semi-automatic segmentation on a small pediatric dataset. Using 5 subjects randomly segmented 3 times by two experts, the intra-class correlation coeficient showed a superb reliability (0.99). CCSeg is currently applied to a large longitudinal pediatric study of brain development in autism.
V. Valderrabano, G.I. Pangenstert, A.M. Müller, J. Paul, H.B. Henninger, A. Barg.
“Mobile- and Fixed-Bearing Total Ankle Prostheses : Is There Really a Difference?,” In Foot and Ankle Clinics, Vol. 17, No. 4, pp. 565--585. 2012.
DOI: 10.1016/j.fcl.2012.08.005
A. Vardhan, M.W. Prastawa, S. Gouttard, J. Piven, G. Gerig.
“Quantifying regional growth patterns through longitudinal analysis of distances between multimodal MR intensity distributions,” In Proceedings of IEEE ISBI 2012, pp. 1156--1159. 2012.
DOI: 10.1109/ISBI.2012.6235765
Quantitative analysis of early brain development through imaging is critical for identifying pathological development, which may in turn affect treatment procedures. We propose a framework for analyzing spatiotemporal patterns of brain maturation by quantifying intensity changes in longitudinal MR images. We use a measure of divergence between a pair of intensity distributions to study the changes that occur within specific regions, as well as between a pair of anatomical regions, over time. The change within a specific region is measured as the contrast between white matter and gray matter tissue belonging to that region. The change between a pair of regions is measured as the divergence between regional image appearances, summed over all tissue classes. We use kernel regression to integrate the temporal information across different subjects in a consistent manner. We applied our method on multimodal MRI data with T1-weighted (T1W) and T2-weighted (T2W) scans of each subject at the approximate ages of 6 months, 12 months, and 24 months. The results demonstrate that brain maturation begins at posterior regions and that frontal regions develop later, which matches previously published histological, qualitative and morphometric studies. Our multimodal analysis also confirms that T1W and T2W modalities capture different properties of the maturation process, a phenomena referred to as T2 time lag compared to T1. The proposed method has potential for analyzing regional growth patterns across different populations and for isolating specific critical maturation phases in different MR modalities.
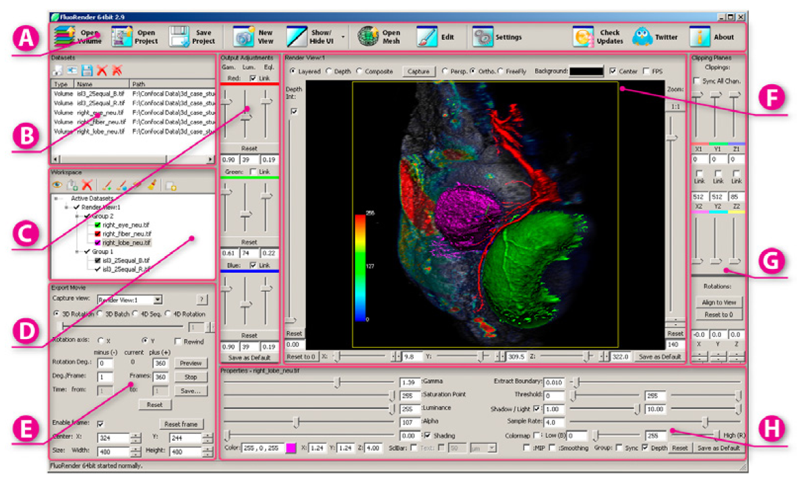
Y. Wan, H. Otsuna, C.-B. Chien, C.D. Hansen.
“FluoRender: An Application of 2D Image Space Methods for 3D and 4D Confocal Microscopy Data Visualization in Neurobiology Research,” In Proceedings of Pacific Vis 2012, Incheon, Korea, pp. 201--208. 2012.
DOI: 10.1109/PacificVis.2012.6183592
Keywords: scidac
Bo Wang, M.W. Prastawa, S.P. Awate, A. Irimia, M.C. Chambers, P.M. Vespa, J.D. Van Horn, G. Gerig.
“Segmentation of Serial MRI of TBI patients using Personalized Atlas Construction and Topological Change Estimation,” In Proceedings of IEEE ISBI 2012, pp. 1152--1155. 2012.
DOI: 10.1109/ISBI.2012.6235764
Bo Wang, M.W. Prastawa, A. Irimia, M.C. Chambers, P.M. Vespa, J.D. Van Horn, G. Gerig.
“A Patient-Specific Segmentation Framework for Longitudinal MR Images of Traumatic Brain Injury,” In Proceedings of Medical Imaging 2012: Image Processing, SPIE, pp. 831402-831402-7. 2012.
DOI: 10.1117/12.911043

Traumatic brain injury (TBI) is a major cause of death and disability worldwide. Robust, reproducible segmentations of MR images with TBI are crucial for quantitative analysis of recovery and treatment efficacy. However, this is a significant challenge due to severe anatomy changes caused by edema (swelling), bleeding, tissue deformation, skull fracture, and other effects related to head injury. In this paper, we introduce a multi-modal image segmentation framework for longitudinal TBI images. The framework is initialized through manual input of primary lesion sites at each time point, which are then refined by a joint approach composed of Bayesian segmentation and construction of a personalized atlas. The personalized atlas construction estimates the average of the posteriors of the Bayesian segmentation at each time point and warps the average back to each time point to provide the updated priors for Bayesian segmentation. The difference between our approach and segmenting longitudinal images independently is that we use the information from all time points to improve the segmentations. Given a manual initialization, our framework automatically segments healthy structures (white matter, grey matter, cerebrospinal fluid) as well as different lesions such as hemorrhagic lesions and edema. Our framework can handle different sets of modalities at each time point, which provides flexibility in analyzing clinical scans. We show results on three subjects with acute baseline scans and chronic follow-up scans. The results demonstrate that joint analysis of all the points yields improved segmentation compared to independent analysis of the two time points.
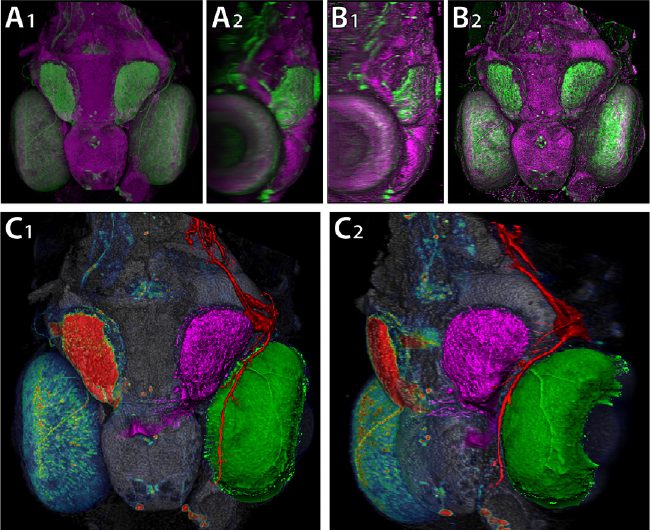
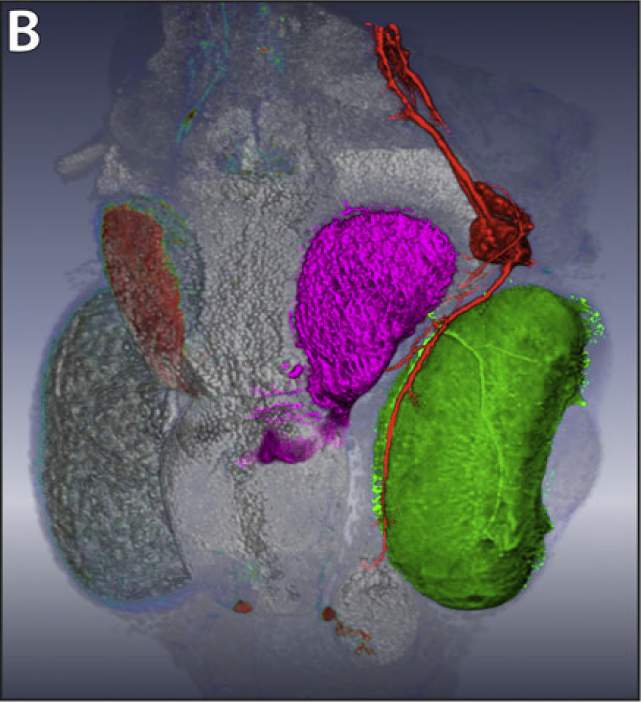
Y. Wan, H. Otsuna, C.-B. Chien, C.D. Hansen.
“Interactive Extraction of Neural Structures with User-Guided Morphological Diffusion,” In Proceedings of the IEEE Symposium on Biological Data Visualization, pp. 1--8. 2012.
DOI: 10.1109/BioVis.2012.6378577
Y. Wan, A.K. Lewis, M. Colasanto, M. van Langeveld, G. Kardon, C.D. Hansen.
“A Practical Workflow for Making Anatomical Atlases in Biological Research,” In IEEE Computer Graphics and Applications, Vol. 32, No. 5, pp. 70--80. 2012.
DOI: 10.1109/MCG.2012.64
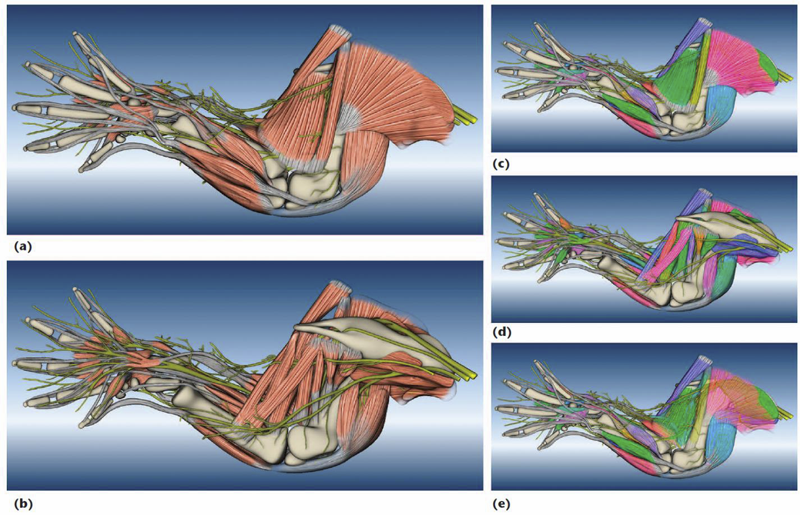
An anatomical atlas provides a detailed map for medical and biological studies of anatomy. These atlases are important for understanding normal anatomy and the development and function of structures, and for determining the etiology of congenital abnormalities. Unfortunately, for biologists, generating such atlases is difficult, especially ones with the informative content and aesthetic quality that characterize human anatomy atlases. Building such atlases requires knowledge of the species being studied and experience with an art form that can faithfully record and present this knowledge, both of which require extensive training in considerably different fields. (For some background on anatomical atlases, see the related sidebar.)
With the latest innovations in data acquisition and computing techniques, atlas building has changed dramatically. We can now create atlases from 3D images of biological specimens, allowing for high-quality, faithful representations. Labeling of structures using fluorescently tagged antibodies, confocal 3D scanning of these labeled structures, volume rendering, segmentation, and surface reconstruction techniques all promise solutions to the problem of building atlases.
However, biology researchers still ask, \"Is there a set of tools we can use or a practical workflow we can follow so that we can easily build models from our biological data?\" To help answer this question, computer scientists have developed many algorithms, tools, and program codes. Unfortunately, most of these researchers have tackled only one aspect of the problem or provided solutions to special cases. So, the general question of how to build anatomical atlases remains unanswered.
For a satisfactory answer, biologists need a practical workflow they can easily adapt for different applications. In addition, reliable tools that can fit into the workflow must be readily available. Finally, examples using the workflow and tools to build anatomical atlases would demonstrate these resources' utility for biological research.
To build a mouse limb atlas for studying the development of the limb musculoskeletal system, University of Utah biologists, artists, and computer scientists have designed a generalized workflow for generating anatomical atlases. We adapted it from a CG artist's workflow of building 3D models for animated films and video games. The tools we used to build the atlas were mostly commercial, industry-standard software packages. Having been developed, tested, and employed for industrial use for decades, CG artists' workflow and tools, with certain adaptations, are the most suitable for making high-quality anatomical atlases, especially under strict budgetary and time limits. Biological researchers have been largely unaware of these resources. By describing our experiences in this project, we hope to show biologists how to use these resources to make anatomically accurate, high-quality, and useful anatomical atlases.
V.G. Weirs, N. Fabian, K. Potter, L. McNamara, T. Otahal.
“Uncertainty in the Development and Use of Equation of State Models,” In International Journal for Uncertainty Quantification, pp. 255--270. 2012.
DOI: 10.1615/Int.J.UncertaintyQuantification.2012003960
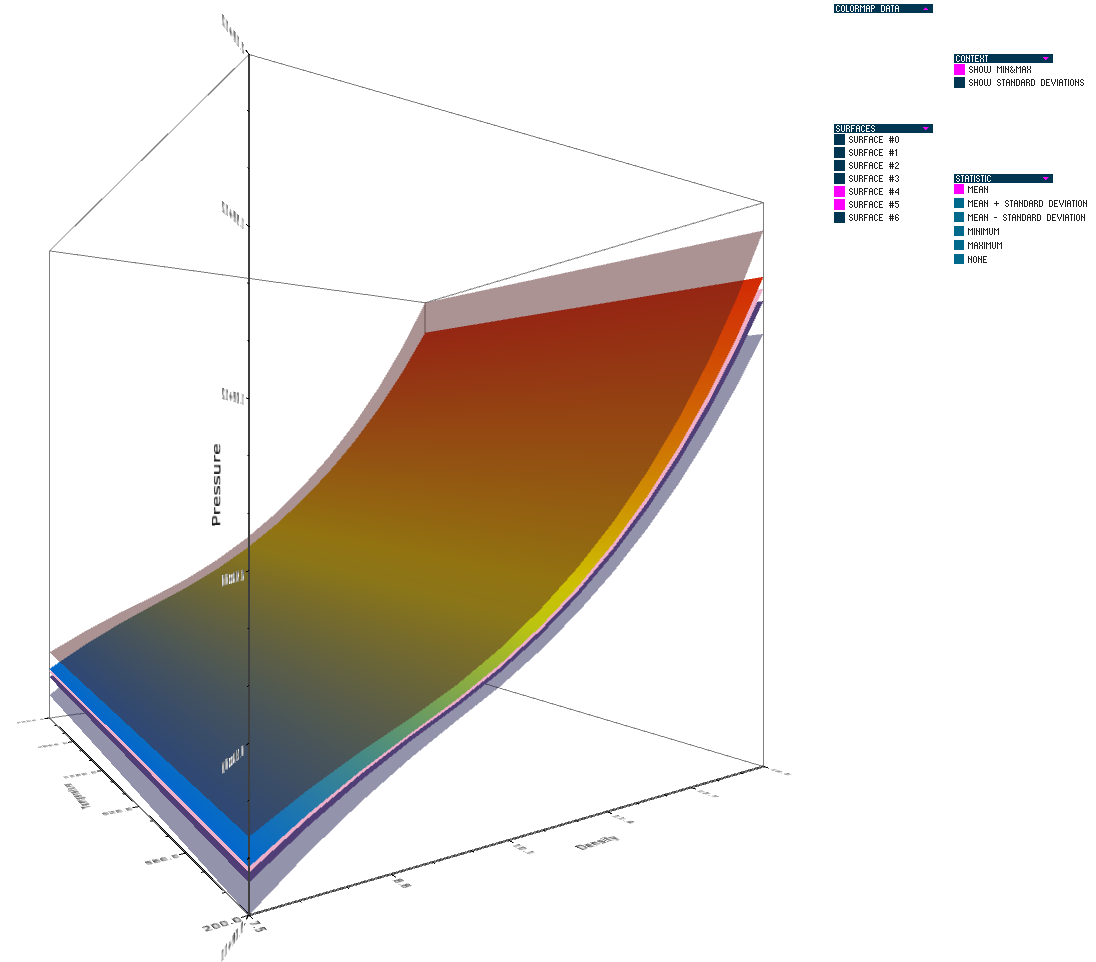
Keywords: netl
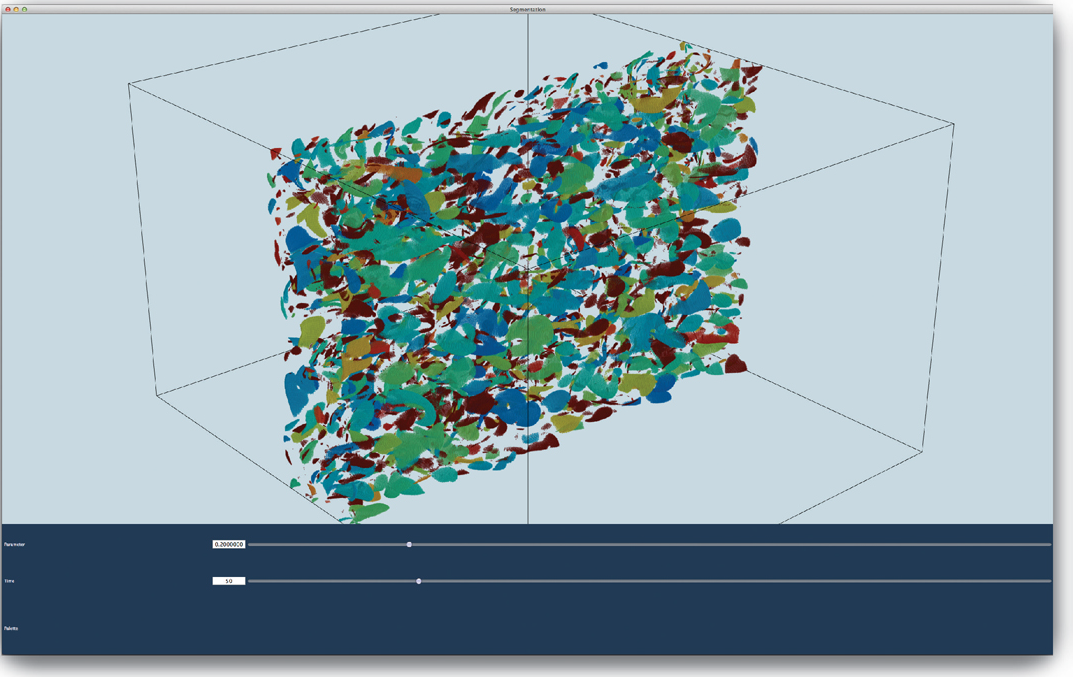
W. Widanagamaachchi, C. Christensen, P.-T. Bremer, V. Pascucci.
“Interactive Exploration of Large-scale Time-varying Data using Dynamic Tracking Graphs,” In 2012 IEEE Symposium on Large Data Analysis and Visualization (LDAV), pp. 9--17. 2012.
DOI: 10.1109/LDAV.2012.6378962
J.J. Wolff, H. Gu, G. Gerig, J.T. Elison, M. Styner, S. Gouttard, K.N. Botteron, S.R. Dager, G. Dawson, A.M. Estes, A. Evans, H.C. Hazlett, P. Kostopoulos, R.C. McKinstry, S.J. Paterson, R.T. Schultz, L. Zwaigenbaum, J. Piven.
“Differences in White Matter Fiber Tract Development Present from 6 to 24 Months in Infants with Autism,” In American Journal of Psychiatry (AJP), Note: Selected as an AJP Best of 2012 paper., pp. 1--12. 2012.
DOI: 10.1176/appi.ajp.2011.11091447
Objective: Evidence from prospective studies of high-risk infants suggests that early symptoms of autism usually emerge late in the first or early in the second year of life after a period of relatively typical development. The authors prospectively examined white matter fiber tract organization from 6 to 24 months in high-risk infants who developed autism spectrum disorders (ASDs) by 24 months.
Method: The participants were 92 highrisk infant siblings from an ongoing imaging study of autism. All participants had diffusion tensor imaging at 6 months and behavioral assessments at 24 months; a majority contributed additional imaging data at 12 and/or 24 months. At 24 months, 28 infants met criteria for ASDs and 64 infants did not. Microstructural properties of white matter fiber tracts reported to be associated with ASDs or related behaviors were characterized by fractional anisotropy and radial and axial diffusivity.
Results: The fractional anisotropy trajectories for 12 of 15 fiber tracts differed significantly between the infants who developed ASDs and those who did not. Development for most fiber tracts in the infants with ASDs was characterized by higher fractional anisotropy values at 6 months followed by slower change over time relative to infants without ASDs. Thus, by 24 months of age, those with ASDs had lower values.
Conclusions: These results suggest that aberrant development of white matter pathways may precede the manifestation of autistic symptoms in the first year of life. Longitudinal data are critical to characterizing the dynamic age-related brain and behavior changes underlying this neurodevelopmental disorder.
P.C. Wong, H.-W. Shen, C.R. Johnson, C. Chen, R.B. Ross.
“The Top 10 Challenges in Extreme-Scale Visual Analytics,” In IEEE Computer Graphics and Applications, pp. 63--67. July-August, 2012.
DOI: 10.1109/MCG.2012.87
PubMed ID: 24489426
PubMed Central ID: PMC3907777
In this issue of CG&A, researchers share their R&D findings and results on applying visual analytics (VA) to extreme-scale data. Having surveyed these articles and other R&D in this field, we've identified what we consider the top challenges of extreme-scale VA. To cater to the magazine's diverse readership, our discussion evaluates challenges in all areas of the field, including algorithms, hardware, software, engineering, and social issues.
Keywords: scidac, Large-scale systems, Visual analytics, computer graphics, extreme-scale visual analytics, high-performance computing, interaction, large-data visualization, user interfaces, visual analytics
P.C. Wong, H. Shen, V. Pascucci.
“Extreme-Scale Visual Analytics,” In IEEE Computer Graphics and Applications, Vol. 32, No. 4, pp. 23--25. 2012.
DOI: 10.1109/MCG.2012.73
Extreme-scale visual analytics (VA) is about applying VA to extreme-scale data. The articles in this special issue examine advances related to extreme-scale VA problems, their analytical and computational challenges, and their real-world applications.
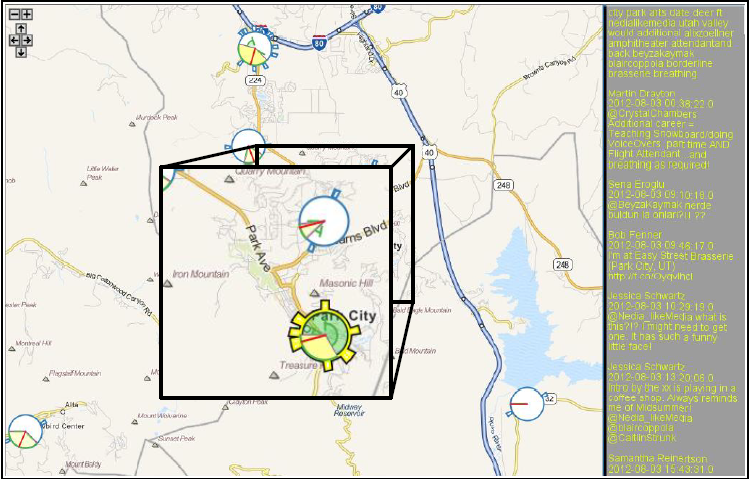
C. Yang, I. Jensen, P. Rosen.
“A Multiscale Approach to Network Event Identification using Geolocated Twitter Data,” In First IMC Workshop on Internet Visualization (WIV 2012), pp. (accepted). 2012.
L. Zhou, M. Schott, C.D. Hansen.
“Transfer Function Combinations,” In Computers and Graphics, Vol. 36, No. 6, pp. 596--606. October, 2012.
DOI: 10.1016/j.cag.2012.02.007
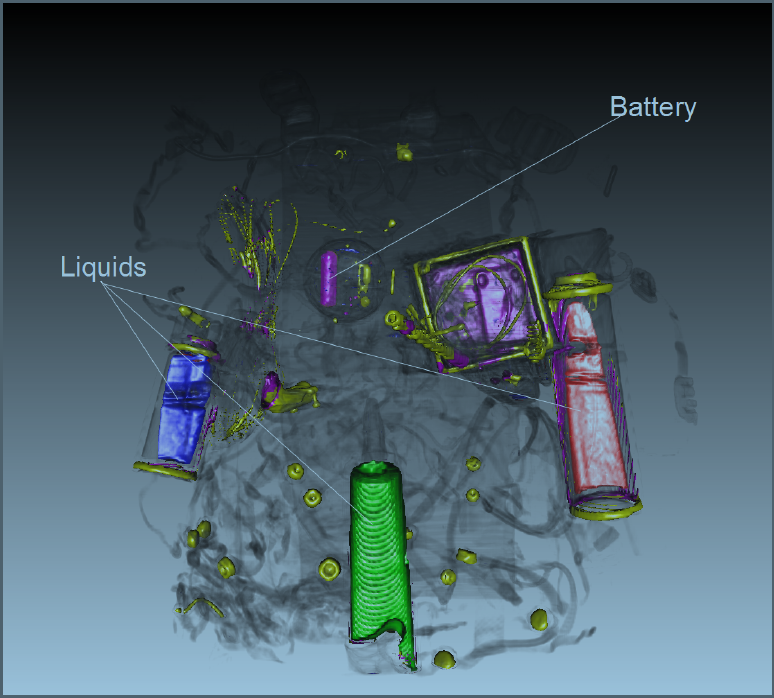
Keywords: transfer function, volume rendering, classification, user interface, nih, scidac, kaust
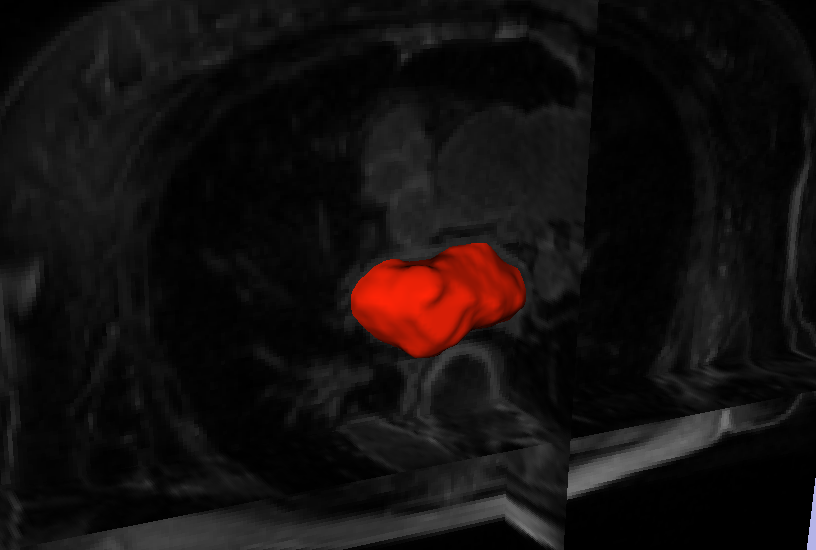
L. Zhu, Y. Gao, A. Yezzi, R.S. MacLeod, J. Cates, A. Tannenbaum.
“Automatic Segmentation of the Left Atrium from MRI Images using Salient Feature and Contour Evolution,” In Proceedings of the 34th Annual International Conference of the IEEE EMBS, pp. 3211--214. 2012.
DOI: 10.1109/EMBC.2012.6346648
PubMed ID: 23366609
PubMed Central ID: PMC3652873