SCI Publications
2012


T. Ziemek, S. Creem-Regehr, W. Thompson, R.T. Whitaker.
“Evaluating the effectiveness of orientation indicators with an awareness of individual differences,” In ACM Transactions on Applied Perception (TAP), Vol. 9, No. 2, pp. Article 7. 2012.
DOI: 10.1145/2207216.2207218
B.A. Zielinski, J.S. Anderson, A.L. Froehlich, M.B.D. Prigge, J.A. Nielsen, J.R. Cooperrider, A.N. Cariello, P.T. Fletcher, A.L. Alexander, Nicholas Lange, Erin D Bigler, Janet E Lainhart.
“scMRI Reveals Large-Scale Brain Network Abnormalities in Autism,” In PloS one, Vol. 7, No. 11, pp. e49172. 2012.
DOI: 10.1371/journal.pone.0049172
2011
S. Ahern, A. Shoshani, K.L. Ma, A. Choudhary, T. Critchlow, S. Klasky, V. Pascucci.
“Scientific Discovery at the Exascale: Report from the (DOE) (ASCR) 2011 Workshop on Exascale Data Management, Analysis, and Visualization,” Note: Office of Scientific and Technical Information (OSTI), January, 2011.
DOI: 10.2172/1011053
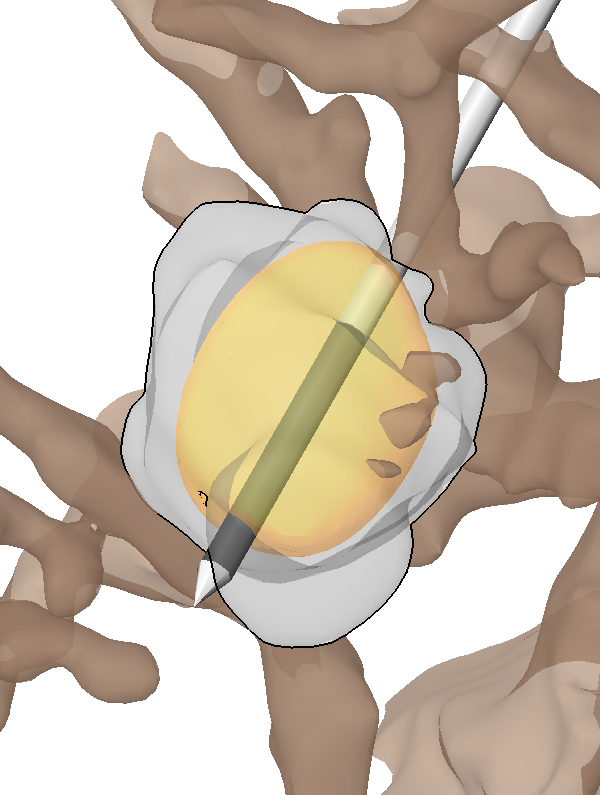
N. Akoum, M. Daccarett, C. McGann, N. Segerson, G. Vergara, S. Kuppahally, T. Badger, N. Burgon, T. Haslam, E. Kholmovski, R.S. MacLeod, N.F. Marrouche.
“Atrial fibrosis helps select the appropriate patient and strategy in catheter ablation of atrial fibrillation: a DE-MRI guided approach,” In Journal of Cardiovascular Electrophysiology, Vol. 22, No. 1, pp. 16--22. 2011.
DOI: 10.1111/j.1540-8167.2010.01876.x
PubMed ID: 20807271
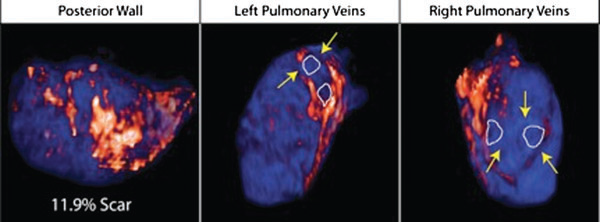
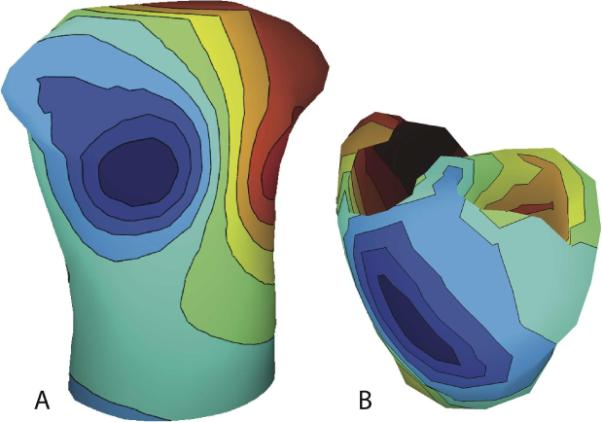
Atrial fibrillation (AF) is the most common sustained arrhythmia encountered in adult cardiology.1,2 Several studies have demonstrated that AF is associated with electrical, contractile, and structural remodeling (SRM) in the left atrium (LA) that contributes to the persistence and sustainability of the arrhythmia.3-7 It has also been shown that the end result of this remodeling process is loss of atrial myocytes and increased collagen content and hence fibrosis of the LA wall.5 Delayed enhancement MRI (DE-MRI) using gadolinium contrast has been demonstrated to localize and quantify the degree of SRM or fibrosis associated with AF in the LA.8
DE-MRI has also been shown to be useful in localizing and quantifying scar formation in the LA following radiofrequency ablation (RFA).9,10 The pulmonary vein (PV) antral region can be visualized to assess circumferential PV scarring that results from RFA lesions/ablation. In addition, the amount of scarring to the LA after catheter ablation can be quantified as a proportion of the total left atrial volume.
Rhythm control of AF using catheter ablation has yielded varying results in different patient populations.11 Identifying the ideal candidate for catheter ablation remains a significant challenge. In addition, a number of different approaches to catheter ablation have been reported and most experts agree that 1 ablation strategy does not fit allAF patients.11-15 Therefore, selecting the proper strategy for a particular patient is also an important determinant of procedure success.
We used DE-MRI to quantify both the degree of SRM/fibrosis pre-ablation and scar formation post ablation. Our aim was to identify predictors of successful ablation in a group of patients stratified according to pre-ablation fibrosis. This would help select the most appropriate ablation strategy for the individual AF ablation candidate.
I. Altrogge, T. Preusser, T. Kroeger, S. Haase, T. Paetz, R.M. Kirby.
“Sensitivity Analysis for the Optimization of Radiofrequency Ablation in the Presence of Material Parameter Uncertainty,” In International Journal for Uncertainty Quantification, 2011.
Keywords: netl, stochastic sensitivity analysis, stochastic partial di erential equations, stochastic nite element method, adaptive sparse grid, heat transfer, multiscale modeling, representation of uncertainty
J.R. Anderson, B.W. Jones, C.B. Watt, M.V. Shaw, J.-H. Yang, D. DeMill, J.S. Lauritzen, Y. Lin, K.D. Rapp, D. Mastronarde, P. Koshevoy, B. Grimm, T. Tasdizen, R.T. Whitaker, R.E. Marc.
“Exploring the Retinal Connectome,” In Molecular Vision, Vol. 17, pp. 355--379. 2011.
PubMed ID: 21311605
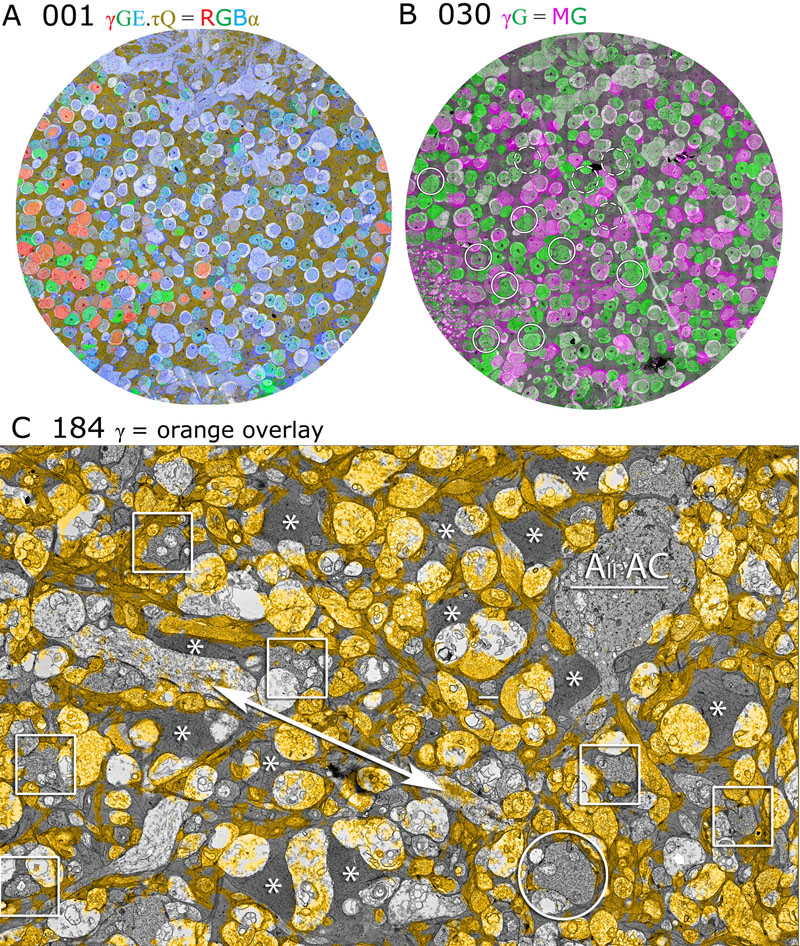
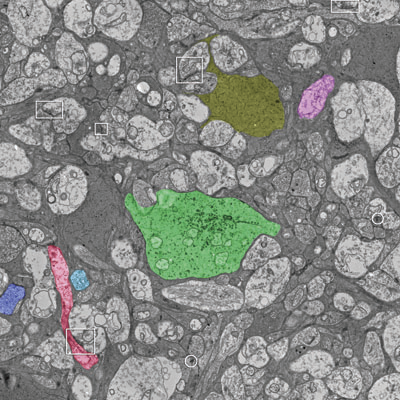
Purpose: A connectome is a comprehensive description of synaptic connectivity for a neural domain. Our goal was to produce a connectome data set for the inner plexiform layer of the mammalian retina. This paper describes our first retinal connectome, validates the method, and provides key initial findings.
Methods: We acquired and assembled a 16.5 terabyte connectome data set RC1 for the rabbit retina at .2 nm resolution using automated transmission electron microscope imaging, automated mosaicking, and automated volume registration. RC1 represents a column of tissue 0.25 mm in diameter, spanning the inner nuclear, inner plexiform, and ganglion cell layers. To enhance ultrastructural tracing, we included molecular markers for 4-aminobutyrate (GABA), glutamate, glycine, taurine, glutamine, and the in vivo activity marker, 1-amino-4-guanidobutane. This enabled us to distinguish GABAergic and glycinergic amacrine cells; to identify ON bipolar cells coupled to glycinergic cells; and to discriminate different kinds of bipolar, amacrine, and ganglion cells based on their molecular signatures and activity. The data set was explored and annotated with Viking, our multiuser navigation tool. Annotations were exported to additional applications to render cells, visualize network graphs, and query the database.
Results: Exploration of RC1 showed that the 2 nm resolution readily recapitulated well known connections and revealed several new features of retinal organization: (1) The well known AII amacrine cell pathway displayed more complexity than previously reported, with no less than 17 distinct signaling modes, including ribbon synapse inputs from OFF bipolar cells, wide-field ON cone bipolar cells and rod bipolar cells, and extensive input from cone-pathway amacrine cells. (2) The axons of most cone bipolar cells formed a distinct signal integration compartment, with ON cone bipolar cell axonal synapses targeting diverse cell types. Both ON and OFF bipolar cells receive axonal veto synapses. (3) Chains of conventional synapses were very common, with intercalated glycinergic-GABAergic chains and very long chains associated with starburst amacrine cells. Glycinergic amacrine cells clearly play a major role in ON-OFF crossover inhibition. (4) Molecular and excitation mapping clearly segregates ultrastructurally defined bipolar cell groups into different response clusters. (5) Finally, low-resolution electron or optical imaging cannot reliably map synaptic connections by process geometry, as adjacency without synaptic contact is abundant in the retina. Only direct visualization of synapses and gap junctions suffices.
Conclusions: Connectome assembly and analysis using conventional transmission electron microscopy is now practical for network discovery. Our surveys of volume RC1 demonstrate that previously studied systems such as the AII amacrine cell network involve more network motifs than previously known. The AII network, primarily considered a scotopic pathway, clearly derives ribbon synapse input from photopic ON and OFF cone bipolar cell networks and extensive photopic GABAergic amacrine cell inputs. Further, bipolar cells show extensive inputs and outputs along their axons, similar to multistratified nonmammalian bipolar cells. Physiologic evidence of significant ON-OFF channel crossover is strongly supported by our anatomic data, showing alternating glycine-to-GABA paths. Long chains of amacrine cell networks likely arise from homocellular GABAergic synapses between starburst amacrine cells. Deeper analysis of RC1 offers the opportunity for more complete descriptions of specific networks.
Keywords: neuroscience, retina, vision, blindness, visus, crcns
E.W. Anderson, K.C. Potter, L.E. Matzen, J.F. Shepherd, G.A. Preston, C.T. Silva.
“A User Study of Visualization Effectiveness Using EEG and Cognitive Load,” In Computer Graphics Forum, Vol. 30, No. 3, Note: Awarded 2nd Best Paper!, Edited by H. Hauser and H. Pfister and J.J. van Wijk, pp. 791--800. June, 2011.
DOI: 10.1111/j.1467-8659.2011.01928.x

Effectively evaluating visualization techniques is a difficult task often assessed through feedback from user studies and expert evaluations. This work presents an alternative approach to visualization evaluation in which brain activity is passively recorded using electroencephalography (EEG). These measurements are used to compare different visualization techniques in terms of the burden they place on a viewer's cognitive resources. In this paper, EEG signals and response times are recorded while users interpret different representations of data distributions. This information is processed to provide insight into the cognitive load imposed on the viewer. This paper describes the design of the user study performed, the extraction of cognitive load measures from EEG data, and how those measures are used to quantitatively evaluate the effectiveness of visualizations.
N. Andrysco, P. Rosen, V. Popescu, B. Benes, K.R. Gurney.
“Experiences in Disseminating Educational Visualizations,” In Lecture Notes in Computer Science (7th International Symposium on Visual Computing), Vol. 2, pp. 239--248. September, 2011.
DOI: 10.1007/978-3-642-24031-7_24
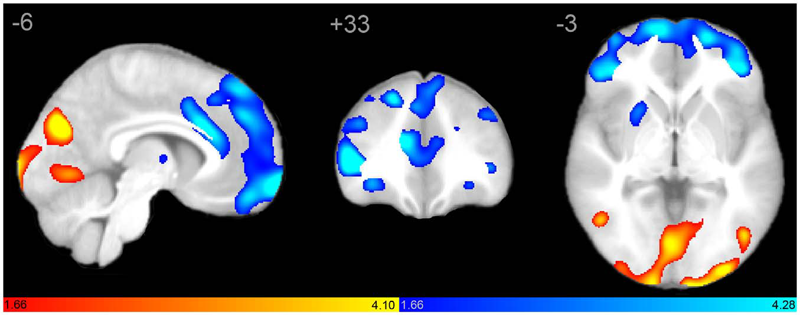
J.S. Anderson, J.A. Nielsen, A.L. Froehlich, M.B. DuBray, T.J. Druzgal, A.N. Cariello, J.R. Cooperrider, B.A. Zielinski, C. Ravichandran, P.T. Fletcher, A.L. Alexander, E.D. Bigler, N. Lange, J.E. Lainhart.
“Functional connectivity magnetic resonance imaging classification of autism,” In Brain, pp. (published online). 2011.
DOI: 10.1093/brain/awr263
PubMed ID: 22006979
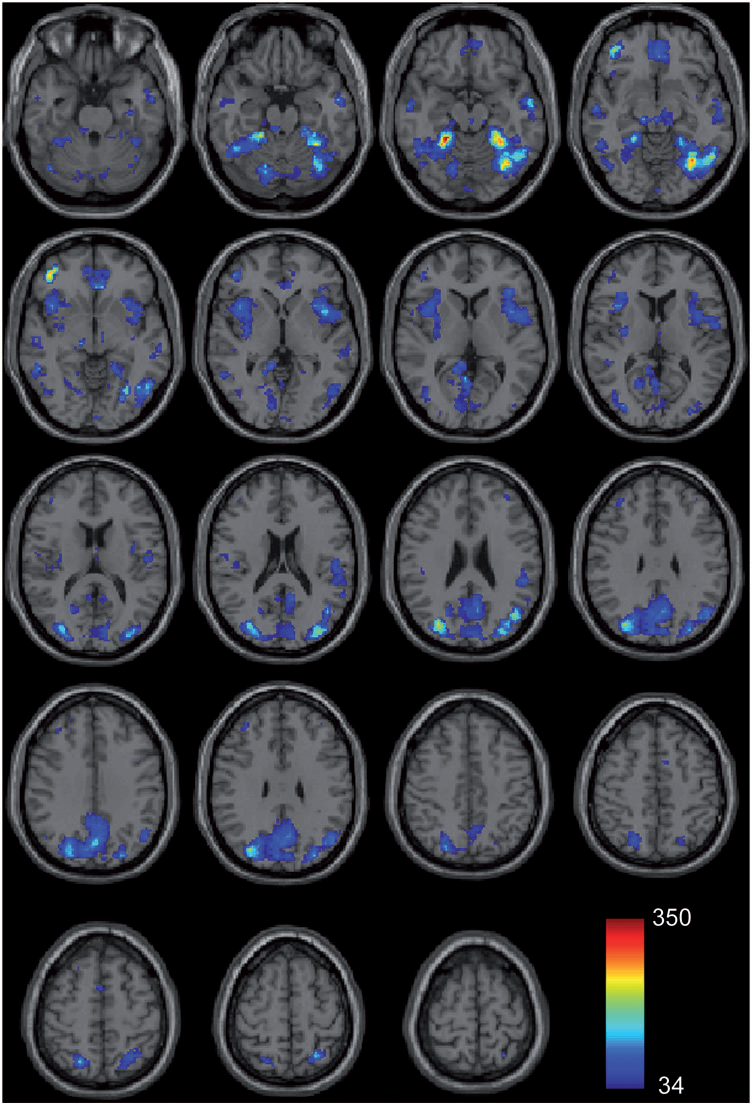
Group differences in resting state functional magnetic resonance imaging connectivity between individuals with autism and typically developing controls have been widely replicated for a small number of discrete brain regions, yet the whole-brain distribution of connectivity abnormalities in autism is not well characterized. It is also unclear whether functional connectivity is sufficiently robust to be used as a diagnostic or prognostic metric in individual patients with autism. We obtained pairwise functional connectivity measurements from a lattice of 7266 regions of interest covering the entire grey matter (26.4 million connections) in a well-characterized set of 40 male adolescents and young adults with autism and 40 age-, sex- and IQ-matched typically developing subjects. A single resting state blood oxygen level-dependent scan of 8 min was used for the classification in each subject. A leave-one-out classifier successfully distinguished autism from control subjects with 83% sensitivity and 75\% specificity for a total accuracy of 79\% (P = 1.1 x 10⁻⁷). In subjects less than 20 years of age, the classifier performed at 89\% accuracy (P = 5.4 x 10⁻⁷). In a replication dataset consisting of 21 individuals from six families with both affected and unaffected siblings, the classifier performed at 71\% accuracy (91\% accuracy for subjects less than 20 years of age). Classification scores in subjects with autism were significantly correlated with the Social Responsiveness Scale (P = 0.05), verbal IQ (P = 0.02) and the Autism Diagnostic Observation Schedule-Generic's combined social and communication subscores (P = 0.05). An analysis of informative connections demonstrated that region of interest pairs with strongest correlation values were most abnormal in autism. Negatively correlated region of interest pairs showed higher correlation in autism (less anticorrelation), possibly representing weaker inhibitory connections, particularly for long connections (Euclidean distance greater than 10 cm). Brain regions showing greatest differences included regions of the default mode network, superior parietal lobule, fusiform gyrus and anterior insula. Overall, classification accuracy was better for younger subjects, with differences between autism and control subjects diminishing after 19 years of age. Classification scores of unaffected siblings of individuals with autism were more similar to those of the control subjects than to those of the subjects with autism. These findings indicate feasibility of a functional connectivity magnetic resonance imaging diagnostic assay for autism.
J.R. Anderson, S. Mohammed, B.C. Grimm, B.W. Jones, P. Koshevoy, T. Tasdizen, R.T. Whitaker, R.E. Marc.
“The Viking viewer for connectomics: scalable multi-user annotation and summarization of large volume data sets,” In Journal of Microscopy, Vol. 241, No. 1, pp. 13--28. 2011.
DOI: 10.1111/j.1365-2818.2010.03402.x
Keywords: Annotation, automated electron microscopy, citizen science, computational methods, connectome, networks, visualization
G.A. Ateshian, M.B. Albro, S.A. Maas, J.A. Weiss.
“Finite element implementation of mechanochemical phenomena in neutral deformable porous media under finite deformation,” In Journal of Biomechanical Engineering, Vol. 133, No. 8, 2011.
DOI: 10.1115/1.4004810
J.C. Bennett, V. Krishnamoorthy, S. Liu, R.W. Grout, E.R. Hawkes, J.H. Chen, J. Shepherd, V. Pascucci, P.-T. Bremer.
“Feature-Based Statistical Analysis of Combustion Simulation Data,” In IEEE Transactions on Visualization and Computer Graphics, Proceedings of the 2011 IEEE Visualization Conference, Vol. 17, No. 12, pp. 1822--1831. 2011.
M. Berger, J.A. Levine, L.G. Nonato, G. Taubin, C.T. Silva.
“An End-to-End Framework for Evaluating Surface Reconstruction,” SCI Technical Report, No. UUSCI-2011-001, SCI Institute, University of Utah, 2011.
M.L. Berlanga, S. Phan, E.A. Bushong, S. Lamont, S. Wu, O. Kwon, B.S. Phung, M. Terada, T. Tasdizen, E. Martone, M.H. Ellisman.
“Three-dimensional reconstruction of serial mouse brain sections using high-resolution large-scale mosaics,” In Frontiers in Neuroscience Methods, Vol. 5, pp. (published online). March, 2011.
DOI: 10.3389/fnana.2011.00017
H. Bhatia, S. Jadhav, P.-T. Bremer, G. Chen, J.A. Levine, L.G. Nonato, V. Pascucci.
“Edge Maps: Representing Flow with Bounded Error,” In Proceedings of IEEE Pacific Visualization Symposium 2011, Hong Kong, China, Note: Won Best Paper Award!, pp. 75--82. March, 2011.
DOI: 10.1109/PACIFICVIS.2011.5742375
H. Bhatia, S. Jadhav, P.-T. Bremer, G. Chen, J.A. Levine, L.G. Nonato, V. Pascucci.
“Flow Visualization with Quantified Spatial and Temporal Errors using Edge Maps,” In IEEE Transactions on Visualization and Computer Graphics (TVCG), Vol. 18, No. 9, IEEE Society, pp. 1383--1396. 2011.
DOI: 10.1109/TVCG.2011.265
C. Brownlee, V. Pegoraro, S. Shankar, P.S. McCormick, C.D. Hansen.
“Physically-Based Interactive Flow Visualization Based on Schlieren and Interferometry Experimental Techniques,” In IEEE Transactions on Visualization and Computer Graphics, Vol. 17, No. 11, pp. 1574--1586. 2011.
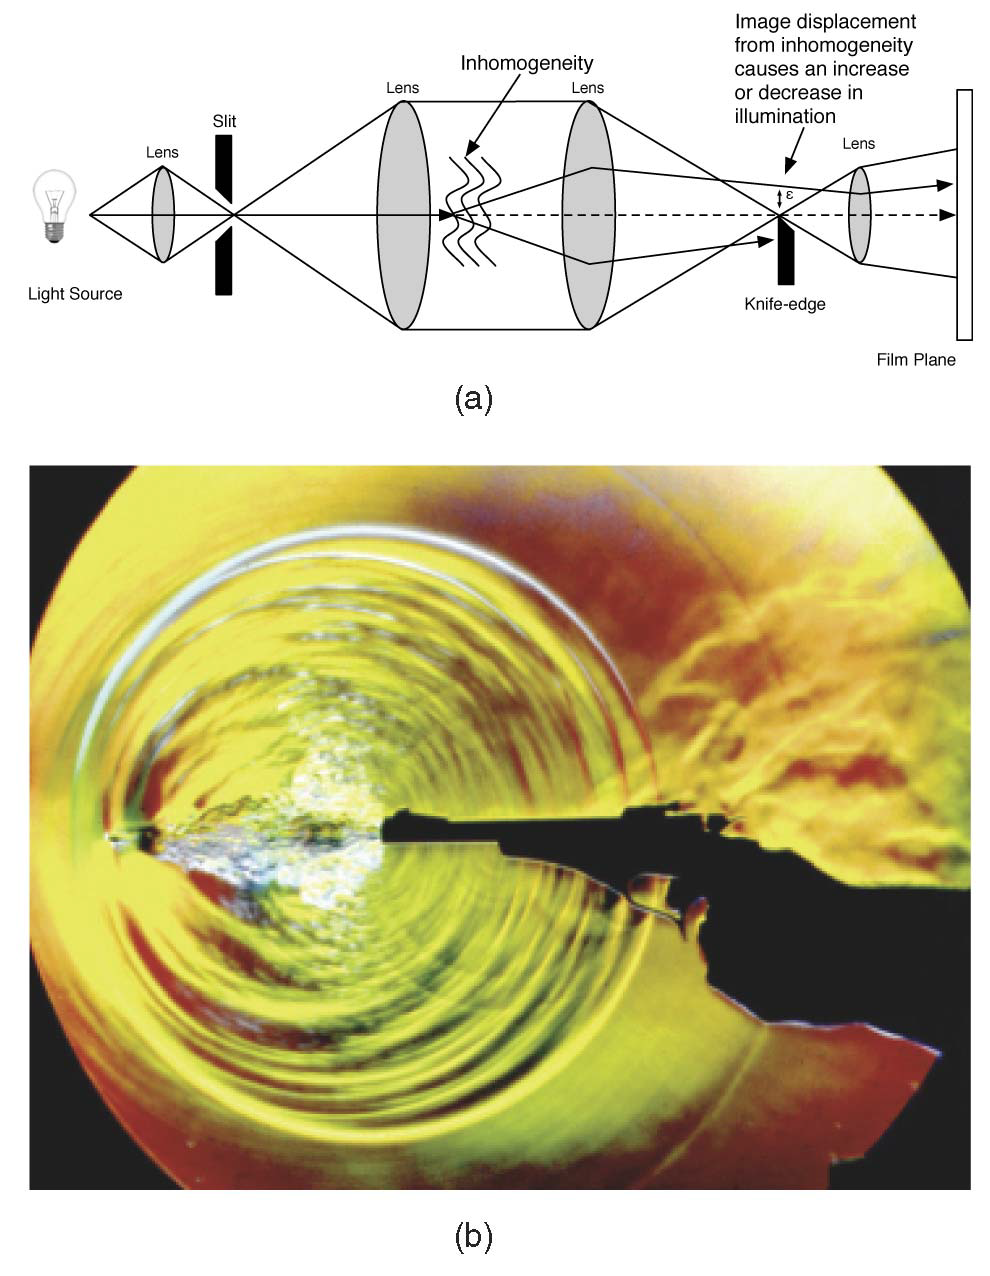
Understanding fluid flow is a difficult problem and of increasing importance as computational fluid dynamics (CFD) produces an abundance of simulation data. Experimental flow analysis has employed techniques such as shadowgraph, interferometry, and schlieren imaging for centuries, which allow empirical observation of inhomogeneous flows. Shadowgraphs provide an intuitive way of looking at small changes in flow dynamics through caustic effects while schlieren cutoffs introduce an intensity gradation for observing large scale directional changes in the flow. Interferometry tracks changes in phase-shift resulting in bands appearing. The combination of these shading effects provides an informative global analysis of overall fluid flow. Computational solutions for these methods have proven too complex until recently due to the fundamental physical interaction of light refracting through the flow field. In this paper, we introduce a novel method to simulate the refraction of light to generate synthetic shadowgraph, schlieren and interferometry images of time-varying scalar fields derived from computational fluid dynamics data. Our method computes physically accurate schlieren and shadowgraph images at interactive rates by utilizing a combination of GPGPU programming, acceleration methods, and data-dependent probabilistic schlieren cutoffs. Applications of our method to multifield data and custom application-dependent color filter creation are explored. Results comparing this method to previous schlieren approximations are finally presented.
Keywords: uintah, c-safe
C. Brownlee, V. Pegoraro, S. Shankar, P.S. McCormick, C.D. Hansen.
“Physically-Based Interactive Flow Visualization Based on Schlieren and Interferometry Experimental Techniques,” In IEEE Transactions on Visualization and Computer Graphics, IEEE Transactions on Visualization and Computer Graphics, Vol. 17, No. 11, IEEE, pp. 1574--1586. November, 2011.
DOI: 10.1109/tvcg.2010.255
B.M. Burton, J.D. Tate, B. Erem, D.J. Swenson, D.F. Wang, D.H. Brooks, P.M. van Dam, R.S. MacLeod.
“A Toolkit for Forward/Inverse Problems in Electrocardiography within the SCIRun Problem Solving Environment,” In Proceedings of the 2011 IEEE Int. Conf. Engineering and Biology Society (EMBC), pp. 267--270. 2011.
DOI: 10.1109/IEMBS.2011.6090052
PubMed ID: 22254301
PubMed Central ID: PMC3337752
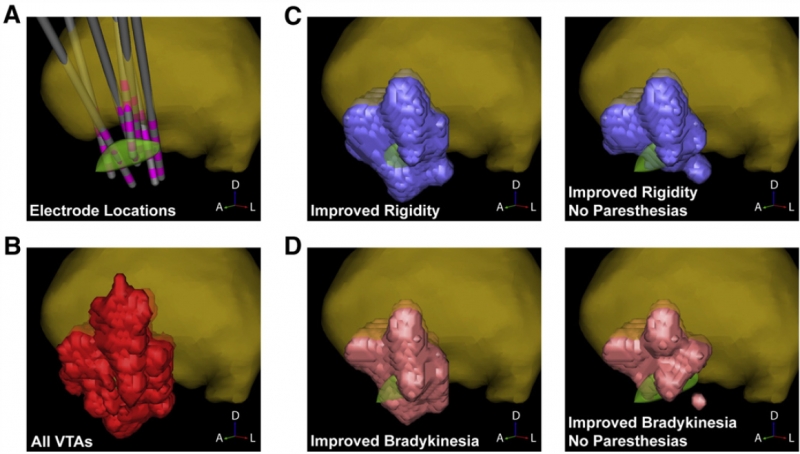
C.R. Butson, S.E. Cooper, J.M. Henderson, B. Wolgamuth, C.C. McIntyre.
“Probabilistic Analysis of Activation Volumes Generated During Deep Brain Stimulation,” In NeuroImage, Vol. 54, pp. 2096--2104. 2011.
ISSN: 1095-9572
DOI: 10.1016/j.neuroimage.2010.10.059
PubMed ID: 20974269