


Image Analysis
SCI's imaging work addresses fundamental questions in 2D and 3D image processing, including filtering, segmentation, surface reconstruction, and shape analysis. In low-level image processing, this effort has produce new nonparametric methods for modeling image statistics, which have resulted in better algorithms for denoising and reconstruction. Work with particle systems has led to new methods for visualizing and analyzing 3D surfaces. Our work in image processing also includes applications of advanced computing to 3D images, which has resulted in new parallel algorithms and real-time implementations on graphics processing units (GPUs). Application areas include medical image analysis, biological image processing, defense, environmental monitoring, and oil and gas.
Ross Whitaker
Segmentation


Chris Johnson
Diffusion Tensor Analysis
Funded Research Projects:
Publications in Image Analysis:
  Fractional Anisotropy Distributions in 2-6 Year-Old Children with Autism C. Cascio, M.J. Gribbin, S. Gouttard, R.G. Smith, M. Jomier, S.H. Field, M. Graves, H.C. Hazlett, K. Muller, G. Gerig, J. Piven. In Journal of Intellectual Disability Research (JIDR), pp. (in print). 2012. Background: Increasing evidence suggests that autism is a disorder of distributed neural networks that may exhibit abnormal developmental trajectories. Characterization of white matter early in the developmental course of the disorder is critical to understanding these aberrant trajectories. Methods: A cross-sectional study of 2-6 year old children with autism was conducted using diffusion tensor imaging combined with a novel statistical approach employing fractional anisotropy distributions. 58 children aged 18-79 months were imaged: 33 were diagnosed with autism, 8 with general developmental delay (DD), and 17 were typically developing (TD). Fractional anisotropy values within global white matter, cortical lobes, and the cerebellum were measured and transformed to random F distributions for each subject. Each distribution of values for a region was summarized by estimating delta, the estimated mean and standard deviation of the approximating F for each distribution. Results: The estimated delta parameter, delta-hat, was significantly decreased in individuals with autism compared to the combined control group. This was true in all cortical lobes, as well as in the cerebellum, but differences were strongest in the temporal lobe. Predicted developmental trajectories of delta-hat across the age range in the sample showed patterns that partially distinguished the groups. Exploratory analyses suggested that the variability, rather than the central tendency, component of delta-hat was the driving force behind these results. Conclusions: White matter in young children with autism appears to be abnormally homogeneous, which may reflect poorly organized or differentiated pathways, particularly in the temporal lobe, which is important for social and emotional cognition. |
|
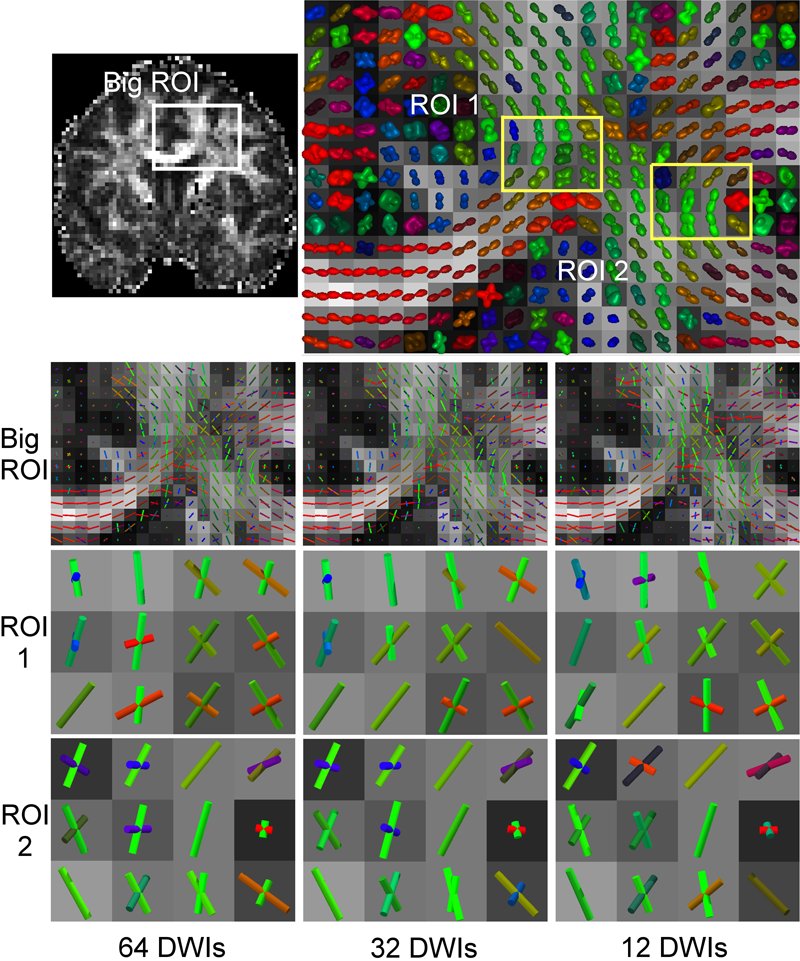
White matter structure assessment from reduced HARDI data using low-rank polynomial approximations Y. Gur, F. Jiao, S.X. Zhu, C.R. Johnson. In Proceedings of MICCAI 2012 Workshop on Computational Diffusion MRI (CDMRI12), Nice, France, Lecture Notes in Computer Science (LNCS), pp. 186-197. October, 2012. Assessing white matter fiber orientations directly from DWI measurements in single-shell HARDI has many advantages. One of these advantages is the ability to model multiple fibers using fewer parameters than are required to describe an ODF and, thus, reduce the number of DW samples needed for the reconstruction. However, fitting a model directly to the data using Gaussian mixture, for instance, is known as an initialization-dependent unstable process. This paper presents a novel direct fitting technique for single-shell HARDI that enjoys the advantages of direct fitting without sacrificing the accuracy and stability even when the number of gradient directions is relatively low. This technique is based on a spherical deconvolution technique and decomposition of a homogeneous polynomial into a sum of powers of linear forms, known as a symmetric tensor decomposition. The fiber-ODF (fODF), which is described by a homogeneous polynomial, is approximated here by a discrete sum of even-order linear-forms that are directly related to rank-1 tensors and represent single-fibers. This polynomial approximation is convolved to a single-fiber response function, and the result is optimized against the DWI measurements to assess the fiber orientations and the volume fractions directly. This formulation is accompanied by a robust iterative alternating numerical scheme which is based on the Levenberg- Marquardt technique. Using simulated data and in vivo, human brain data we show that the proposed algorithm is stable, accurate and can model complex fiber structures using only 12 gradient directions. |
|
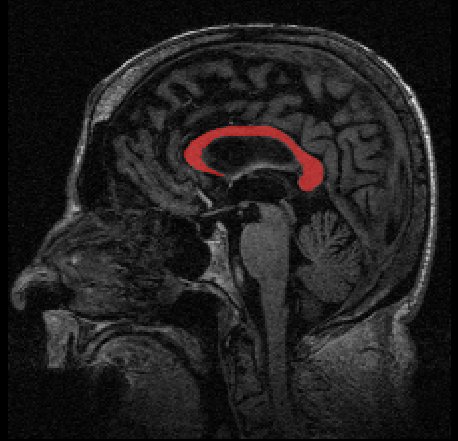
Sasaki Metrics for Analysis of Longitudinal Data on Manifolds P. Muralidharan, P.T. Fletcher. In Proceedings of the 2012 IEEE conference on Computer Vision and Pattern Recognition (CVPR), pp. 1027--1034. 2012. DOI: 10.1109/CVPR.2012.6247780 Longitudinal data arises in many applications in which the goal is to understand changes in individual entities over time. In this paper, we present a method for analyzing longitudinal data that take values in a Riemannian manifold. A driving application is to characterize anatomical shape changes and to distinguish between trends in anatomy that are healthy versus those that are due to disease. We present a generative hierarchical model in which each individual is modeled by a geodesic trend, which in turn is considered as a perturbation of the mean geodesic trend for the population. Each geodesic in the model can be uniquely parameterized by a starting point and velocity, i.e., a point in the tangent bundle. Comparison between these parameters is achieved through the Sasaki metric, which provides a natural distance metric on the tangent bundle. We develop a statistical hypothesis test for differences between two groups of longitudinal data by generalizing the Hotelling T2 statistic to manifolds. We demonstrate the ability of these methods to distinguish differences in shape changes in a comparison of longitudinal corpus callosum data in subjects with dementia versus healthily aging controls. |
| A System for Query Based Analysis and Visualization A.R. Sanderson, B. Whitlock, O. Reubel, H. Childs, G.H. Weber, Prabhat, K. Wu. In Proceedings of the Third International Eurovis Workshop on Visual Analytics EuroVA 2012, pp. 25--29. June, 2012. Today scientists are producing large volumes of data that they wish to explore and visualize. In this paper we describe a system that combines range-based queries with fast lookup to allow a scientist to quickly and efficiently ask \"what if?\" questions. Unique to our system is the ability to perform "cumulative queries" that work on both an intra- and inter-time step basis. The results of such queries are visualized as frequency histograms and are the input for secondary queries, the results of which are then visualized. |
|
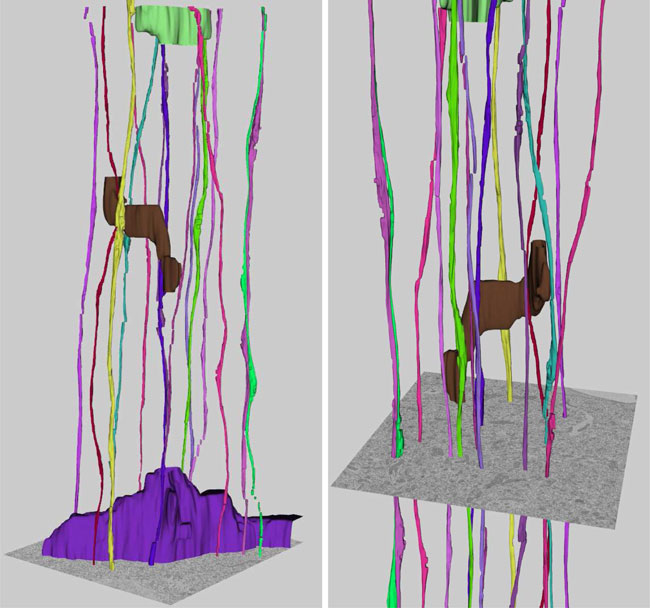
Semi-Automated Neuron Boundary Detection and Nonbranching Process Segmentation in Electron Microscopy Images E. Jurrus, S. Watanabe, R.J. Giuly, A.R.C. Paiva, M.H. Ellisman, E.M. Jorgensen, T. Tasdizen. In Neuroinformatics, pp. (published online). 2012. Neuroscientists are developing new imaging techniques and generating large volumes of data in an effort to understand the complex structure of the nervous system. The complexity and size of this data makes human interpretation a labor-intensive task. To aid in the analysis, new segmentation techniques for identifying neurons in these feature rich datasets are required. This paper presents a method for neuron boundary detection and nonbranching process segmentation in electron microscopy images and visualizing them in three dimensions. It combines both automated segmentation techniques with a graphical user interface for correction of mistakes in the automated process. The automated process first uses machine learning and image processing techniques to identify neuron membranes that deliniate the cells in each two-dimensional section. To segment nonbranching processes, the cell regions in each two-dimensional section are connected in 3D using correlation of regions between sections. The combination of this method with a graphical user interface specially designed for this purpose, enables users to quickly segment cellular processes in large volumes. |
|
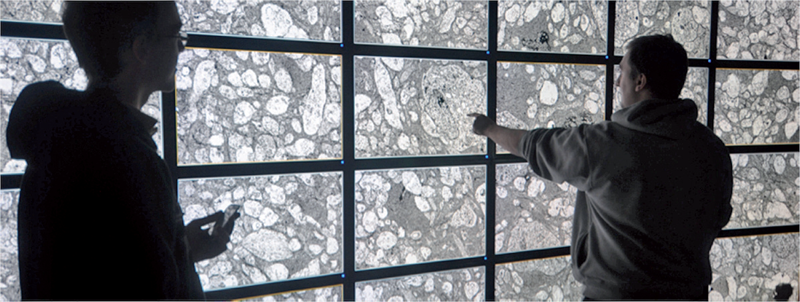
Biomedical Visual Computing: Case Studies and Challenges C.R. Johnson. In IEEE Computing in Science and Engineering, Vol. 14, No. 1, pp. 12--21. 2012. PubMed ID: 22545005 PubMed Central ID: PMC3336198 Computer simulation and visualization are having a substantial impact on biomedicine and other areas of science and engineering. Advanced simulation and data acquisition techniques allow biomedical researchers to investigate increasingly sophisticated biological function and structure. A continuing trend in all computational science and engineering applications is the increasing size of resulting datasets. This trend is also evident in data acquisition, especially in image acquisition in biology and medical image databases. For example, in a collaboration between neuroscientist Robert Marc and our research team at the University of Utah's Scientific Computing and Imaging (SCI) Institute (www.sci.utah.edu), we're creating datasets of brain electron microscopy (EM) mosaics that are 16 terabytes in size. However, while there's no foreseeable end to the increase in our ability to produce simulation data or record observational data, our ability to use this data in meaningful ways is inhibited by current data analysis capabilities, which already lag far behind. Indeed, as the NIH-NSF Visualization Research Challenges report notes, to effectively understand and make use of the vast amounts of data researchers are producing is one of the greatest scientific challenges of the 21st century. Visual data analysis involves creating images that convey salient information about underlying data and processes, enabling the detection and validation of expected results while leading to unexpected discoveries in science. This allows for the validation of new theoretical models, provides comparison between models and datasets, enables quantitative and qualitative querying, improves interpretation of data, and facilitates decision making. Scientists can use visual data analysis systems to explore \"what if\" scenarios, define hypotheses, and examine data under multiple perspectives and assumptions. In addition, they can identify connections between numerous attributes and quantitatively assess the reliability of hypotheses. In essence, visual data analysis is an integral part of scientific problem solving and discovery. As applied to biomedical systems, visualization plays a crucial role in our ability to comprehend large and complex data-data that, in two, three, or more dimensions, convey insight into many diverse biomedical applications, including understanding neural connectivity within the brain, interpreting bioelectric currents within the heart, characterizing white-matter tracts by diffusion tensor imaging, and understanding morphology differences among different genetic mice phenotypes. Keywords: kaust |
|
Quantitative Tract-Based White Matter Development from Birth to Age Two Years X. Geng, S. Gouttard, A. Sharma, H. Gu, M. Styner, W. Lin, G. Gerig, J.H. Gilmore. In NeuroImage, pp. 1-44. March, 2012. DOI: 10.1016/j.neuroimage.2012.03.057 Few large-scale studies have been done to characterize the normal human brain white matter growth in the first years of life. We investigated white matter maturation patterns in major fiber pathways in a large cohort of healthy young children from birth to age two using diffusion parameters fractional anisotropy (FA), radial diffusivity (RD) and axial diffusivity (RD). Ten fiber pathways, including commissural, association and projection tracts, were examined with tract-based analysis, providing more detailed and continuous spatial developmental patterns compared to conventional ROI based methods. All DTI data sets were transformed to a population specific atlas with a group-wise longitudinal large deformation diffeomorphic registration approach. Diffusion measurements were analyzed along the major fiber tracts obtained in the atlas space. All fiber bundles show increasing FA values and decreasing radial and axial diffusivities during development in the first 2 years of life. The changing rates of the diffusion indices are faster in the first year than the second year for all tracts. RD and FA show larger percentage changes in the first and second years than AD. The gender effects on the diffusion measures are small. Along different spatial locations of fiber tracts, maturation does not always follow the same speed. Temporal and spatial diffusion changes near cortical regions are in general smaller than changes in central regions. Overall developmental patterns revealed in our study confirm the general rules of white matter maturation. This work shows a promising framework to study and analyze white matter maturation in a tract-based fashion. Compared to most previous studies that are ROI-based, our approach has the potential to discover localized development patterns associated with fiber tracts of interest. |
| 3D Tensor Normalization for Improved Accuracy in DTI Registration Methods A. Gupta, M. Escolar, C. Dietrich, J. Gilmore, G. Gerig, M. Styne. In Biomedical Image Registration Lecture Notes in Computer Science (LNCS), In Biomedical Image Registration Lecture Notes in Computer Science (LNCS), Vol. 7359, pp. 170--179. 2012. DOI: 10.1007/978-3-642-31340-0_18 This paper presents a method for normalization of diffusion tensor images (DTI) to a fixed DTI template, a pre-processing step to improve the performance of full tensor based registration methods. The proposed method maps the individual tensors of the subject image in to the template space based on matching the cumulative distribution function and the fractional anisotrophy values. The method aims to determine a more accurate deformation field from any full tensor registration method by applying the registration algorithm on the normalized DTI rather than the original DTI. The deformation field applied to the original tensor images are compared to the deformed image without normalization for 11 different cases of mapping seven subjects (neonate through 2 years) to two different atlases. The method shows an improvement in DTI registration based on comparing the normalized fractional anisotropy values of major fiber tracts in the brain. |
|
Prenatal isolated mild ventriculomegaly is associated with persistent ventricle enlargement at ages 1 and 2 A.E. Lyall, S. Woolson, H.M. Wolf, B.D. Goldman, J.S. Reznick, R.M. Hamer, W. Lin, M. Styner, G. Gerig, J.H. Gilmore. In Early Human Development, Elsevier, pp. (in press). 2012. Background: Enlargement of the lateral ventricles is thought to originate from abnormal prenatal brain development and is associated with neurodevelopmental disorders. Fetal isolated mild ventriculomegaly (MVM) is associated with the enlargement of lateral ventricle volumes in the neonatal period and developmental delays in early childhood. However, little is known about postnatal brain development in these children. Methods: Twenty-eight children with fetal isolated MVM and 56 matched controls were followed at ages 1 and 2 years with structural imaging on a 3T Siemens scanner and assessment of cognitive development with the Mullen Scales of Early Learning. Lateral ventricle, total gray and white matter volumes, and Mullen cognitive composite scores and subscale scores were compared between groups. Results: Compared to controls, children with prenatal isolated MVM had significantly larger lateral ventricle volumes at ages 1 and 2 years. Lateral ventricle volume at 1 and 2 years of age was significantly correlated with prenatal ventricle size. Enlargement of the lateral ventricles was associated with increased intracranial volumes and increased gray and white matter volumes. Children with MVM had Mullen composite scores similar to controls, although there was evidence of delay in fine motor and expressive language skills. Conclusions: Children with prenatal MVM have persistent enlargement of the lateral ventricles through the age of 2 years; this enlargement is associated with increased gray and white matter volumes and some evidence of delay in fine motor and expressive language development. Further study is needed to determine if enlarged lateral ventricles are associated with increased risk for neurodevelopmental disorders. |
| Brain Volume Findings in Six Month Old Infants at High Familial Risk for Autism H.C. Hazlett, H. Gu, R.C. McKinstry, D.W.W. Shaw, K.N. Botteron, S. Dager, M. Styner, C. Vachet, G. Gerig, S. Paterson, R.T. Schultz, A.M. Estes, A.C. Evans, J. Piven. In American Journal of Psychiatry (AJP), pp. (in print). 2012. Objective: Brain enlargement has been observed in individuals with autism as early as two years of age. Studies using head circumference suggest that brain enlargement is a postnatal event that occurs around the latter part of the first year. To date, no brain imaging studies have systematically examined the period prior to age two. In this study we examine MRI brain volume in six month olds at high familial risk for autism. Method: The Infant Brain Imaging Study (IBIS) is a longitudinal imaging study of infants at high risk for autism. This cross-sectional analysis examines brain volumes at six months of age, in high risk infants (N=98) in comparison to infants without family members with autism (low risk) (N=36). MRI scans are also examined for radiologic abnormalities. Results: No group differences were observed for intracranial cerebrum, cerebellum, lateral ventricle volumes, or head circumference. Conclusions: We did not observe significant group differences for head circumference, brain volume, or abnormalities of radiologic findings in a sample of 6 month old infants at highrisk for autism. We are unable to conclude that these changes are not present in infants who later go on to receive a diagnosis of autism, but rather that they were not detected in a large group at high familial risk. Future longitudinal studies of the IBIS sample will examine whether brain volume may differ in those infants who go onto develop autism, estimating that approximately 20\% of this sample may be diagnosed with an autism spectrum disorder at age two. |
|
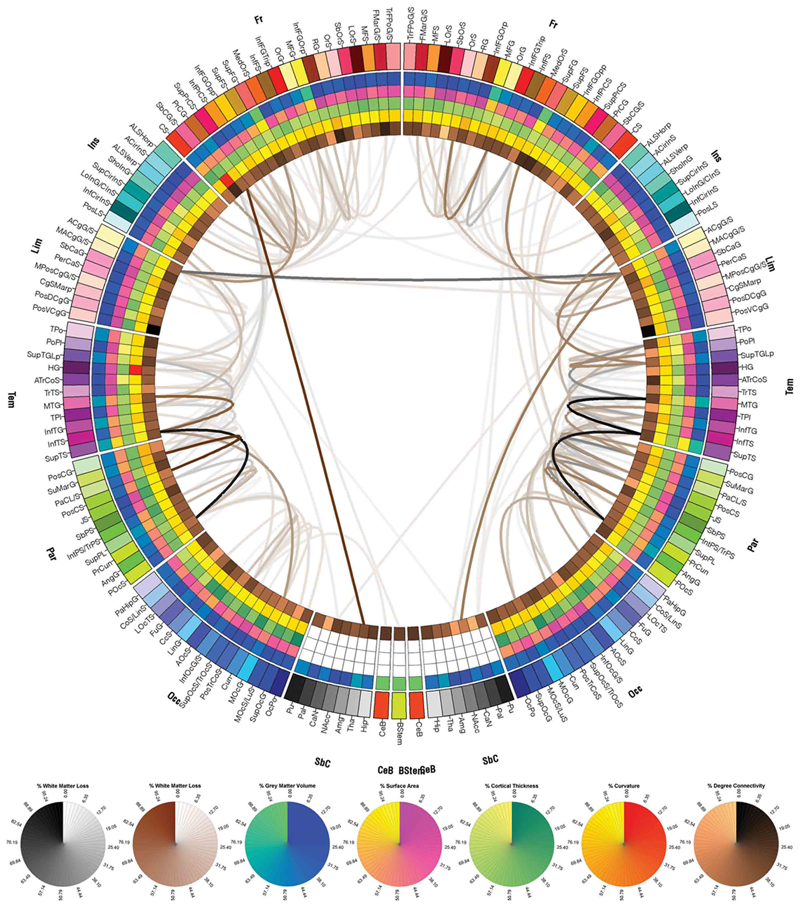
Patient-tailored connectomics visualization for the assessment of white matter atrophy in traumatic brain injury, A. Irimia, M.C. Chambers, C.M. Torgerson, M. Filippou, D.A. Hovda, J.R. Alger, G. Gerig, A.W. Toga, P.M. Vespa, R. Kikinis, J.D. Van Horn. In Frontiers in Neurotrauma, Note: http://www.frontiersin.org/neurotrauma/10.3389/fneur.2012.00010/abstract, 2012. DOI: 10.3389/fneur.2012.00010 Available approaches to the investigation of traumatic brain injury (TBI) are frequently hampered, to some extent, by the unsatisfactory abilities of existing methodologies to efficiently define and represent affected structural connectivity and functional mechanisms underlying TBI-related pathology. In this paper, we describe a patient-tailored framework which allows mapping and characterization of TBI-related structural damage to the brain via multimodal neuroimaging and personalized connectomics. Specifically, we introduce a graphically driven approach for the assessment of trauma-related atrophy of white matter connections between cortical structures, with relevance to the quantification of TBI chronic case evolution. This approach allows one to inform the formulation of graphical neurophysiological and neuropsychological TBI profiles based on the particular structural deficits of the affected patient. In addition, it allows one to relate the findings supplied by our workflow to the existing body of research that focuses on the functional roles of the cortical structures being targeted. Agraphical means for representing patient TBI status is relevant to the emerging field of personalized medicine and to the investigation of neural atrophy. |
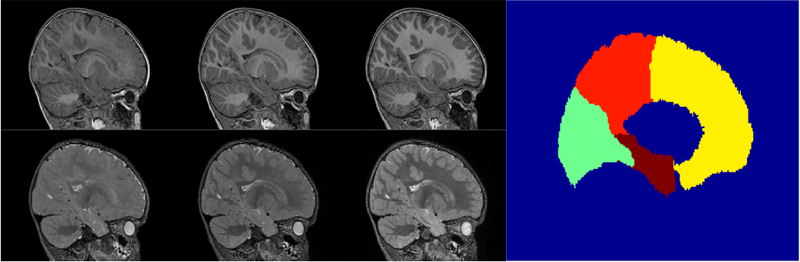
| Statistical Growth Modeling of Longitudinal DT-MRI for Regional Characterization of Early Brain Development N. Sadeghi, M.W. Prastawa, P.T. Fletcher, J.H. Gilmore, W. Lin, G. Gerig. In Proceedings of IEEE ISBI 2012, pp. 1507--1510. 2012. DOI: 10.1109/ISBI.2012.6235858 A population growth model that represents the growth trajectories of individual subjects is critical to study and understand neurodevelopment. This paper presents a framework for jointly estimating and modeling individual and population growth trajectories, and determining significant regional differences in growth pattern characteristics applied to longitudinal neuroimaging data. We use non-linear mixed effect modeling where temporal change is modeled by the Gompertz function. The Gompertz function uses intuitive parameters related to delay, rate of change, and expected asymptotic value; all descriptive measures which can answer clinical questions related to growth. Our proposed framework combines nonlinear modeling of individual trajectories, population analysis, and testing for regional differences. We apply this framework to the study of early maturation in white matter regions as measured with diffusion tensor imaging (DTI). Regional differences between anatomical regions of interest that are known to mature differently are analyzed and quantified. Experiments with image data from a large ongoing clinical study show that our framework provides descriptive, quantitative information on growth trajectories that can be directly interpreted by clinicians. To our knowledge, this is the first longitudinal analysis of growth functions to explain the trajectory of early brain maturation as it is represented in DTI. |
|
Segmentation of Serial MRI of TBI patients using Personalized Atlas Construction and Topological Change Estimation Bo Wang, M.W. Prastawa, S.P. Awate, A. Irimia, M.C. Chambers, P.M. Vespa, J.D. Van Horn, G. Gerig. In Proceedings of IEEE ISBI 2012, pp. 1152--1155. 2012. DOI: 10.1109/ISBI.2012.6235764 2D image space methods are processing methods applied after the volumetric data are projected and rendered into the 2D image space, such as 2D filtering, tone mapping and compositing. In the application domain of volume visualization, most 2D image space methods can be carried out more efficiently than their 3D counterparts. Most importantly, 2D image space methods can be used to enhance volume visualization quality when applied together with volume rendering methods. In this paper, we present and discuss the applications of a series of 2D image space methods as enhancements to confocal microscopy visualizations, including 2D tone mapping, 2D compositing, and 2D color mapping. These methods are easily integrated with our existing confocal visualization tool, FluoRender, and the outcome is a full-featured visualization system that meets neurobiologists' demands for qualitative analysis of confocal microscopy data. |
|
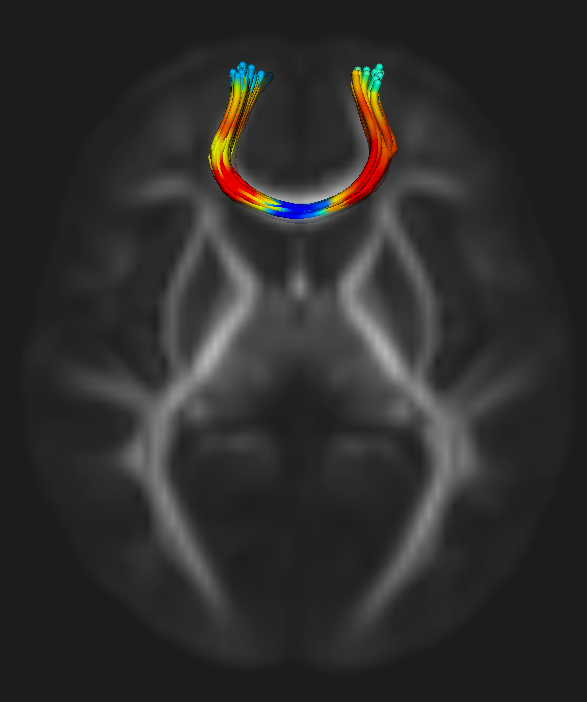
Longitudinal Growth Modeling of Discrete-Time Functions with Application to DTI Tract Evolution in Early Neurodevelopment A. Sharma, S. Durrleman, J.H. Gilmore, G. Gerig. In Proceedings of IEEE ISBI 2012, pp. 1397--1400. 2012. DOI: 10.1109/ISBI.2012.6235829 We present a new framework for spatiotemporal analysis of parameterized functions attributed by properties of 4D longitudinal image data. Our driving application is the measurement of temporal change in white matter diffusivity of fiber tracts. A smooth temporal modeling of change from a discrete-time set of functions is obtained with an extension of the logistic growth model to time-dependent spline functions, capturing growth with only a few descriptive parameters. An unbiased template baseline function is also jointly estimated. Solution is demonstrated via energy minimization with an extension to simultaneous modeling of trajectories for multiple subjects. The new framework is validated with synthetic data and applied to longitudinal DTI from 15 infants. Interpretation of estimated model growth parameters is facilitated by visualization in the original coordinate space of fiber tracts. |
|
Quantifying regional growth patterns through longitudinal analysis of distances between multimodal MR intensity distributions A. Vardhan, M.W. Prastawa, S. Gouttard, J. Piven, G. Gerig. In Proceedings of IEEE ISBI 2012, pp. 1156--1159. 2012. DOI: 10.1109/ISBI.2012.6235765 Quantitative analysis of early brain development through imaging is critical for identifying pathological development, which may in turn affect treatment procedures. We propose a framework for analyzing spatiotemporal patterns of brain maturation by quantifying intensity changes in longitudinal MR images. We use a measure of divergence between a pair of intensity distributions to study the changes that occur within specific regions, as well as between a pair of anatomical regions, over time. The change within a specific region is measured as the contrast between white matter and gray matter tissue belonging to that region. The change between a pair of regions is measured as the divergence between regional image appearances, summed over all tissue classes. We use kernel regression to integrate the temporal information across different subjects in a consistent manner. We applied our method on multimodal MRI data with T1-weighted (T1W) and T2-weighted (T2W) scans of each subject at the approximate ages of 6 months, 12 months, and 24 months. The results demonstrate that brain maturation begins at posterior regions and that frontal regions develop later, which matches previously published histological, qualitative and morphometric studies. Our multimodal analysis also confirms that T1W and T2W modalities capture different properties of the maturation process, a phenomena referred to as T2 time lag compared to T1. The proposed method has potential for analyzing regional growth patterns across different populations and for isolating specific critical maturation phases in different MR modalities. |
|
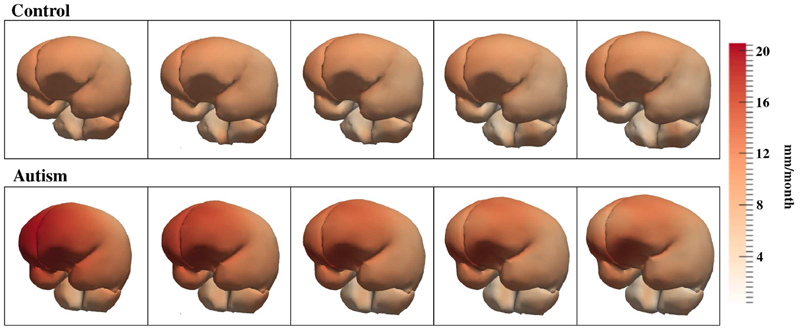
A framework for longitudinal data analysis via shape regression J. Fishbaugh, S. Durrleman, J. Piven, G. Gerig. In Medical Imaging 2012: Image Processing, Edited by David R. Haynor and Sebastien Ourselin, SPIE Intl Soc Optical Eng, Feb, 2012. DOI: 10.1117/12.911721 Traditional longitudinal analysis begins by extracting desired clinical measurements, such as volume or head circumference, from discrete imaging data. Typically, the continuous evolution of a scalar measurement is estimated by choosing a 1D regression model, such as kernel regression or fitting a polynomial of fixed degree. This type of analysis not only leads to separate models for each measurement, but there is no clear anatomical or biological interpretation to aid in the selection of the appropriate paradigm. In this paper, we propose a consistent framework for the analysis of longitudinal data by estimating the continuous evolution of shape over time as twice differentiable flows of deformations. In contrast to 1D regression models, one model is chosen to realistically capture the growth of anatomical structures. From the continuous evolution of shape, we can simply extract any clinical measurements of interest. We demonstrate on real anatomical surfaces that volume extracted from a continuous shape evolution is consistent with a 1D regression performed on the discrete measurements. We further show how the visualization of shape progression can aid in the search for significant measurements. Finally, we present an example on a shape complex of the brain (left hemisphere, right hemisphere, cerebellum) that demonstrates a potential clinical application for our framework. |

|
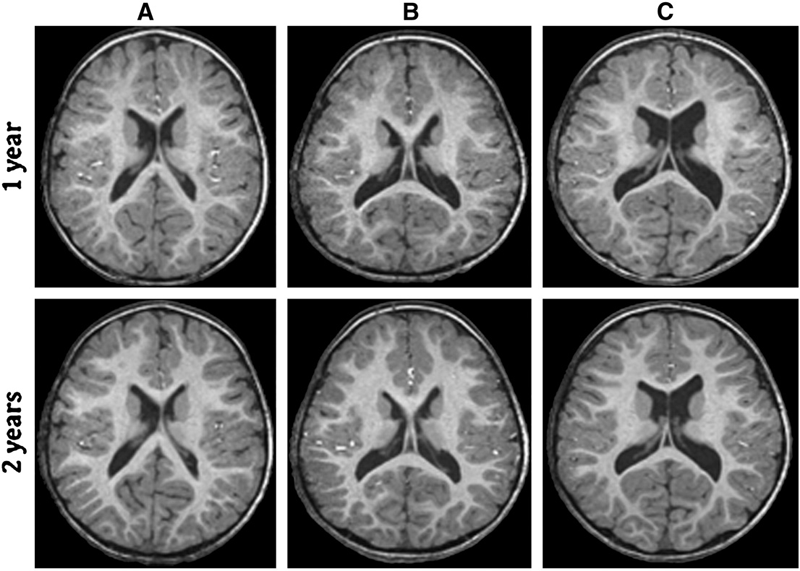
A Patient-Specific Segmentation Framework for Longitudinal MR Images of Traumatic Brain Injury Bo Wang, M.W. Prastawa, A. Irimia, M.C. Chambers, P.M. Vespa, J.D. Van Horn, G. Gerig. In Proceedings of Medical Imaging 2012: Image Processing, SPIE, pp. 831402-831402-7. 2012. DOI: 10.1117/12.911043 Traumatic brain injury (TBI) is a major cause of death and disability worldwide. Robust, reproducible segmentations of MR images with TBI are crucial for quantitative analysis of recovery and treatment efficacy. However, this is a significant challenge due to severe anatomy changes caused by edema (swelling), bleeding, tissue deformation, skull fracture, and other effects related to head injury. In this paper, we introduce a multi-modal image segmentation framework for longitudinal TBI images. The framework is initialized through manual input of primary lesion sites at each time point, which are then refined by a joint approach composed of Bayesian segmentation and construction of a personalized atlas. The personalized atlas construction estimates the average of the posteriors of the Bayesian segmentation at each time point and warps the average back to each time point to provide the updated priors for Bayesian segmentation. The difference between our approach and segmenting longitudinal images independently is that we use the information from all time points to improve the segmentations. Given a manual initialization, our framework automatically segments healthy structures (white matter, grey matter, cerebrospinal fluid) as well as different lesions such as hemorrhagic lesions and edema. Our framework can handle different sets of modalities at each time point, which provides flexibility in analyzing clinical scans. We show results on three subjects with acute baseline scans and chronic follow-up scans. The results demonstrate that joint analysis of all the points yields improved segmentation compared to independent analysis of the two time points. |
|
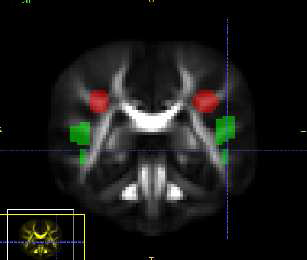
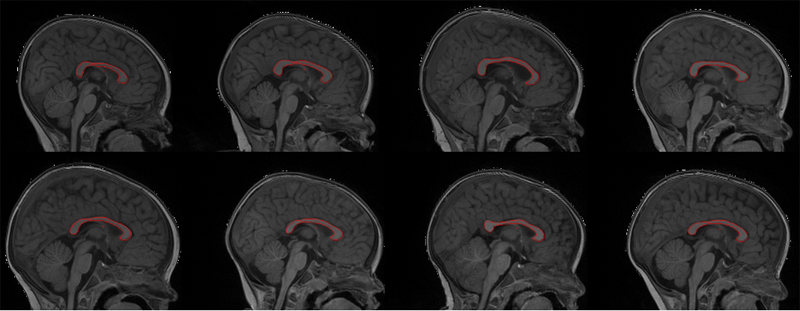
Automatic corpus callosum segmentation using a deformable active Fourier contour model C. Vachet, B. Yvernault, K. Bhatt, R.G. Smith, G. Gerig, H.C. Hazlett, M.A. Styner. In Proceedings of Medical Imaging 2012: Biomedical Applications in Molecular, Structural, and Functional Imaging, SPIE, Vol. 8317, 831707, 2012. DOI: 10.1117/12.911504 The corpus callosum (CC) is a structure of interest in many neuroimaging studies of neuro-developmental pathology such as autism. It plays an integral role in relaying sensory, motor and cognitive information from homologous regions in both hemispheres. We have developed a framework that allows automatic segmentation of the corpus callosum and its lobar subdivisions. Our approach employs constrained elastic deformation of exible Fourier contour model, and is an extension of Szekely's 2D Fourier descriptor based Active Shape Model. The shape and appearance model, derived from a large mixed population of 150+ subjects, is described with complex Fourier descriptors in a principal component shape space. Using MNI space aligned T1w MRI data, the CC segmentation is initialized on the mid-sagittal plane using the tissue segmentation. A multi-step optimization strategy, with two constrained steps and a final unconstrained step, is then applied. If needed, interactive segmentation can be performed via contour repulsion points. Lobar connectivity based parcellation of the corpus callosum can finally be computed via the use of a probabilistic CC subdivision model. Our analysis framework has been integrated in an open-source, end-to-end application called CCSeg both with a command line and Qt-based graphical user interface (available on NITRC). A study has been performed to quantify the reliability of the semi-automatic segmentation on a small pediatric dataset. Using 5 subjects randomly segmented 3 times by two experts, the intra-class correlation coeficient showed a superb reliability (0.99). CCSeg is currently applied to a large longitudinal pediatric study of brain development in autism. |
| Differences in White Matter Fiber Tract Development Present from 6 to 24 Months in Infants with Autism, J.J. Wolff, H. Gu, G. Gerig, J.T. Elison, M. Styner, S. Gouttard, K.N. Botteron, S.R. Dager, G. Dawson, A.M. Estes, A. Evans, H.C. Hazlett, P. Kostopoulos, R.C. McKinstry, S.J. Paterson, R.T. Schultz, L. Zwaigenbaum, J. Piven. In American Journal of Psychiatry (AJP), Note: Selected as an AJP Best of 2012 paper., pp. 1--12. 2012. DOI: 10.1176/appi.ajp.2011.11091447 Objective: Evidence from prospective studies of high-risk infants suggests that early symptoms of autism usually emerge late in the first or early in the second year of life after a period of relatively typical development. The authors prospectively examined white matter fiber tract organization from 6 to 24 months in high-risk infants who developed autism spectrum disorders (ASDs) by 24 months. Method: The participants were 92 highrisk infant siblings from an ongoing imaging study of autism. All participants had diffusion tensor imaging at 6 months and behavioral assessments at 24 months; a majority contributed additional imaging data at 12 and/or 24 months. At 24 months, 28 infants met criteria for ASDs and 64 infants did not. Microstructural properties of white matter fiber tracts reported to be associated with ASDs or related behaviors were characterized by fractional anisotropy and radial and axial diffusivity. Results: The fractional anisotropy trajectories for 12 of 15 fiber tracts differed significantly between the infants who developed ASDs and those who did not. Development for most fiber tracts in the infants with ASDs was characterized by higher fractional anisotropy values at 6 months followed by slower change over time relative to infants without ASDs. Thus, by 24 months of age, those with ASDs had lower values. Conclusions: These results suggest that aberrant development of white matter pathways may precede the manifestation of autistic symptoms in the first year of life. Longitudinal data are critical to characterizing the dynamic age-related brain and behavior changes underlying this neurodevelopmental disorder. |
|
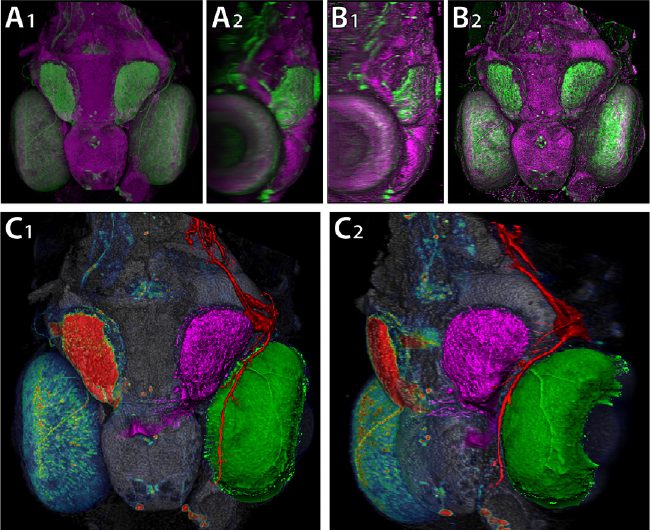
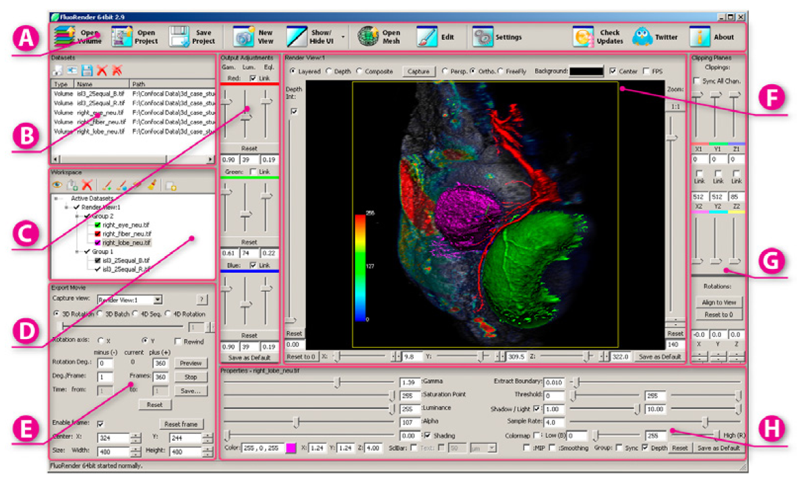
FluoRender: An Application of 2D Image Space Methods for 3D and 4D Confocal Microscopy Data Visualization in Neurobiology Research Y. Wan, H. Otsuna, C.-B. Chien, C.D. Hansen. In Proceedings of Pacific Vis 2012, Incheon, Korea, pp. 201--208. 2012. DOI: 10.1109/PacificVis.2012.6183592 2D image space methods are processing methods applied after the volumetric data are projected and rendered into the 2D image space, such as 2D filtering, tone mapping and compositing. In the application domain of volume visualization, most 2D image space methods can be carried out more efficiently than their 3D counterparts. Most importantly, 2D image space methods can be used to enhance volume visualization quality when applied together with volume rendering methods. In this paper, we present and discuss the applications of a series of 2D image space methods as enhancements to confocal microscopy visualizations, including 2D tone mapping, 2D compositing, and 2D color mapping. These methods are easily integrated with our existing confocal visualization tool, FluoRender, and the outcome is a full-featured visualization system that meets neurobiologists' demands for qualitative analysis of confocal microscopy data. Keywords: scidac |