


Image Analysis
SCI's imaging work addresses fundamental questions in 2D and 3D image processing, including filtering, segmentation, surface reconstruction, and shape analysis. In low-level image processing, this effort has produce new nonparametric methods for modeling image statistics, which have resulted in better algorithms for denoising and reconstruction. Work with particle systems has led to new methods for visualizing and analyzing 3D surfaces. Our work in image processing also includes applications of advanced computing to 3D images, which has resulted in new parallel algorithms and real-time implementations on graphics processing units (GPUs). Application areas include medical image analysis, biological image processing, defense, environmental monitoring, and oil and gas.
Ross Whitaker
Segmentation


Chris Johnson
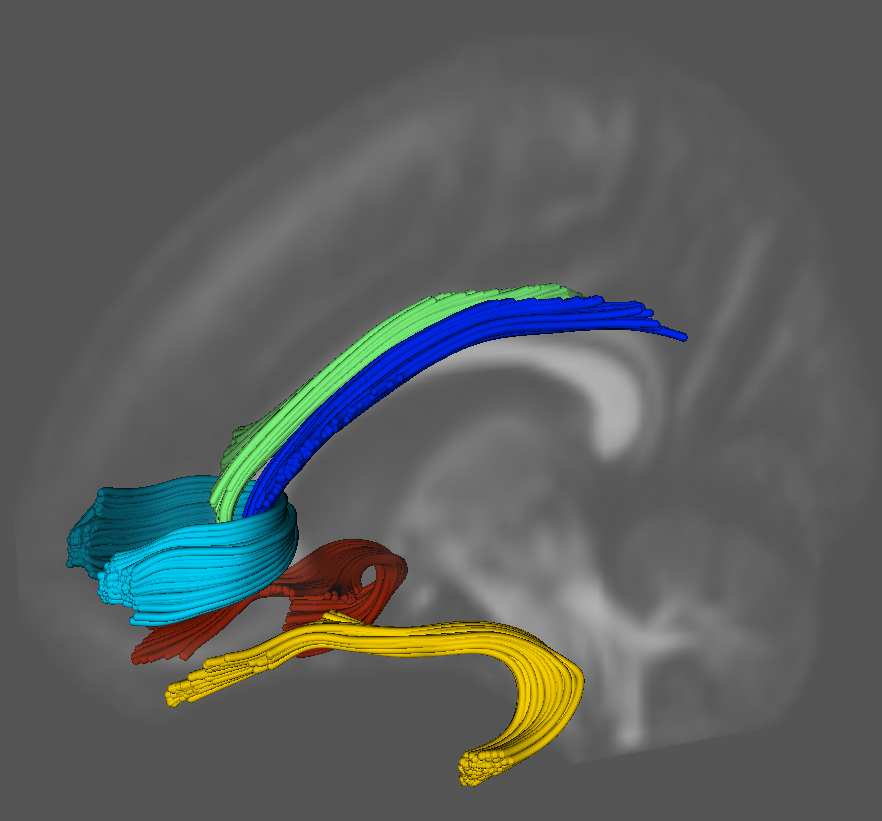
Diffusion Tensor Analysis
Funded Research Projects:
Publications in Image Analysis:
|
  Measures for Validation of DTI Tractography S. Gouttard, C.B. Goodlett, M. Kubicki, G. Gerig. In Medical Imaging 2012: Image Processing, Edited by David R. Haynor and Sebastien Ourselin, SPIE Intl Soc Optical Eng, Feb, 2012. DOI: 10.1117/12.911546 The evaluation of analysis methods for diffusion tensor imaging (DTI) remains challenging due to the lack of gold standards and validation frameworks. Significant work remains in developing metrics for comparing fiber bundles generated from streamline tractography. We propose a set of volumetric and tract oriented measures for evaluating tract differences. The different methods developed for this assessment work are: an overlap measurement, a point cloud distance and a quantification of the diffusion properties at similar locations between fiber bundles. The application of the measures in this paper is a comparison of atlas generated tractography to tractography generated in individual images. For the validation we used a database of 37 subject DTIs, and applied the measurements on five specific fiber bundles: uncinate, cingulum (left and right for both bundles) and genu. Each measurments is interesting for specific use: the overlap measure presents a simple and comprehensive metric but is sensitive to partial voluming and does not give consistent values depending on the bundle geometry. The point cloud distance associated with a quantile interpretation of the distribution gives a good intuition of how close and similar the bundles are. Finally, the functional difference is useful for a comparison of the diffusion properties since it is the focus of many DTI analysis to compare scalar invariants. The comparison demonstrated reasonable similarity of results. The tract difference measures are also applicable to comparison of tractography algorithms, quality control, reproducibility studies, and other validation problems. |

|
Building Spatiotemporal Anatomical Models using Joint 4-D Segmentation, Registration, and Subject-Speci fic Atlas Estimation M.W. Prastawa, S.P. Awate, G. Gerig. In Proceedings of the 2012 IEEE Mathematical Methods in Biomedical Image Analysis (MMBIA) Conference, pp. 49--56. 2012. DOI: 10.1109/MMBIA.2012.6164740 PubMed ID: 23568185 PubMed Central ID: PMC3615562 Longitudinal analysis of anatomical changes is a vital component in many personalized-medicine applications for predicting disease onset, determining growth/atrophy patterns, evaluating disease progression, and monitoring recovery. Estimating anatomical changes in longitudinal studies, especially through magnetic resonance (MR) images, is challenging because of temporal variability in shape (e.g. from growth/atrophy) and appearance (e.g. due to imaging parameters and tissue properties affecting intensity contrast, or from scanner calibration). This paper proposes a novel mathematical framework for constructing subject-specific longitudinal anatomical models. The proposed method solves a generalized problem of joint segmentation, registration, and subject-specific atlas building, which involves not just two images, but an entire longitudinal image sequence. The proposed framework describes a novel approach that integrates fundamental principles that underpin methods for image segmentation, image registration, and atlas construction. This paper presents evaluation on simulated longitudinal data and on clinical longitudinal brain MRI data. The results demonstrate that the proposed framework effectively integrates information from 4-D spatiotemporal data to generate spatiotemporal models that allow analysis of anatomical changes over time. Keywords: namic, adni, autism |
| Data Analysis with the Morse-Smale Complex: The msr Package for R S. Gerber, K. Potter. In Journal of Statistical Software, Vol. 50, No. 2, 2012. In many areas, scientists deal with increasingly high-dimensional data sets. An important aspect for these scientists is to gain a qualitative understanding of the process or system from which the data is gathered. Often, both input variables and an outcome are observed and the data can be characterized as a sample from a high-dimensional scalar function. This work presents the R package msr for exploratory data analysis of multivariate scalar functions based on the Morse-Smale complex. The Morse-Smale complex provides a topologically meaningful decomposition of the domain. The msr package implements a discrete approximation of the Morse-Smale complex for data sets. In previous work this approximation has been exploited for visualization and partition-based regression, which are both supported in the msr package. The visualization combines the Morse-Smale complex with dimension-reduction techniques for a visual summary representation that serves as a guide for interactive exploration of the high-dimensional function. In a similar fashion, the regression employs a combination of linear models based on the Morse-Smale decomposition of the domain. This regression approach yields topologically accurate estimates and facilitates interpretation of general trends and statistical comparisons between partitions. In this manner, the msr package supports high-dimensional data understanding and exploration through the Morse-Smale complex. |
|
Centerline extraction with principal curve tracing to improve 3D level set esophagus segmentation in CT images S. Kurugol, E. Bas, D. Erdogmus, J.G. Dy, G.C. Sharp, D.H. Brooks. In Proceedings of IEEE International Conference of the Engineering in Medicine and Biology Society (EMBS), pp. 3403--3406. 2011. DOI: 10.1109/IEMBS.2011.6090921 PubMed ID: 2225507 PubMed Central ID: PMC3349355 For radiotherapy planning, contouring of target volume and healthy structures at risk in CT volumes is essential. To automate this process, one of the available segmentation techniques can be used for many thoracic organs except the esophagus, which is very hard to segment due to low contrast. In this work we propose to initialize our previously introduced model based 3D level set esophagus segmentation method with a principal curve tracing (PCT) algorithm, which we adapted to solve the esophagus centerline detection problem. To address challenges due to low intensity contrast, we enhanced the PCT algorithm by learning spatial and intensity priors from a small set of annotated CT volumes. To locate the esophageal wall, the model based 3D level set algorithm including a shape model that represents the variance of esophagus wall around the estimated centerline is utilized. Our results show improvement in esophagus segmentation when initialized by PCT compared to our previous work, where an ad hoc centerline initialization was performed. Unlike previous approaches, this work does not need a very large set of annotated training images and has similar performance. |
| Brain Maturation of Newborns and Infants G. Gerig, J.H. Gilmore, W. Lin. Encyclopedia on Early Childhood Development (online): Brain Development in Children - According to Experts, Montreal, Quebec, Centre of Excellence for Early Childhood Development and Strategic Knowledge Cluster on Early Child Development, pp. 1--6. 2011. Recently, imaging studies of early human development have received more attention, as improved modeling methods might lead to a clearer understanding of the origin, timing, and nature of differences in neurodevelopmental disorders. Non-invasive magnetic resonance imaging (MRI) can provide three-dimensional images of the infant brain in less than 20 minutes, with unprecedented anatomical details and contrast of brain anatomy, cortical and subcortical structures and brain connectivity. Repeating MRI at different stages of development, e.g., in yearly intervals starting after birth, gives scientists the opportunity to study the trajectory of brain growth and compare individual growth trajectories to normative models. These comparisons become highly relevant in personalized medicine, where early diagnosis is a critical juncture for timing and therapy types. |
|
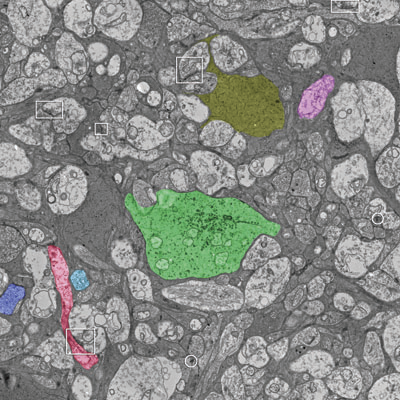
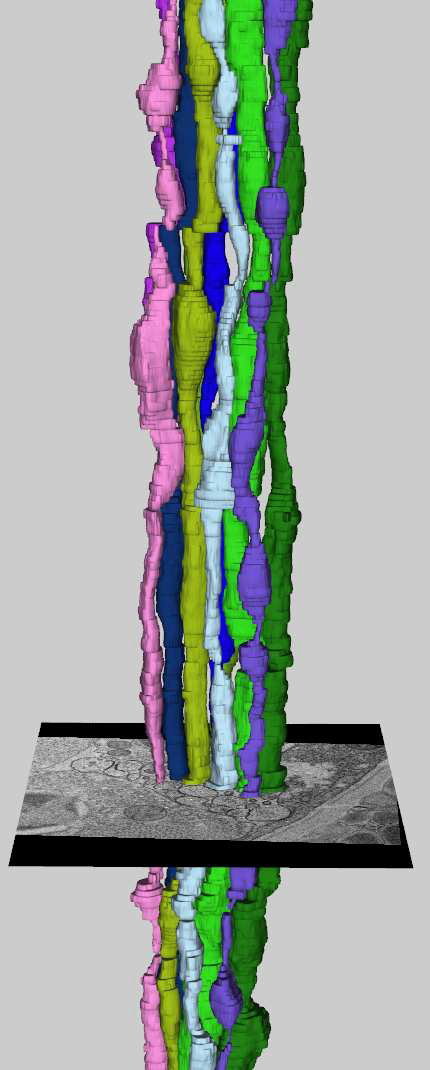
The Viking viewer for connectomics: scalable multi-user annotation and summarization of large volume data sets J.R. Anderson, S. Mohammed, B.C. Grimm, B.W. Jones, P. Koshevoy, T. Tasdizen, R.T. Whitaker, R.E. Marc. In Journal of Microscopy, Vol. 241, No. 1, pp. 13--28. 2011. DOI: 10.1111/j.1365-2818.2010.03402.x Modern microscope automation permits the collection of vast amounts of continuous anatomical imagery in both two and three dimensions. These large data sets present significant challenges for data storage, access, viewing, annotation and analysis. The cost and overhead of collecting and storing the data can be extremely high. Large data sets quickly exceed an individual's capability for timely analysis and present challenges in efficiently applying transforms, if needed. Finally annotated anatomical data sets can represent a significant investment of resources and should be easily accessible to the scientific community. The Viking application was our solution created to view and annotate a 16.5 TB ultrastructural retinal connectome volume and we demonstrate its utility in reconstructing neural networks for a distinctive retinal amacrine cell class. Viking has several key features. (1) It works over the internet using HTTP and supports many concurrent users limited only by hardware. (2) It supports a multi-user, collaborative annotation strategy. (3) It cleanly demarcates viewing and analysis from data collection and hosting. (4) It is capable of applying transformations in real-time. (5) It has an easily extensible user interface, allowing addition of specialized modules without rewriting the viewer. Keywords: Annotation, automated electron microscopy, citizen science, computational methods, connectome, networks, visualization |
|
Semi-automated Neuron Boundary Detection and Slice Traversal Algorithm for Segmentation of Neurons from Electron Microscopy Images E. Jurrus, S. Watanabe, R. Guily, A.R.C. Paiva, M.H. Ellisman, E.M. Jorgensen, T. Tasdizen. In Microscopic Image Analysis with Applications in Biology (MIAAB) Workshop, 2011. Neuroscientists are developing new imaging techniques and generating large volumes of data in an effort to understand the complex structure of the nervous system. To aid in the analysis, new segmentation techniques for identifying neurons in these feature rich datasets are required. However, the extremely anisotropic resolution of the data makes segmentation and tracking across slices difficult. This paper presents a complete method for segmenting neurons in electron microscopy images and visualizing them in three dimensions. First, we present an advanced method for identifying neuron membranes, necessary for whole neuron segmentation, using a machine learning approach. Next, neurons are segmented in each two-dimensional section and connected using correlation of regions between sections. These techniques, combined with a visual user interface, enable users to quickly segment whole neurons in large volumes. |
| Microfluidic laminate-based phantom for diffusion tensor-magnetic resonance imaging R. Samuel, H.J. Sant, F. Jiao, C.R. Johnson, B.K. Gale. In Journal of Micromech. Microeng., Vol. 21, pp. 095027--095038. 2011. DOI: 10.1088/0960-1317/21/9/095027 |
|
Geometric Correspondence for Ensembles of Nonregular Shapes M. Datar, Y. Gur, B. Paniagua, M. Styner, R.T. Whitaker. In Proceedings of Medical Image Computing and Computer-Assisted Intervention (MICCAI 2011), Lecture Notes in Computer Science (LNCS), Vol. 6892, pp. 368--375. 2011. DOI: 10.1007/978-3-642-23629-7_45 PubMed ID: 21995050 PubMed Central ID: PMC3346950 An ensemble of biological shapes can be represented and analyzed with a dense set of point correspondences. In previous work, optimal point placement was determined by optimizing an information theoretic criterion that depends on relative spatial locations on different shapes combined with pairwise Euclidean distances between nearby points on the same shape. These choices have prevented such methods from effectively characterizing shapes with complex geometry such as thin or highly curved features. This paper extends previous methods for automatic shape correspondence by taking into account the underlying geometry of individual shapes. This is done by replacing the Euclidean distance for intrashape pairwise particle interactions by the geodesic distance. A novel set of numerical techniques for fast distance computations on curved surfaces is used to extract these distances. In addition, we introduce an intershape penalty term that incorporates surface normal information to achieve better particle correspondences near sharp features. Finally, we demonstrate this new method on synthetic and biological datasets. Keywords: namic |
|
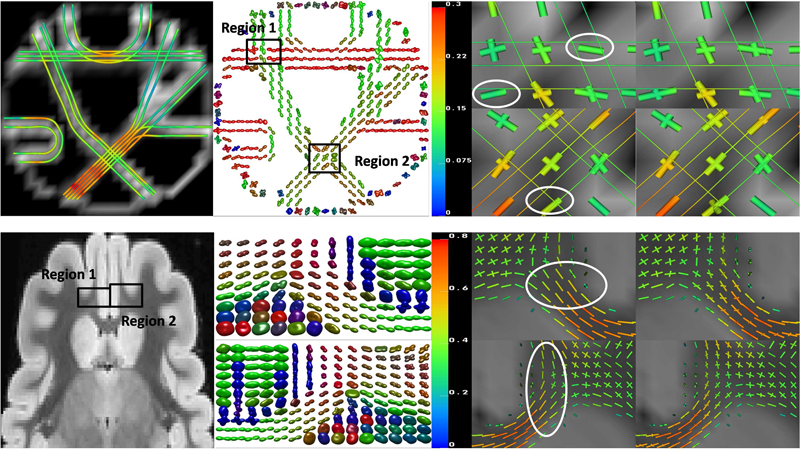
Detection of crossing white matter fibers with high-order tensors and rank-k decompositions F. Jiao, Y. Gur, C.R. Johnson, S. Joshi. In Proceedings of the International Conference on Information Processing in Medical Imaging (IPMI 2011), Lecture Notes in Computer Science (LNCS), Vol. 6801, pp. 538--549. 2011. DOI: 10.1007/978-3-642-22092-0_44 PubMed Central ID: PMC3327305 Fundamental to high angular resolution diffusion imaging (HARDI), is the estimation of a positive-semidefinite orientation distribution function (ODF) and extracting the diffusion properties (e.g., fiber directions). In this work we show that these two goals can be achieved efficiently by using homogeneous polynomials to represent the ODF in the spherical deconvolution approach, as was proposed in the Cartesian Tensor-ODF (CT-ODF) formulation. Based on this formulation we first suggest an estimation method for positive-semidefinite ODF by solving a linear programming problem that does not require special parametrization of the ODF. We also propose a rank-k tensor decomposition, known as CP decomposition, to extract the fibers information from the estimated ODF. We show that this decomposition is superior to the fiber direction estimation via ODF maxima detection as it enables one to reach the full fiber separation resolution of the estimation technique. We assess the accuracy of this new framework by applying it to synthetic and experimentally obtained HARDI data. |
| Monte Carlo expectation maximization with hidden Markov models to detect functional networks in resting-state fMRI W. Liu, S. Awate, J. Anderson, D. Yurgelun-Todd, P.T. Fletcher. In Machine Learning in Medical Imaging, Lecture Notes in Computer Science (LNCS), Vol. 7009/2011, pp. 59--66. 2011. DOI: 10.1007/978-3-642-24319-6_8 |
|
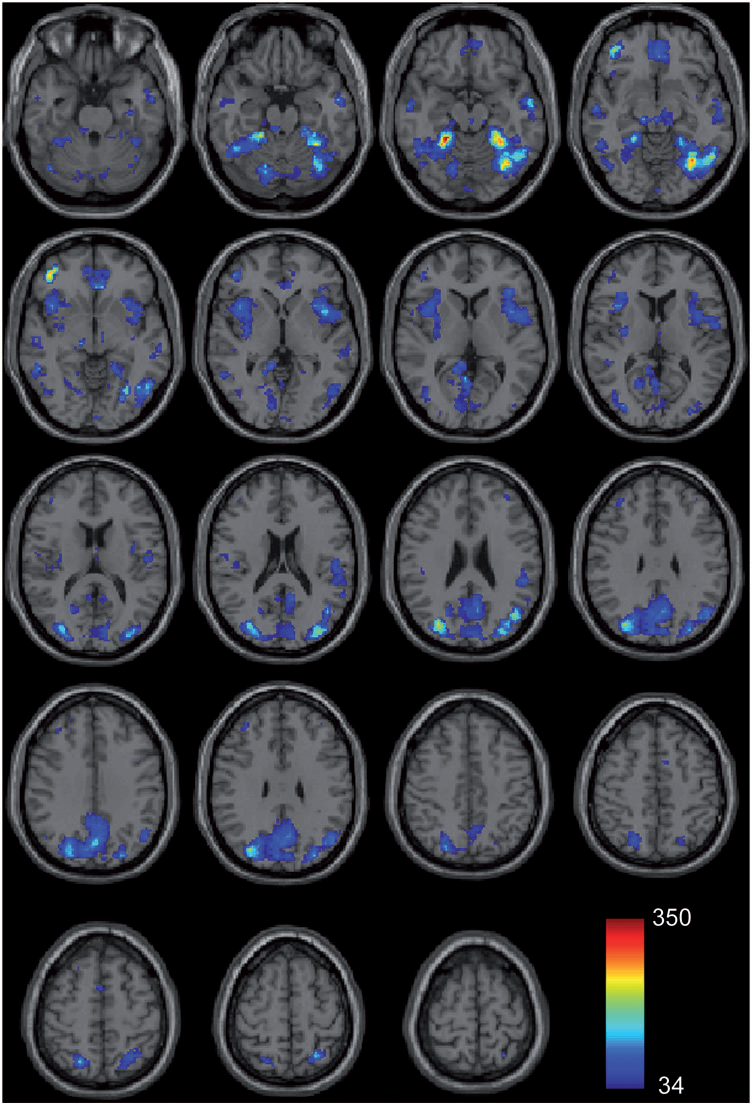
Functional connectivity magnetic resonance imaging classification of autism J.S. Anderson, J.A. Nielsen, A.L. Froehlich, M.B. DuBray, T.J. Druzgal, A.N. Cariello, J.R. Cooperrider, B.A. Zielinski, C. Ravichandran, P.T. Fletcher, A.L. Alexander, E.D. Bigler, N. Lange, J.E. Lainhart. In Brain, pp. (published online). 2011. DOI: 10.1093/brain/awr263 PubMed ID: 22006979 Group differences in resting state functional magnetic resonance imaging connectivity between individuals with autism and typically developing controls have been widely replicated for a small number of discrete brain regions, yet the whole-brain distribution of connectivity abnormalities in autism is not well characterized. It is also unclear whether functional connectivity is sufficiently robust to be used as a diagnostic or prognostic metric in individual patients with autism. We obtained pairwise functional connectivity measurements from a lattice of 7266 regions of interest covering the entire grey matter (26.4 million connections) in a well-characterized set of 40 male adolescents and young adults with autism and 40 age-, sex- and IQ-matched typically developing subjects. A single resting state blood oxygen level-dependent scan of 8 min was used for the classification in each subject. A leave-one-out classifier successfully distinguished autism from control subjects with 83% sensitivity and 75\% specificity for a total accuracy of 79\% (P = 1.1 x 10⁻⁷). In subjects less than 20 years of age, the classifier performed at 89\% accuracy (P = 5.4 x 10⁻⁷). In a replication dataset consisting of 21 individuals from six families with both affected and unaffected siblings, the classifier performed at 71\% accuracy (91\% accuracy for subjects less than 20 years of age). Classification scores in subjects with autism were significantly correlated with the Social Responsiveness Scale (P = 0.05), verbal IQ (P = 0.02) and the Autism Diagnostic Observation Schedule-Generic's combined social and communication subscores (P = 0.05). An analysis of informative connections demonstrated that region of interest pairs with strongest correlation values were most abnormal in autism. Negatively correlated region of interest pairs showed higher correlation in autism (less anticorrelation), possibly representing weaker inhibitory connections, particularly for long connections (Euclidean distance greater than 10 cm). Brain regions showing greatest differences included regions of the default mode network, superior parietal lobule, fusiform gyrus and anterior insula. Overall, classification accuracy was better for younger subjects, with differences between autism and control subjects diminishing after 19 years of age. Classification scores of unaffected siblings of individuals with autism were more similar to those of the control subjects than to those of the subjects with autism. These findings indicate feasibility of a functional connectivity magnetic resonance imaging diagnostic assay for autism. |
| Geodesic Regression on Riemannian Manifolds P.T. Fletcher. In Proceedings of the Third MICCIA International Workshop on Mathematical Foundations of Computational Anatomy (MFCA), Toronto, Canada, pp. 75--86. 2011. |
| Horoball hulls and extents in positive definite space P.T. Fletcher, J. Moeller, J. Phillips, S. Venkatasubramanian. In Algorithms and Data Structures, Lecture Notes in Computer Science (LNCS), Vol. 6844/2011, pp. 386--398. 2011. DOI: 10.1007/978-3-642-22300-6_33 |
| WE-E-BRC-06: Comparison of Two Methods of Contouring Internal Target Volume on Multiple 4DCT Data Sets from the Same Subjects: Maximum Intensity Projection and Combination of 10 Phases B. Salter, B. Wang, M. Sadinski, S. Ruhnau, V. Sarkar, J. Hinkle, Y. Hitchcock, K. Kokeny, S. Joshi. In Medical Physics, Vol. 38, No. 6, pp. 3820. 2011. |
| WE-E-BRC-05: Voxel Based Four Dimensional Tissue Deformation Reconstruction (4DTDR) Validation Using a Real Tissue Phantom M. Szegedi, J. Hinkle, S. Joshi, V. Sarkar, P. Rassiah-Szegedi, B. Wang, B. Salter. In Medical Physics, Vol. 38, pp. 3819. 2011. |
| Statistical Growth Modeling of Longitudinal DT-MRI for Regional Characterization of Early Brain Development N. Sadeghi, M.W. Prastawa, P.T. Fletcher, J.H. Gilmore, W. Lin, G. Gerig. In Proceedings of the Medical Image Computing and Computer Assisted Intervention (MICCAI) 2011 Workshop on Image Analysis of Human Brain Development, pp. 1507--1510. 2011. DOI: 10.1109/ISBI.2012.6235858 A population growth model that represents the growth trajectories of individual subjects is critical to study and understand neurodevelopment. This paper presents a framework for jointly estimating and modeling individual and population growth trajectories, and determining significant regional differences in growth pattern characteristics applied to longitudinal neuroimaging data. We use non-linear mixed effect modeling where temporal change is modeled by the Gompertz function. The Gompertz function uses intuitive parameters related to delay, rate of change, and expected asymptotic value; all descriptive measures which can answer clinical questions related to growth. Our proposed framework combines nonlinear modeling of individual trajectories, population analysis, and testing for regional differences. We apply this framework to the study of early maturation in white matter regions as measured with diffusion tensor imaging (DTI). Regional differences between anatomical regions of interest that are known to mature differently are analyzed and quantified. Experiments with image data from a large ongoing clinical study show that our framework provides descriptive, quantitative information on growth trajectories that can be directly interpreted by clinicians. To our knowledge, this is the first longitudinal analysis of growth functions to explain the trajectory of early brain maturation as it is represented in DTI. Keywords: namic |
| Sample drift correction in 3D fluorescence photoactivation localization microscopy M.J. Mlodzianoski, J.M. Schreiner, S.P. Callahan, K. Smolková, A. Dlasková, J. Šantorová, P. Ježek, J. Bewersdorf. In Optics Express, Vol. 19, No. 16, pp. 15009--15019. 2011. DOI: 10.1364/OE.19.015009 |
| Comparison of acute and chronic traumatic brain injury using semi-automatic multimodal segmentation of MR volumes A. Irimia, M.C. Chambers, J.R. Alger, M. Filippou, M.W. Prastawa, Bo Wang, D. Hovda, G. Gerig, A.W. Toga, R. Kikinis, P.M. Vespa, J.D. Van Horn. In Journal of Neurotrauma, Vol. 28, No. 11, pp. 2287--2306. November, 2011. DOI: 10.1089/neu.2011.1920 PubMed ID: 21787171 Although neuroimaging is essential for prompt and proper management of traumatic brain injury (TBI), there is a regrettable and acute lack of robust methods for the visualization and assessment of TBI pathophysiology, especially for of the purpose of improving clinical outcome metrics. Until now, the application of automatic segmentation algorithms to TBI in a clinical setting has remained an elusive goal because existing methods have, for the most part, been insufficiently robust to faithfully capture TBI-related changes in brain anatomy. This article introduces and illustrates the combined use of multimodal TBI segmentation and time point comparison using 3D Slicer, a widely-used software environment whose TBI data processing solutions are openly available. For three representative TBI cases, semi-automatic tissue classification and 3D model generation are performed to perform intra-patient time point comparison of TBI using multimodal volumetrics and clinical atrophy measures. Identification and quantitative assessment of extra- and intra-cortical bleeding, lesions, edema, and diffuse axonal injury are demonstrated. The proposed tools allow cross-correlation of multimodal metrics from structural imaging (e.g., structural volume, atrophy measurements) with clinical outcome variables and other potential factors predictive of recovery. In addition, the workflows described are suitable for TBI clinical practice and patient monitoring, particularly for assessing damage extent and for the measurement of neuroanatomical change over time. With knowledge of general location, extent, and degree of change, such metrics can be associated with clinical measures and subsequently used to suggest viable treatment options. Keywords: namic |
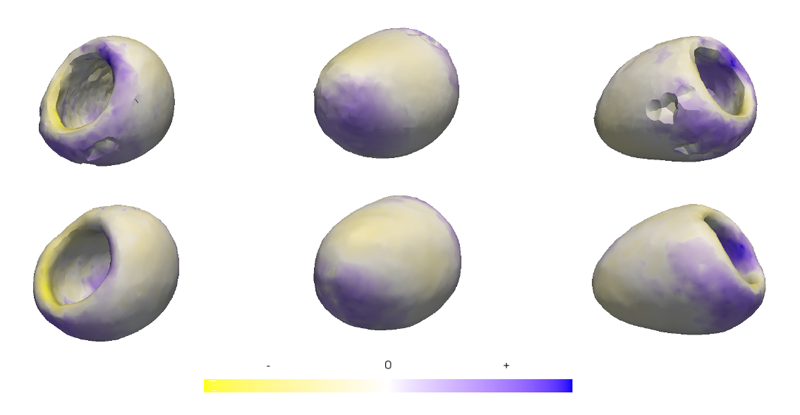
| Comparison of the endocranial ontogenies between chimpanzees and bonobos via temporal regression and spatiotemporal registration S. Durrleman, X. Pennec, A. Trouvé, N. Ayache, J. Braga. In Journal of Human Evolution, pp. 74--88. January, 2011. DOI: 10.1016/j.jhevol.2011.10.004 PubMed ID: 22137587 This paper aims at quantifying ontogenetic differences between bonobo (Pan paniscus) and chimpanzee (Pan troglodytes) endocrania, using dental development as a timeline. We utilize a methodology based on smooth and invertible deformations combined with a metric of "currents" that defines a distance between endocranial surfaces and does not rely on correspondence between landmarks. This allows us to perform a temporal surface regression that estimates typical endocranial ontogenetic trajectories separately for bonobos and chimpanzees. We highlight non-linear patterns of endocranial ontogenetic change and significant differences between species at local anatomical levels rather than considering the endocranium as a uniform entity. A spatiotemporal registration permits the quantification of inter-species differences decomposed into a morphological deformation (accounting for size and shape differences independently of age) and a time warp (accounting for changes in the dynamics of development). Our statistical simulations suggest that patterns of endocranial volume (EV) increase may differ significantly between bonobos and chimpanzees, with an earlier phase of a relatively rapid increase (preferentially at some endocranial subdivisions) in the former and a much later phase of relatively rapid increase in the latter. As a consequence, the chimpanzee endocranium appears to reach its adult size later. Moreover, the time warp indicates that juvenile bonobos develop much slower than juvenile chimpanzees, suggesting that inter-specific ontogenetic shifts do not only concern EV increase, but also the rate of shape changes over time. Our method provides, for the first time, a quantitative estimation of inter-specific ontogenetic shifts that appear to differentiate non-linearly. |