


SCI Publications
2014


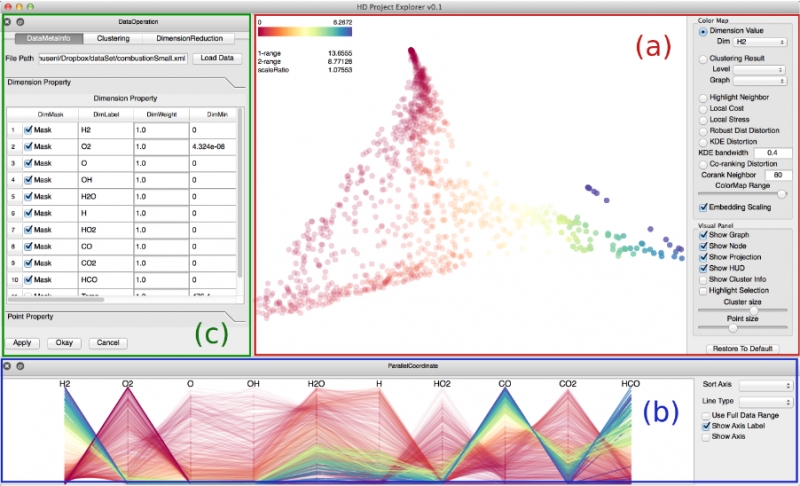
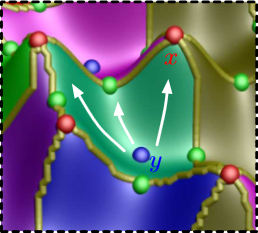
S. Liu, Bei Wang, P.-T. Bremer, V. Pascucci.
“Distortion-Guided Structure-Driven Interactive Exploration of High-Dimensional Data,” In Computer Graphics Forum, Vol. 33, No. 3, Wiley-Blackwell, pp. 101--110. June, 2014.
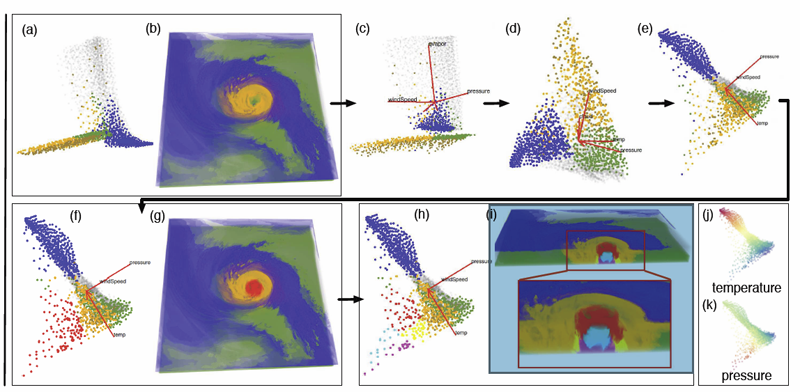
Shusen Liu, Bei Wang, J.J. Thiagarajan, P.-T. Bremer, V. Pascucci.
“Multivariate Volume Visualization through Dynamic Projections,” In Proceedings of the IEEE Symposium on Large Data Analysis and Visualization (LDAV), 2014.
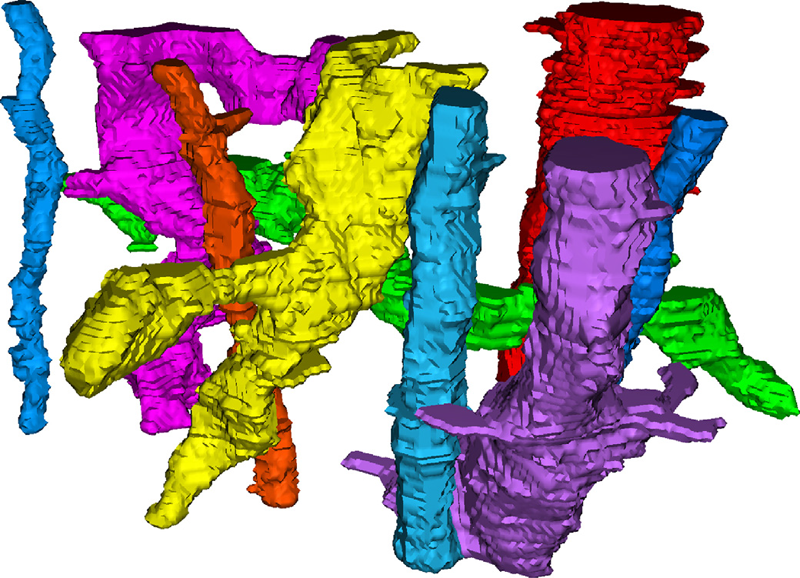
T. Liu, C. Jones, M. Seyedhosseini, T. Tasdizen.
“A modular hierarchical approach to 3D electron microscopy image segmentation,” In Journal of Neuroscience Methods, Vol. 226, No. 15, pp. 88--102. April, 2014.
DOI: 10.1016/j.jneumeth.2014.01.022
Keywords: Image segmentation, Electron microscopy, Hierarchical segmentation, Semi-automatic segmentation, Neuron reconstruction
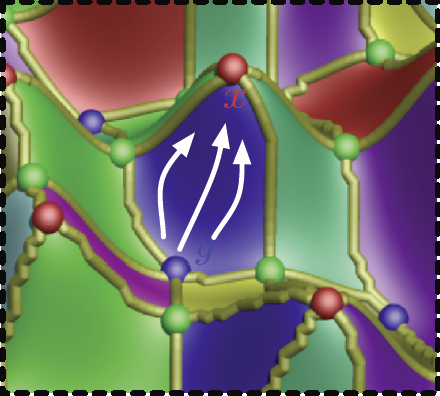
D. Maljovec, Bei Wang, J. Moeller, V. Pascucci.
“Topology-Based Active Learning,” SCI Technical Report, No. UUSCI-2014-001, SCI Institute, University of Utah, 2014.
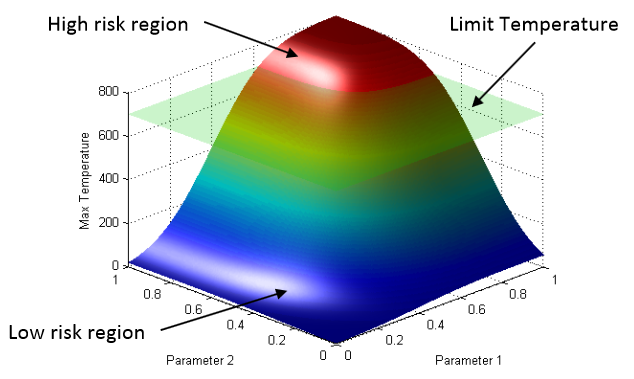
D. Maljovec, S. Liu, Bei Wang, V. Pascucci, P.-T. Bremer, D. Mandelli, C. Smith.
“Analyzing Simulation-Based PRA Data Through Clustering: a BWR Station Blackout Case Study,” In Proceedings of the Probabilistic Safety Assessment & Management conference (PSAM), 2014.
Keywords: PRA, computational topology, clustering, high-dimensional analysis
D. Mandelli, C. Smith, T. Riley, J. Nielsen, J. Schroeder, C. Rabiti, A. Alfonsi, J. Cogliati, R. Kinoshita, V. Pascucci, Bei Wang, D. Maljovec.
“Overview of New Tools to Perform Safety Analysis: BWR Station Black Out Test Case,” In Proceedings of the Probabilistic Safety Assessment & Management conference (PSAM), 2014.
C. McGann, N. Akoum, A. Patel, E. Kholmovski, P. Revelo, K. Damal, B. Wilson, J. Cates, A. Harrison, R. Ranjan, N.S. Burgon, T. Greene, D. Kim, E.V. Dibella, D. Parker, R.S. MacLeod, N.F. Marrouche.
“Atrial fibrillation ablation outcome is predicted by left atrial remodeling on MRI,” In Circ Arrhythm Electrophysiol, Vol. 7, No. 1, pp. 23--30. 2014.
DOI: 10.1161/CIRCEP.113.000689
PubMed ID: 24363354
BACKGROUND:
Although catheter ablation therapy for atrial fibrillation (AF) is becoming more common, results vary widely, and patient selection criteria remain poorly defined. We hypothesized that late gadolinium enhancement MRI (LGE-MRI) can identify left atrial (LA) wall structural remodeling (SRM) and stratify patients who are likely or not to benefit from ablation therapy.
LGE-MRI was performed on 426 consecutive patients with AF without contraindications to MRI before undergoing their first ablation procedure and on 21 non-AF control subjects. Patients were categorized by SRM stage (I-IV) based on the percentage of LA wall enhancement for correlation with procedure outcomes. Histological validation of SRM was performed comparing LGE-MRI with surgical biopsy. A total of 386 patients (91%) with adequate LGE-MRI scans were included in the study. After ablation, 123 patients (31.9%) experienced recurrent atrial arrhythmias during the 1-year follow-up. Recurrent arrhythmias (failed ablations) occurred at higher SRM stages with 28 of 133 (21.0%) in stage I, 40 of 140 (29.3%) in stage II, 24 of 71 (33.8%) in stage III, and 30 of 42 (71.4%) in stage IV. In multivariate analysis, ablation outcome was best predicted by advanced SRM stage (hazard ratio, 4.89; P
G. McInerny, M. Chen, R. Freeman, D. Gavaghan, M.D. Meyer, F. Rowland, D. Spiegelhalter, M. Steganer, G. Tessarolo, J. Hortal.
“Information Visualization for Science and Policy: Engaging Users and Avoiding Bias,” In Trends in Ecology & Evolution, Vol. 29, No. 3, pp. 148--157. 2014.
DOI: 10.1016/j.tree.2014.01.003

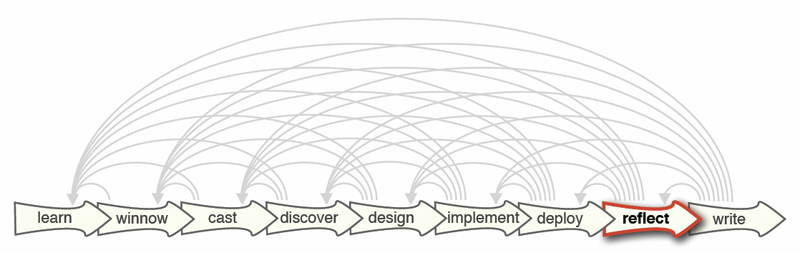
S. McKenna, D. Mazur, J. Agutter, M.D. Meyer.
“Design Activity Framework for Visualization Design,” In IEEE Transactions on Visualization and Computer Graphics (TVCG), 2014.
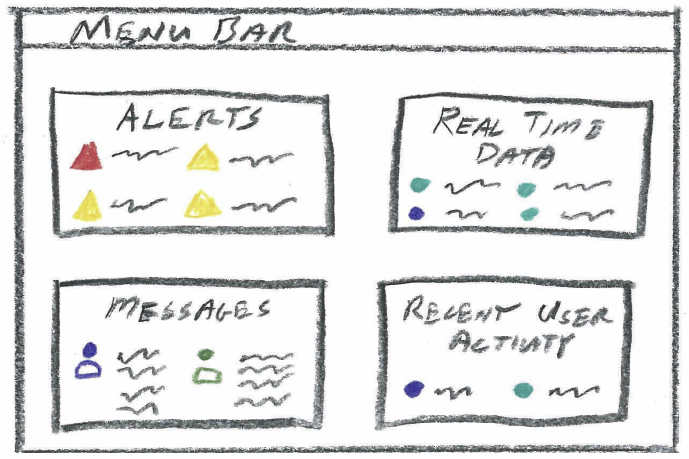
Keywords: Design, frameworks, process, cybersecurity, nested model, decisions, models, evaluation, visualization
Q. Meng, M. Berzins.
“Scalable large-scale fluid-structure interaction solvers in the Uintah framework via hybrid task-based parallelism algorithms,” In Concurrency and Computation: Practice and Experience, Vol. 26, No. 7, pp. 1388--1407. May, 2014.
DOI: 10.1002/cpe
Uintah is a software framework that provides an environment for solving fluid–structure interaction problems on structured adaptive grids for large-scale science and engineering problems involving the solution of partial differential equations. Uintah uses a combination of fluid flow solvers and particle-based methods for solids, together with adaptive meshing and a novel asynchronous task-based approach with fully automated load balancing. When applying Uintah to fluid–structure interaction problems, the combination of adaptive mesh- ing and the movement of structures through space present a formidable challenge in terms of achieving scalability on large-scale parallel computers. The Uintah approach to the growth of the number of core counts per socket together with the prospect of less memory per core is to adopt a model that uses MPI to communicate between nodes and a shared memory model on-node so as to achieve scalability on large-scale systems. For this approach to be successful, it is necessary to design data structures that large numbers of cores can simultaneously access without contention. This scalability challenge is addressed here for Uintah, by the development of new hybrid runtime and scheduling algorithms combined with novel lock-free data structures, making it possible for Uintah to achieve excellent scalability for a challenging fluid–structure problem with mesh refinement on as many as 260K cores.
Keywords: MPI, threads, Uintah, many core, lock free, fluid-structure interaction, c-safe
Qingyu Meng.
“Large-Scale Distributed Runtime System for DAG-Based Computational Framework,” Note: Ph.D. in Computer Science, advisor Martin Berzins, School of Computing, University of Utah, August, 2014.
Recent trends in high performance computing present larger and more diverse computers using multicore nodes possibly with accelerators and/or coprocessors and reduced memory. These changes pose formidable challenges for applications code to attain scalability. Software frameworks that execute machine-independent applications code using a runtime system that shields users from architectural complexities offer a portable solution for easy programming. The Uintah framework, for example, solves a broad class of large-scale problems on structured adaptive grids using fluid-flow solvers coupled with particle-based solids methods. However, the original Uintah code had limited scalability as tasks were run in a predefined order based solely on static analysis of the task graph and used only message passing interface (MPI) for parallelism. By using a new hybrid multithread and MPI runtime system, this research has made it possible for Uintah to scale to 700K central processing unit (CPU) cores when solving challenging fluid-structure interaction problems. Those problems often involve moving objects with adaptive mesh refinement and thus with highly variable and unpredictable work patterns. This research has also demonstrated an ability to run capability jobs on the heterogeneous systems with Nvidia graphics processing unit (GPU) accelerators or Intel Xeon Phi coprocessors. The new runtime system for Uintah executes directed acyclic graphs of computational tasks with a scalable asynchronous and dynamic runtime system for multicore CPUs and/or accelerators/coprocessors on a node. Uintah's clear separation between application and runtime code has led to scalability increases without significant changes to application code. This research concludes that the adaptive directed acyclic graph (DAG)-based approach provides a very powerful abstraction for solving challenging multiscale multiphysics engineering problems. Excellent scalability with regard to the different processors and communications performance are achieved on some of the largest and most powerful computers available today.
J. Mercer, B. Pandian, A. Lex, N. Bonneel,, H. Pfister.
“Mu-8: Visualizing Differences between Proteins and their Families ,” In BMC Proceedings, Vol. 8, No. Suppl 2, pp. S5. Aug, 2014.
ISSN: 1753-6561
DOI: 10.1186/1753-6561-8-S2-S5
A complete understanding of the relationship between the amino acid sequence and resulting protein function remains an open problem in the biophysical sciences. Current approaches often rely on diagnosing functionally relevant mutations by determining whether an amino acid frequently occurs at a specific position within the protein family. However, these methods do not account for the biophysical properties and the 3D structure of the protein. We have developed an interactive visualization technique, Mu-8, that provides researchers with a holistic view of the differences of a selected protein with respect to a family of homologous proteins. Mu-8 helps to identify areas of the protein that exhibit: (1) significantly different bio-chemical characteristics, (2) relative conservation in the family, and (3) proximity to other regions that have suspect behavior in the folded protein.
M.D. Meyer, M. Sedlmair, P.S. Quinan, T. Munzner.
“The Nested Blocks and Guidelines Model,” In Journal of Information Visualization, Special Issue on Evaluation (BELIV), 2014.
M. Milanič, V. Jazbinšek, R.S. MacLeod, D.H. Brooks, R. Hren.
“Assessment of regularization techniques for electrocardiographic imaging,” In Journal of electrocardiology, Vol. 47, No. 1, pp. 20--28. 2014.
DOI: 10.1016/j.jelectrocard.2013.10.004
A widely used approach to solving the inverse problem in electrocardiography involves computing potentials on the epicardium from measured electrocardiograms (ECGs) on the torso surface. The main challenge of solving this electrocardiographic imaging (ECGI) problem lies in its intrinsic ill-posedness. While many regularization techniques have been developed to control wild oscillations of the solution, the choice of proper regularization methods for obtaining clinically acceptable solutions is still a subject of ongoing research. However there has been little rigorous comparison across methods proposed by different groups. This study systematically compared various regularization techniques for solving the ECGI problem under a unified simulation framework, consisting of both 1) progressively more complex idealized source models (from single dipole to triplet of dipoles), and 2) an electrolytic human torso tank containing a live canine heart, with the cardiac source being modeled by potentials measured on a cylindrical cage placed around the heart. We tested 13 different regularization techniques to solve the inverse problem of recovering epicardial potentials, and found that non-quadratic methods (total variation algorithms) and first-order and second-order Tikhonov regularizations outperformed other methodologies and resulted in similar average reconstruction errors.
M. Mirzargar, R. Whitaker, R. M. Kirby.
“Curve Boxplot: Generalization of Boxplot for Ensembles of Curves,” In IEEE Transactions on Visualization and Computer Graphics, Vol. 20, No. 12, IEEE, pp. 2654-63. December, 2014.
In simulation science, computational scientists often study the behavior of their simulations by repeated solutions with variations in parameters and/or boundary values or initial conditions. Through such simulation ensembles, one can try to understand or quantify the variability or uncertainty in a solution as a function of the various inputs or model assumptions. In response to a growing interest in simulation ensembles, the visualization community has developed a suite of methods for allowing users to observe and understand the properties of these ensembles in an efficient and effective manner. An important aspect of visualizing simulations is the analysis of derived features, often represented as points, surfaces, or curves. In this paper, we present a novel, nonparametric method for summarizing ensembles of 2D and 3D curves. We propose an extension of a method from descriptive statistics, data depth, to curves. We also demonstrate a set of rendering and visualization strategies for showing rank statistics of an ensemble of curves, which is a generalization of traditional whisker plots or boxplots to multidimensional curves. Results are presented for applications in neuroimaging, hurricane forecasting and fluid dynamics
P. Muralidharan, J. Fishbaugh, H.J. Johnson, S. Durrleman, J.S. Paulsen, G. Gerig, P.T. Fletcher.
“Diffeomorphic Shape Trajectories for Improved Longitudinal Segmentation and Statistics,” In Proceedings of Medical Image Computing and Computer Assisted Intervention (MICCAI), 2014.

J.A. Nielsen, B.A. Zielinski, P.T. Fletcher, A.L. Alexander, N. Lange, E.D. Bigler, J.E. Lainhart, J.S. Anderson.
“Abnormal lateralization of functional connectivity between language and default mode regions in autism,” In Molecular Autism, Vol. 5, No. 1, pp. 8. 2014.
DOI: 10.1186/2040-2392-5-8
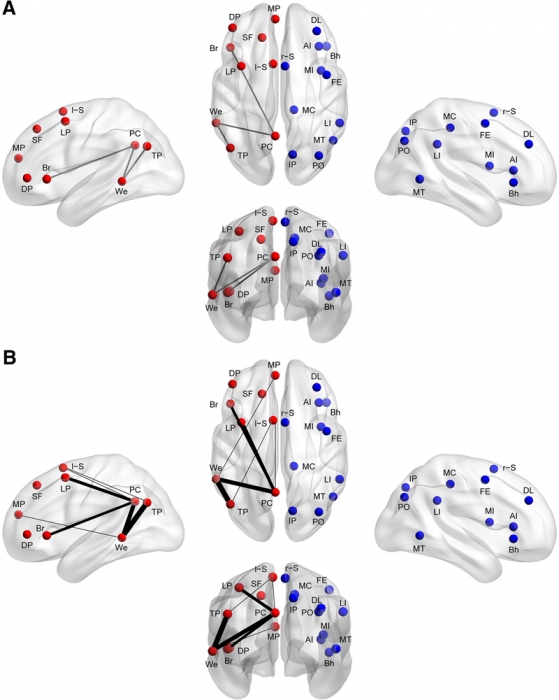
Methods: Using functional connectivity magnetic resonance imaging from a large publicly available sample (n = 964), we tested whether abnormal functional lateralization in autism exists preferentially in language regions or in a more diffuse pattern across networks of lateralized brain regions.
Results: The autism group exhibited significantly reduced left lateralization in a few connections involving language regions and regions from the default mode network, but results were not significant throughout left- and right-lateralized networks. There is a trend that suggests the lack of left lateralization in a connection involving Wernicke area and the posterior cingulate cortex associates with more severe autism.
Conclusions: Abnormal language lateralization in autism may be due to abnormal language development rather than to a deficit in hemispheric specialization of the entire brain.
Keywords: brain lateralization, brain asymmetry, autism, autism spectrum disorder, language, functional magnetic resonance imaging, functional connectivity
K.A. Nestor, J.D. Jones, C.R. Butson, T. Morishita, C.E. Jacobson, D.A. Peace, D. Chen, K.D. Foote, M.S. Okun.
“Coordinate-based lead location does not predict Parkinson's disease deep brain stimulation outcome,” In PloS One, Vol. 9, No. 4, pp. e93524. January, 2014.
ISSN: 1932-6203
DOI: 10.1371/journal.pone.0093524
PubMed ID: 24691109
BACKGROUND: Effective target regions for deep brain stimulation (DBS) in Parkinson's disease (PD) have been well characterized. We sought to study whether the measured Cartesian coordinates of an implanted DBS lead are predictive of motor outcome(s). We tested the hypothesis that the position and trajectory of the DBS lead relative to the mid-commissural point (MCP) are significant predictors of clinical outcomes. We expected that due to neuroanatomical variation among individuals, a simple measure of the position of the DBS lead relative to MCP (commonly used in clinical practice) may not be a reliable predictor of clinical outcomes when utilized alone.
METHODS: 55 PD subjects implanted with subthalamic nucleus (STN) DBS and 41 subjects implanted with globus pallidus internus (GPi) DBS were included. Lead locations in AC-PC space (x, y, z coordinates of the active contact and sagittal and coronal entry angles) measured on high-resolution CT-MRI fused images, and motor outcomes (Unified Parkinson's Disease Rating Scale) were analyzed to confirm or refute a correlation between coordinate-based lead locations and DBS motor outcomes.
RESULTS: Coordinate-based lead locations were not a significant predictor of change in UPDRS III motor scores when comparing pre- versus post-operative values. The only potentially significant individual predictor of change in UPDRS motor scores was the antero-posterior coordinate of the GPi lead (more anterior lead locations resulted in a worse outcome), but this was only a statistical trend (p<.082).
CONCLUSION: The results of the study showed that a simple measure of the position of the DBS lead relative to the MCP is not significantly correlated with PD motor outcomes, presumably because this method fails to account for individual neuroanatomical variability. However, there is broad agreement that motor outcomes depend strongly on lead location. The results suggest the need for more detailed identification of stimulation location relative to anatomical targets.
I. Oguz, M. Farzinfar, J. Matsui, F. Budin, Z. Liu, G. Gerig, H.J. Johnson, M.A. Styner.
“DTIPrep: Quality Control of Diffusion-Weighted Images,” In Frontiers in Neuroinformatics, Vol. 8, No. 4, 2014.
DOI: 10.3389/fninf.2014.00004
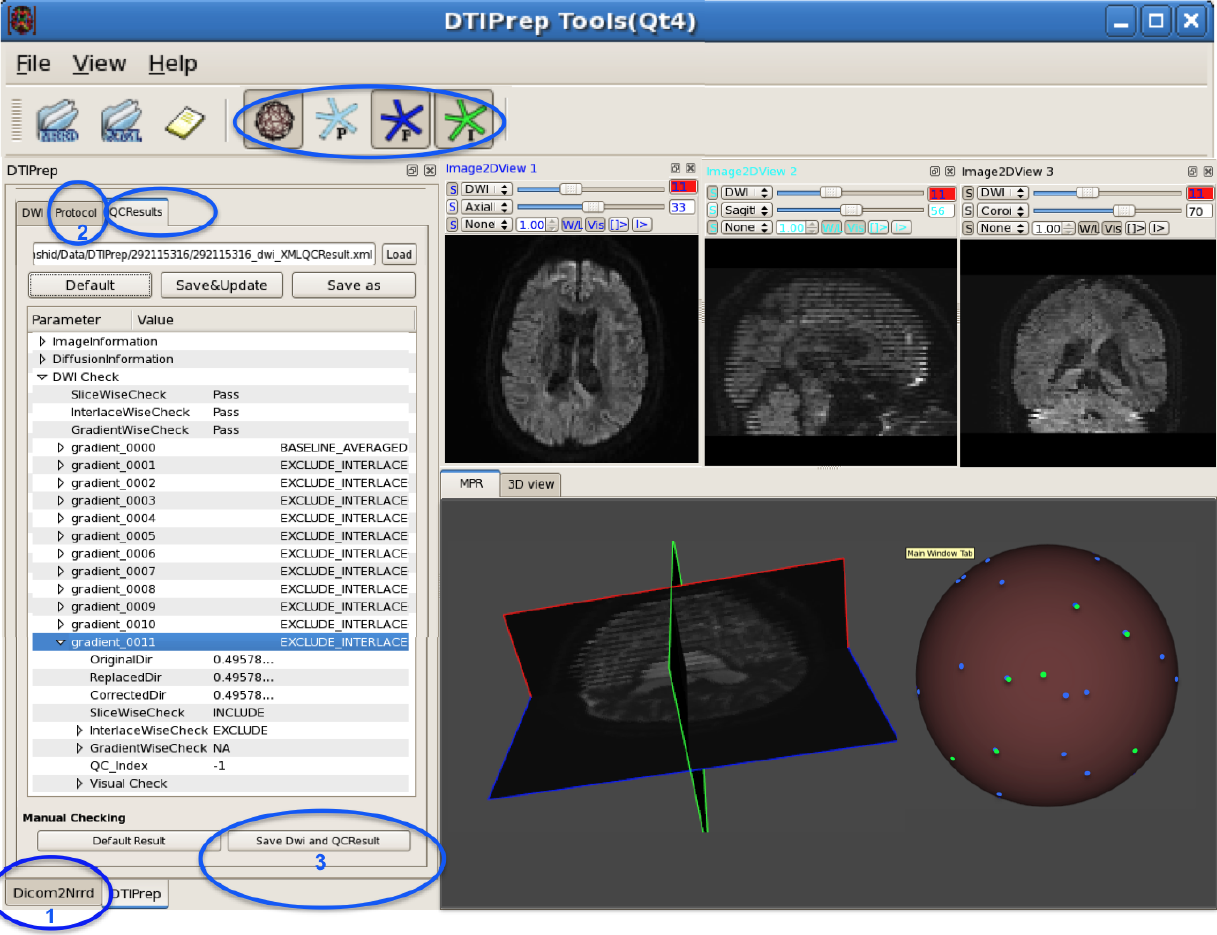
In the last decade, diffusion MRI (dMRI) studies of the human and animal brain have been used to investigate a multitude of pathologies and drug-related effects in neuroscience research. Study after study identifies white matter (WM) degeneration as a crucial biomarker for all these diseases. The tool of choice for studying WM is dMRI. However, dMRI has inherently low signal-to-noise ratio and its acquisition requires a relatively long scan time; in fact, the high loads required occasionally stress scanner hardware past the point of physical failure. As a result, many types of artifacts implicate the quality of diffusion imagery. Using these complex scans containing artifacts without quality control (QC) can result in considerable error and bias in the subsequent analysis, negatively affecting the results of research studies using them. However, dMRI QC remains an under-recognized issue in the dMRI community as there are no user-friendly tools commonly available to comprehensively address the issue of dMRI QC. As a result, current dMRI studies often perform a poor job at dMRI QC.
Thorough QC of diffusion MRI will reduce measurement noise and improve reproducibility, and sensitivity in neuroimaging studies; this will allow researchers to more fully exploit the power of the dMRI technique and will ultimately advance neuroscience. Therefore, in this manuscript, we present our open-source software, DTIPrep, as a unified, user friendly platform for thorough quality control of dMRI data. These include artifacts caused by eddy-currents, head motion, bed vibration and pulsation, venetian blind artifacts, as well as slice-wise and gradient-wise intensity inconsistencies. This paper summarizes a basic set of features of DTIPrep described earlier and focuses on newly added capabilities related to directional artifacts and bias analysis.
Keywords: diffusion MRI, Diffusion Tensor Imaging, Quality control, Software, open-source, preprocessing
D.C.B. de Oliveira, A. Humphrey, Q. Meng, Z. Rakamaric, M. Berzins, G. Gopalakrishnan.
“Systematic Debugging of Concurrent Systems Using Coalesced Stack Trace Graphs,” In Proceedings of the 27th International Workshop on Languages and Compilers for Parallel Computing (LCPC), September, 2014.
A central need during software development of large-scale parallel systems is tools that help help to identify the root causes of bugs quickly. Given the massive scale of these systems, tools that highlight changes--say introduced across software versions or their operating conditions (e.g., inputs, schedules)--can prove to be highly effective in practice. Conventional debuggers, while good at presenting details at the problem-site (e.g., crash), often omit contextual information to identify the root causes of the bug. We present a new approach to collect and coalesce stack traces, leading to an efficient summary display of salient system control flow differences in a graphical form called Coalesced Stack Trace Graphs (CSTG). CSTGs have helped us understand and debug situations within a computational framework called Uintah that has been deployed at large scale, and undergoes frequent version updates. In this paper, we detail CSTGs through case studies in the context of Uintah where unexpected behaviors caused by different vesions of software or occurring across different time-steps of a system (e.g., due to non-determinism) are debugged. We show that CSTG also gives conventional debuggers a far more productive and guided role to play.