


SCI Publications
2013


M. Berzins.
“Data and Range-Bounded Polynomials in ENO Methods,” In Journal of Computational Science, Vol. 4, No. 1-2, pp. 62--70. 2013.
DOI: 10.1016/j.jocs.2012.04.006
Essentially Non-Oscillatory (ENO) methods and Weighted Essentially Non-Oscillatory (WENO) methods are of fundamental importance in the numerical solution of hyperbolic equations. A key property of such equations is that the solution must remain positive or lie between bounds. A modification of the polynomials used in ENO methods to ensure that the modified polynomials are either bounded by adjacent values (data-bounded) or lie within a specified range (range-bounded) is considered. It is shown that this approach helps both in the range boundedness in the preservation of extrema in the ENO polynomial solution.
N.M. Bertagnolli, J.A. Drake, J.M. Tennessen, O. Alter.
“SVD Identifies Transcript Length Distribution Functions from DNA Microarray Data and Reveals Evolutionary Forces Globally Affecting GBM Metabolism,” In Public Library of Science (PLoS) One, Vol. 8, No. 11, pp. article e78913. November, 2013.
DOI: 10.1371/journal.pone.0078913
To search for evolutionary forces that might act upon transcript length, we use the singular value decomposition (SVD) to identify the length distribution functions of sets and subsets of human and yeast transcripts from profiles of mRNA abundance levels across gel electrophoresis migration distances that were previously measured by DNA microarrays. We show that the SVD identifies the transcript length distribution functions as “asymmetric generalized coherent states” from the DNA microarray data and with no a-priori assumptions. Comparing subsets of human and yeast transcripts of the same gene ontology annotations, we find that in both disparate eukaryotes, transcripts involved in protein synthesis or mitochondrial metabolism are significantly shorter than typical, and in particular, significantly shorter than those involved in glucose metabolism. Comparing the subsets of human transcripts that are overexpressed in glioblastoma multiforme (GBM) or normal brain tissue samples from The Cancer Genome Atlas, we find that GBM maintains normal brain overexpression of significantly short transcripts, enriched in transcripts that are involved in protein synthesis or mitochondrial metabolism, but suppresses normal overexpression of significantly longer transcripts, enriched in transcripts that are involved in glucose metabolism and brain activity. These global relations among transcript length, cellular metabolism and tumor development suggest a previously unrecognized physical mode for tumor and normal cells to differentially regulate metabolism in a transcript length-dependent manner. The identified distribution functions support a previous hypothesis from mathematical modeling of evolutionary forces that act upon transcript length in the manner of the restoring force of the harmonic oscillator.
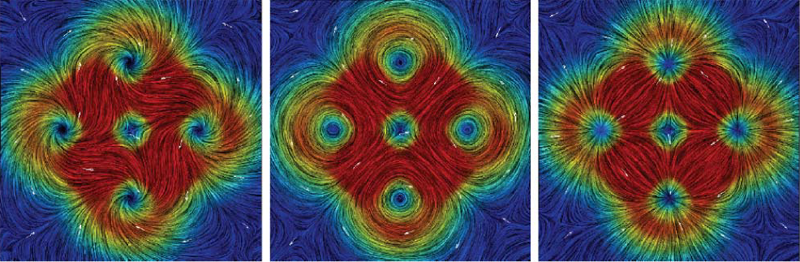
H. Bhatia, G. Norgard, V. Pascucci, P.-T. Bremer.
“The Helmholtz-Hodge Decomposition - A Survey,” In IEEE Transactions on Visualization and Computer Graphics (TVCG), Vol. 19, No. 8, Note: Selected as Spotlight paper for August 2013 issue, pp. 1386--1404. 2013.
DOI: 10.1109/TVCG.2012.316
H. Bhatia, G. Norgard, V. Pascucci, P.-T. Bremer.
“Comments on the “Meshless Helmholtz-Hodge decomposition”,” In IEEE Transactions on Visualization and Computer Graphics, Vol. 19, No. 3, pp. 527--528. 2013.
DOI: 10.1109/TVCG.2012.62
The Helmholtz-Hodge decomposition (HHD) is one of the fundamental theorems of fluids describing the decomposition of a flow field into its divergence-free, curl-free and harmonic components. Solving for an HDD is intimately connected to the choice of boundary conditions which determine the uniqueness and orthogonality of the decomposition. This article points out that one of the boundary conditions used in a recent paper \"Meshless Helmholtz-Hodge decomposition\" [5] is, in general, invalid and provides an analytical example demonstrating the problem. We hope that this clarification on the theory will foster further research in this area and prevent undue problems in applying and extending the original approach.
C. Brownlee, T. Ize, C.D. Hansen.
“Image-parallel Ray Tracing using OpenGL Interception,” In Proceedings of the Eurographics Symposium on Parallel Graphics and Visualization (EGPGV 2013), pp. 65--72. 2013.
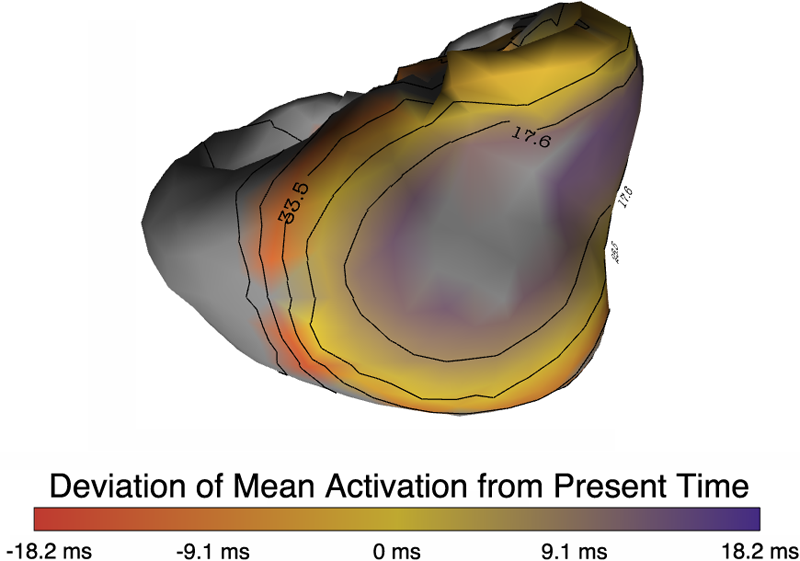
B. Burton, B. Erem, K. Potter, P. Rosen, C.R. Johnson, D. Brooks, R.S. Macleod.
“Uncertainty Visualization in Forward and Inverse Cardiac Models,” In Computing in Cardiology CinC, pp. 57--60. 2013.
ISSN: 2325-8861
C. Butson, G. Tamm, S. Jain, T. Fogal, J. Krüger.
“Evaluation of Interactive Visualization on Mobile Computing Platforms for Selection of Deep Brain Stimulation Parameters,” In IEEE Transactions on Visualization and Computer Graphics, Vol. 19, No. 1, pp. 108--117. January, 2013.
DOI: 10.1109/TVCG.2012.92
PubMed ID: 22450824
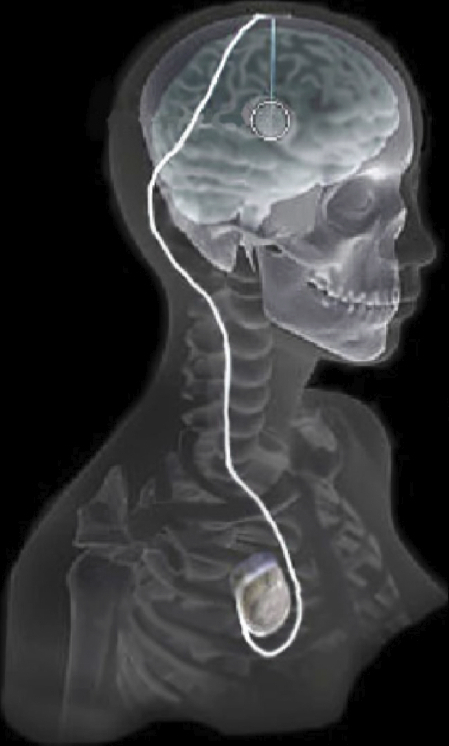
Keywords: Biomedical and Medical Visualization, Mobile and Ubiquitous Visualization, Computational Model, Clinical Decision Making, Parkinson’s Disease, SciDAC, ImageVis3D
J. Chen, A. Choudhary, S. Feldman, B. Hendrickson, C.R. Johnson, R. Mount, V. Sarkar, V. White, D. Williams.
“Synergistic Challenges in Data-Intensive Science and Exascale Computing,” Note: Summary Report of the Advanced Scientific Computing Advisory Committee (ASCAC) Subcommittee, March, 2013.
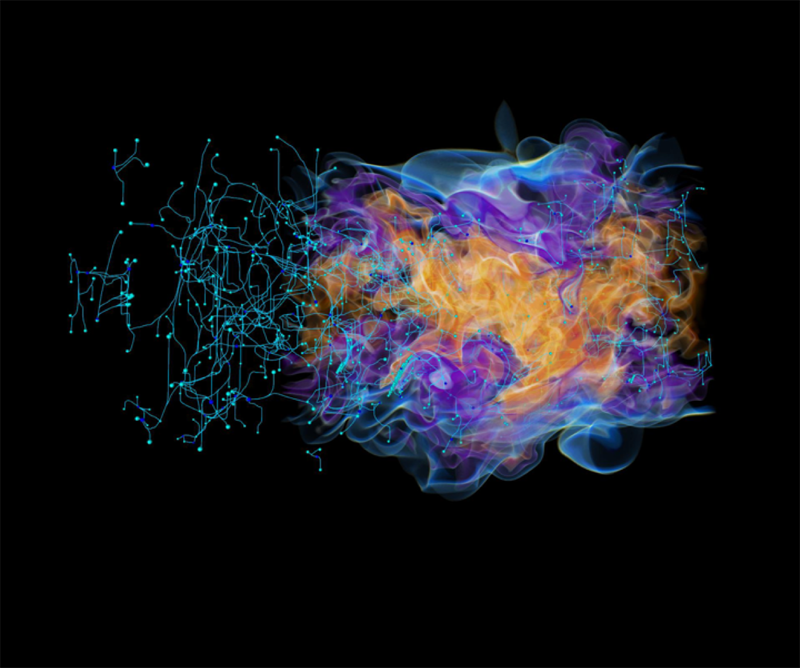
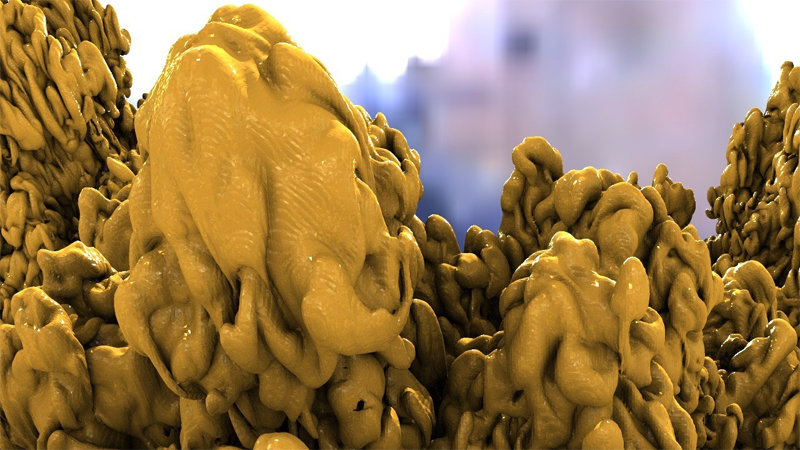
F. Chen, H. Obermaier, H. Hagen, B. Hamann, J. Tierny, V. Pascucci.
“Topology analysis of time-dependent multi-fluid data using the Reeb graph,” In Computer Aided Geometric Design, Vol. 30, No. 6, pp. 557--566. 2013.
DOI: 10.1016/j.cagd.2012.03.019
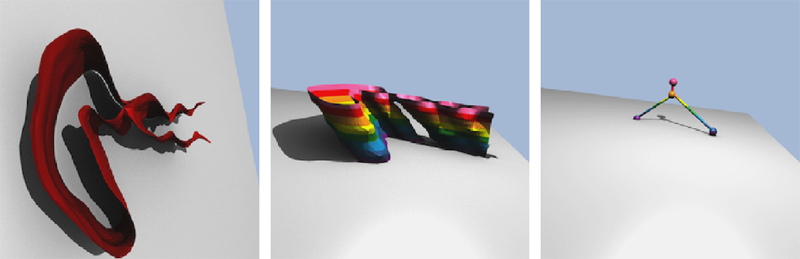
Keywords: Multi-phase fluid, Level set, Topology method, Point-based multi-fluid simulation
A. Daducci, E.J. Canales-Rodriguez, M. Descoteaux, E. Garyfallidis, Y. Gur, Y.-C Lin, M. Mani, S. Merlet, M. Paquette, A. Ramirez-Manzanares, M. Reisert, P.R. Rodrigues, F. Sepehrband, E. Caruyer, J. Choupan, R. Deriche, M. Jacob, G. Menegaz, V. Prckovska, M. Rivera, Y. Wiaux, J.-P. Thiran.
“Quantitative comparison of reconstruction methods for intra-voxel fiber recovery from diffusion MRI,” In IEEE Transactions on Medical Imaging, Vol. 33, No. 2, pp. 384--399. 2013.
ISSN: 0278-0062
DOI: 10.1109/TMI.2013.2285500
Validation is arguably the bottleneck in the diffusion MRI community. This paper evaluates and compares 20 algorithms for recovering the local intra-voxel fiber structure from diffusion MRI data and is based on the results of the "HARDI reconstruction challenge" organized in the context of the "ISBI 2012" conference. Evaluated methods encompass a mixture of classical techniques well-known in the literature such as Diffusion Tensor, Q-Ball and Diffusion Spectrum imaging, algorithms inspired by the recent theory of compressed sensing and also brand new approaches proposed for the first time at this contest. To quantitatively compare the methods under controlled conditions, two datasets with known ground-truth were synthetically generated and two main criteria were used to evaluate the quality of the reconstructions in every voxel: correct assessment of the number of fiber populations and angular accuracy in their orientation. This comparative study investigates the behavior of every algorithm with varying experimental conditions and highlights strengths and weaknesses of each approach.
M. Datar, I. Lyu, S. Kim, J. Cates, M.A. Styner, R.T. Whitaker.
“Geodesic distances to landmarks for dense correspondence on ensembles of complex shapes,” In Proceedings of Medical Image Computing and Computer-Assisted Intervention (MICCAI 2011), Vol. 16(Pt. 2), pp. 19--26. 2013.
PubMed ID: 24579119
Establishing correspondence points across a set of biomedical shapes is an important technology for a variety of applications that rely on statistical analysis of individual subjects and populations. The inherent complexity (e.g. cortical surface shapes) and variability (e.g. cardiac chambers) evident in many biomedical shapes introduce significant challenges in finding a useful set of dense correspondences. Application specific strategies, such as registration of simplified (e.g. inflated or smoothed) surfaces or relying on manually placed landmarks, provide some improvement but suffer from limitations including increased computational complexity and ambiguity in landmark placement. This paper proposes a method for dense point correspondence on shape ensembles using geodesic distances to a priori landmarks as features. A novel set of numerical techniques for fast computation of geodesic distances to point sets is used to extract these features. The proposed method minimizes the ensemble entropy based on these features, resulting in isometry invariant correspondences in a very general, flexible framework.
D.J. Dosdall, R. Ranjan, K. Higuchi, E. Kholmovski, N. Angel, L. Li, R.S. Macleod, L. Norlund, A. Olsen, C.J. Davies, N.F. Marrouche.
“Chronic atrial fibrillation causes left ventricular dysfunction in dogs but not goats: experience with dogs, goats, and pigs,” In American Journal of Physiology: Heart and Circulatory Physiology, Vol. 305, No. 5, pp. H725--H731. September, 2013.
DOI: 10.1152/ajpheart.00440.2013
PubMed ID: 23812387
PubMed Central ID: PMC4116536
Structural remodeling in chronic atrial fibrillation (AF) occurs over weeks to months. To study the electrophysiological, structural, and functional changes that occur in chronic AF, the selection of the best animal model is critical. AF was induced by rapid atrial pacing (50-Hz stimulation every other second) in pigs (n = 4), dogs (n = 8), and goats (n = 9). Animals underwent MRIs at baseline and 6 mo to evaluate left ventricular (LV) ejection fraction (EF). Dogs were given metoprolol (50-100 mg po bid) and digoxin (0.0625-0.125 mg po bid) to limit the ventricular response rate to ot appropriate for chronic rapid atrial pacing-induced AF studies. Rate-controlled chronic AF in the dog model developed HF and LV fibrosis, whereas the goat model developed only atrial fibrosis without ventricular dysfunction and fibrosis. Both the dog and goat models are representative of segments of the patient population with chronic AF.
Keywords: animal models, chronic atrial fibrillation, fibrosis, heart failure, rapid atrial pacing
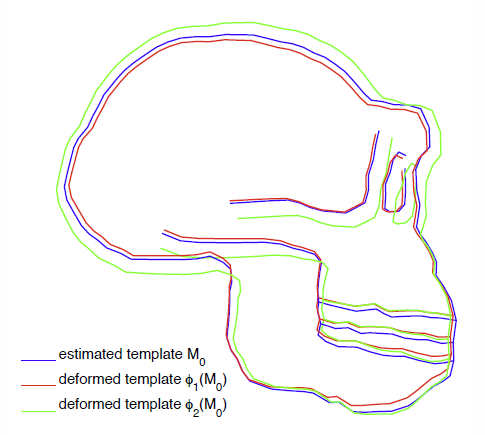
S. Durrleman, X. Pennec, A. Trouvé, J. Braga, G. Gerig, N. Ayache.
“Toward a comprehensive framework for the spatiotemporal statistical analysis of longitudinal shape data,” In International Journal of Computer Vision (IJCV), Vol. 103, No. 1, pp. 22--59. September, 2013.
DOI: 10.1007/s11263-012-0592-x
This paper proposes an original approach for the statistical analysis of longitudinal shape data. The proposed method allows the characterization of typical growth patterns and subject-specific shape changes in repeated time-series observations of several subjects. This can be seen as the extension of usual longitudinal statistics of scalar measurements to high-dimensional shape or image data.
The method is based on the estimation of continuous subject-specific growth trajectories and the comparison of such temporal shape changes across subjects. Differences between growth trajectories are decomposed into morphological deformations, which account for shape changes independent of the time, and time warps, which account for different rates of shape changes over time.
Given a longitudinal shape data set, we estimate a mean growth scenario representative of the population, and the variations of this scenario both in terms of shape changes and in terms of change in growth speed. Then, intrinsic statistics are derived in the space of spatiotemporal deformations, which characterize the typical variations in shape and in growth speed within the studied population. They can be used to detect systematic developmental delays across subjects.
In the context of neuroscience, we apply this method to analyze the differences in the growth of the hippocampus in children diagnosed with autism, developmental delays and in controls. Result suggest that group differences may be better characterized by a different speed of maturation rather than shape differences at a given age. In the context of anthropology, we assess the differences in the typical growth of the endocranium between chimpanzees and bonobos. We take advantage of this study to show the robustness of the method with respect to change of parameters and perturbation of the age estimates.
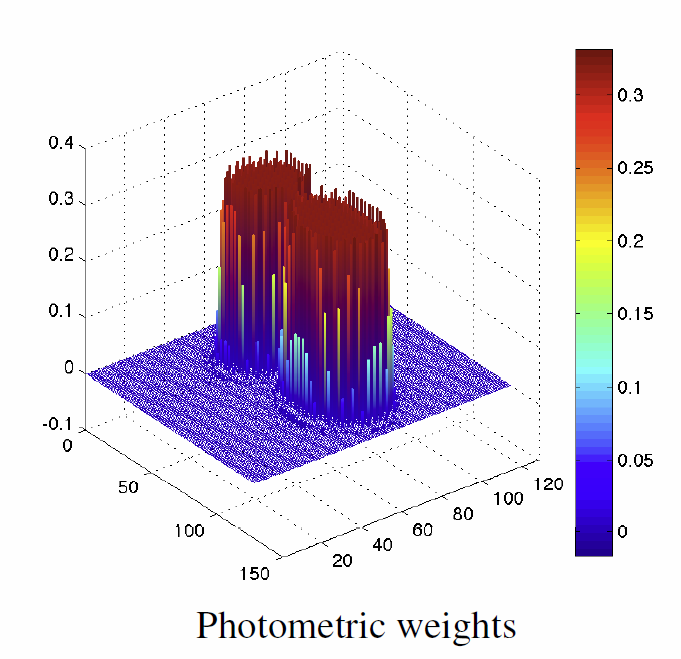
S. Durrleman, S. Allassonnière, S. Joshi.
“Sparse adaptive parameterization of variability in image ensembles,” In International Journal of Computer Vision (IJCV), Vol. 101, No. 1, pp. 161--183. 2013.
DOI: 10.1007/s11263-012-0556-1
L.T. Edgar, S.C. Sibole, C.J. Underwood, J.E. Guilkey, J.A. Weiss.
“A computational model of in vitro angiogenesis based on extracellular matrix fiber orientation,” In Computer Methods in Biomechanical and Biomedical Engineering, Vol. 16, No. 7, pp. 790--801. 2013.
DOI: 10.1080/10255842.2012.662678
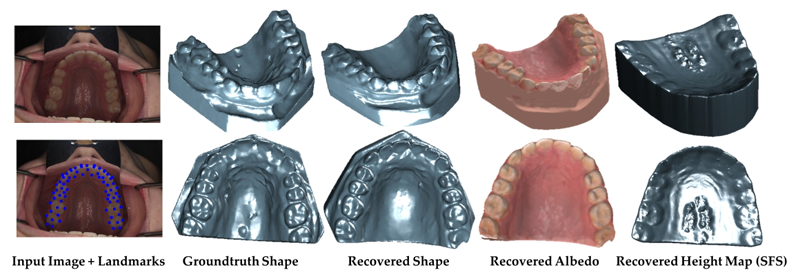
S. Elhabian, A. Farag, D. Tasman, W. Aboelmaaty, A. Farman.
“Clinical Crowns Shape Reconstruction - An Image-based Approach,” In Proceedings of the 2013 IEEE 10th International Symposium on Biomedical Imaging (ISBI), pp. 93--96. 2013.
DOI: 10.1109/ISBI.2013.6556420
J.T. Elison, J.J. Wolff, D.C. Heimer, S.J. Paterson, H. Gu, M. Styner, G. Gerig, J. Piven, the IBIS Network.
“Frontolimbic neural circuitry at 6 months predicts individual differences in joint attention at 9 months,” In Developmental Science, Vol. 16, No. 2, Wiley-Blackwell, pp. 186--197. 2013.
DOI: 10.1111/desc.12015
PubMed Central ID: PMC3582040

J.T. Elison, S.J. Paterson, J.J. Wolff, J.S. Reznick, N.J. Sasson, H. Gu, K.N. Botteron, S.R. Dager, A.M. Estes, A.C. Evans, G. Gerig, H.C. Hazlett, R.T. Schultz, M. Styner, L. Zwaigenbaum, J. Piven for the IBIS Network.
“White Matter Microstructure and Atypical Visual Orienting in 7 Month-Olds at Risk for Autism,” In American Journal of Psychiatry, Vol. AJP-12-09-1150.R2, March, 2013.
DOI: 10.1176/appi.ajp.2012.12091150
PubMed ID: 23511344
Objective: To determine whether specific patterns of oculomotor functioning and visual orienting characterize 7 month-old infants later classified with an autism spectrum disorder (ASD) and to identify the neural correlates of these behaviors.
Method: Ninety-seven infants contributed data to the current study (16 high-familial risk infants later classified with an ASD, 40 high-familial risk infants not meeting ASD criteria (high-risk-negative), and 41 low-risk infants). All infants completed an eye tracking task at 7 months and a clinical assessment at 25 months; diffusion weighted imaging data was acquired on 84 infants at 7 months. Primary outcome measures included average saccadic reaction time in a visually guided saccade procedure and radial diffusivity (an index of white matter organization) in fiber tracts that included corticospinal pathways and the splenium and genu of the corpus callosum.
Results: Visual orienting latencies were increased in seven-month-old infants who later express ASD symptoms at 25 months when compared with both high-risk-negative infants (p = 0.012, d = 0.73) and low-risk infants (p = 0.032, d = 0.71). Visual orienting latencies were uniquely associated with the microstructural organization of the splenium of the corpus callosum in low-risk infants, but this association was not apparent in infants later classified with ASD.
Conclusions: Flexibly and efficiently orienting to salient information in the environment is critical for subsequent cognitive and social-cognitive development. Atypical visual orienting may represent an earlyemerging prodromal feature of ASD, and abnormal functional specialization of posterior cortical circuits directly informs a novel model of ASD pathogenesis.
B. Erem, J. Coll-Font, R.M. Orellana, P. Stovicek, D.H. Brooks, R.S. MacLeod.
“Noninvasive reconstruction of potentials on endocardial surface from body surface potentials and CT imaging of partial torso,” In Journal of Electrocardiology, Vol. 46, No. 4, pp. e28. 2013.
DOI: 10.1016/j.jelectrocard.2013.05.104
B. Erem, R.M. Orellana, P. Stovicek, D.H. Brooks, R.S. MacLeod.
“Improved averaging of multi-lead ECGs and electrograms,” In Journal of Electrocardiology, Vol. 46, No. 4, Elsevier, pp. e28. July, 2013.
DOI: 10.1016/j.jelectrocard.2013.05.103