Designed especially for neurobiologists, FluoRender is an interactive tool for multi-channel fluorescence microscopy data visualization and analysis.
Deep brain stimulation
BrainStimulator is a set of networks that are used in SCIRun to perform simulations of brain stimulation such as transcranial direct current stimulation (tDCS) and magnetic transcranial stimulation (TMS).
Developing software tools for science has always been a central vision of the SCI Institute.

SCI Publications

2013


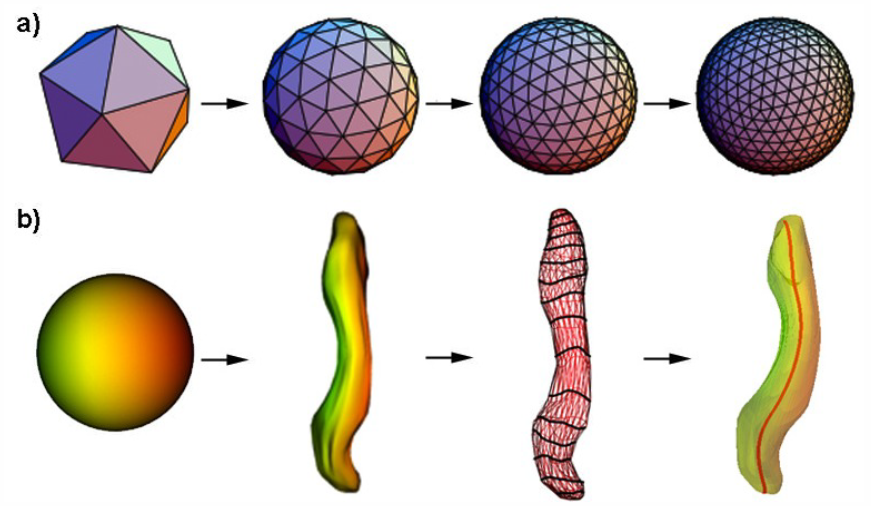
B. Paniagua, A. Lyall, J.-B. Berger, C. Vachet, R.M. Hamer, S. Woolson, W. Lin, J. Gilmore, M. Styner. “Lateral ventricle morphology analysis via mean latitude axis,” In Proceedings of SPIE 8672, Biomedical Applications in Molecular, Structural, and Functional Imaging, 86720M, 2013.
DOI: 10.1117/12.2006846
PubMed ID: 23606800
PubMed Central ID: PMC3630372

ABSTRACT

Statistical shape analysis has emerged as an insightful method for evaluating brain structures in neuroimaging studies, however most shape frameworks are surface based and thus directly depend on the quality of surface alignment. In contrast, medial descriptions employ thickness information as alignment-independent shape metric. We propose a joint framework that computes local medial thickness information via a mean latitude axis from the well-known spherical harmonic (SPHARM-PDM) shape framework. In this work, we applied SPHARM derived medial representations to the morphological analysis of lateral ventricles in neonates. Mild ventriculomegaly (MVM) subjects are compared to healthy controls to highlight the potential of the methodology. Lateral ventricles were obtained from MRI scans of neonates (9- 144 days of age) from 30 MVM subjects as well as age- and sex-matched normal controls (60 total). SPHARM-PDM shape analysis was extended to compute a mean latitude axis directly from the spherical parameterization. Local thickness and area was straightforwardly determined. MVM and healthy controls were compared using local MANOVA and compared with the traditional SPHARM-PDM analysis. Both surface and mean latitude axis findings differentiate successfully MVM and healthy lateral ventricle morphology. Lateral ventricles in MVM neonates show enlarged shapes in tail and head. Mean latitude axis is able to find significant differences all along the lateral ventricle shape, demonstrating that local thickness analysis provides significant insight over traditional SPHARM-PDM. This study is the first to precisely quantify 3D lateral ventricle morphology in MVM neonates using shape analysis.


C. Partl, A. Lex, M. Streit, D. Kalkofen, K. Kashofer, D. Schmalstieg. “enRoute: Dynamic Path Extraction from Biological Pathway Maps for Exploring Heterogeneous Experimental Datasets,” In BMC Bioinformatics, Vol. 14, No. Suppl 19, Nov, 2013.
ISSN: 1471-2105
DOI: 10.1186/1471-2105-14-S19-S3

ABSTRACT

Jointly analyzing biological pathway maps and experimental data is critical for understanding how biological processes work in different conditions and why different samples exhibit certain characteristics. This joint analysis, however, poses a significant challenge for visualization. Current techniques are either well suited to visualize large amounts of pathway node attributes, or to represent the topology of the pathway well, but do not accomplish both at the same time. To address this we introduce enRoute, a technique that enables analysts to specify a path of interest in a pathway, extract this path into a separate, linked view, and show detailed experimental data associated with the nodes of this extracted path right next to it. This juxtaposition of the extracted path and the experimental data allows analysts to simultaneously investigate large amounts of potentially heterogeneous data, thereby solving the problem of joint analysis of topology and node attributes. As this approach does not modify the layout of pathway maps, it is compatible with arbitrary graph layouts, including those of hand-crafted, image-based pathway maps. We demonstrate the technique in context of pathways from the KEGG and the Wikipathways databases. We apply experimental data from two public databases, the Cancer Cell Line Encyclopedia (CCLE) and The Cancer Genome Atlas (TCGA) that both contain a wide variety of genomic datasets for a large number of samples. In addition, we make use of a smaller dataset of hepatocellular carcinoma and common xenograft models. To verify the utility of enRoute, domain experts conducted two case studies where they explore data from the CCLE and the hepatocellular carcinoma datasets in the context of relevant pathways.


V. Pascucci, P.-T. Bremer, A. Gyulassy, G. Scorzelli, C. Christensen, B. Summa, S. Kumar. “Scalable Visualization and Interactive Analysis Using Massive Data Streams,” In Cloud Computing and Big Data, Advances in Parallel Computing, Vol. 23, IOS Press, pp. 212--230. 2013.

ABSTRACT

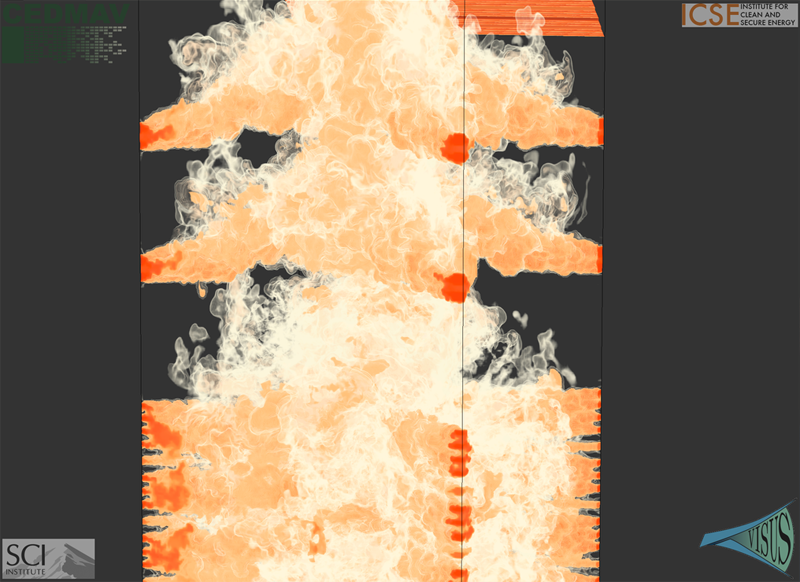
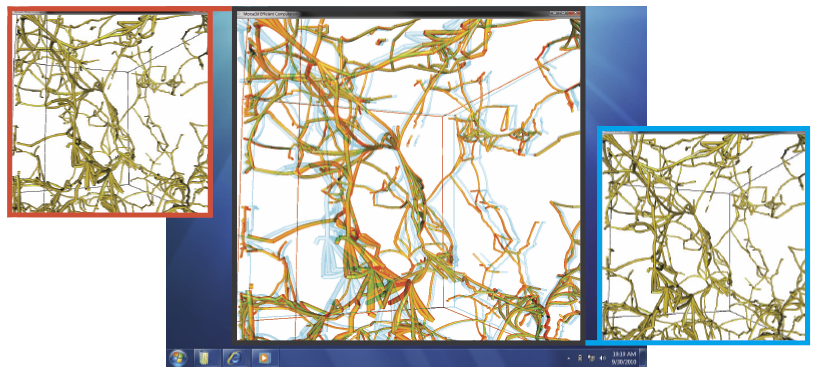
Historically, data creation and storage has always outpaced the infrastructure for its movement and utilization. This trend is increasing now more than ever, with the ever growing size of scientific simulations, increased resolution of sensors, and large mosaic images. Effective exploration of massive scientific models demands the combination of data management, analysis, and visualization techniques, working together in an interactive setting. The ViSUS application framework has been designed as an environment that allows the interactive exploration and analysis of massive scientific models in a cache-oblivious, hardware-agnostic manner, enabling processing and visualization of possibly geographically distributed data using many kinds of devices and platforms.

For general purpose feature segmentation and exploration we discuss a new paradigm based on topological analysis. This approach enables the extraction of summaries of features present in the data through abstract models that are orders of magnitude smaller than the raw data, providing enough information to support general queries and perform a wide range of analyses without access to the original data.

Keywords: Visualization, data analysis, topological data analysis, Parallel I/O


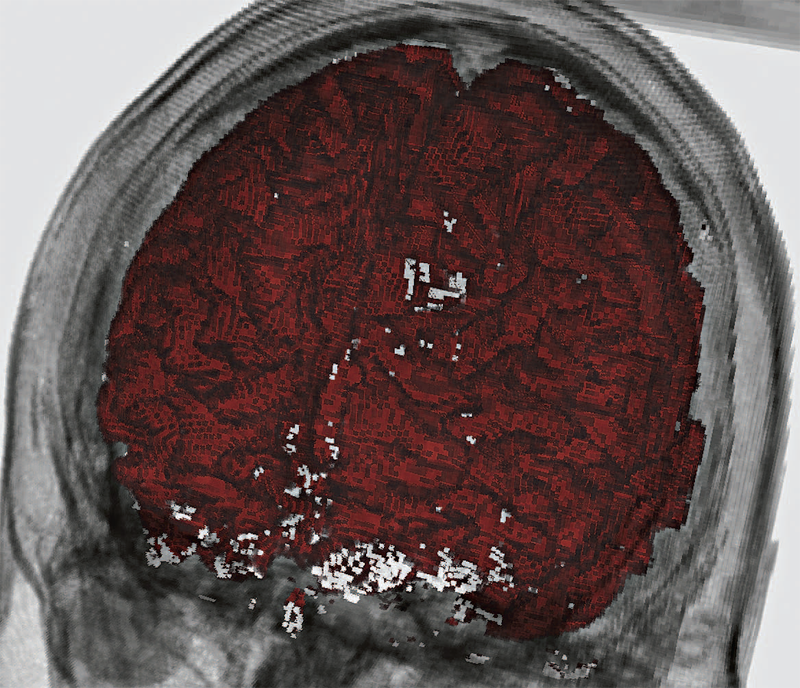
Y. Pathak, B.H. Kopell, A. Szabo, C. Rainey, H. Harsch, C.R. Butson. “The role of electrode location and stimulation polarity in patient response to cortical stimulation for major depressive disorder,” In Brain Stimulation, Vol. 6, No. 3, Elsevier Ltd., pp. 254--260. July, 2013.
ISSN: 1935-861X
DOI: 10.1016/j.brs.2012.07.001

ABSTRACT

BACKGROUND: Major depressive disorder (MDD) is a neuropsychiatric condition that affects about one-sixth of the US population. Chronic epidural stimulation (EpCS) of the left dorsolateral prefrontal cortex (DLPFC) was recently evaluated as a treatment option for refractory MDD and was found to be effective during the open-label phase. However, two potential sources of variability in the study were differences in electrode position and the range of stimulation modes that were used in each patient. The objective of this study was to examine these factors in an effort to characterize successful EpCS therapy.

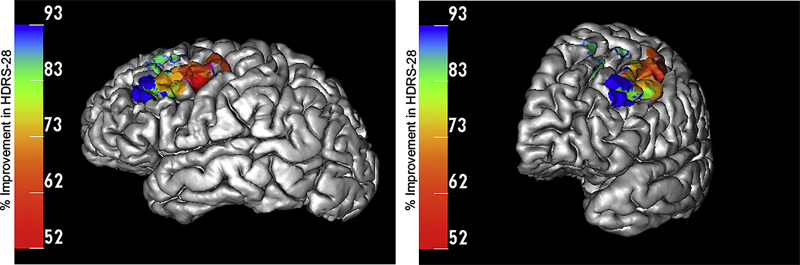
METHODS: Data were analyzed from eleven patients who received EpCS via a chronically implanted system. Estimates were generated of response probability as a function of duration of stimulation. The relative effectiveness of different stimulation modes was also evaluated. Lastly, a computational analysis of the pre- and post-operative imaging was performed to assess the effects of electrode location. The primary outcome measure was the change in Hamilton Depression Rating Scale (HDRS-28).

RESULTS: Significant improvement was observed in mixed mode stimulation (alternating cathodic and anodic) and continuous anodic stimulation (full power). The changes observed in HDRS-28 over time suggest that 20 weeks of stimulation are necessary to approach a 50\% response probability. Lastly, stimulation in the lateral and anterior regions of DLPFC was correlated with greatest degree of improvement.

CONCLUSIONS: A persistent problem in neuromodulation studies has been the selection of stimulation parameters and electrode location to provide optimal therapeutic response. The approach used in this paper suggests that insights can be gained by performing a detailed analysis of response while controlling for important details such as electrode location and stimulation settings.

Keywords: cortical stimulation


J.R. Peterson, C.A. Wight, M. Berzins. “Applying high-performance computing to petascale explosive simulations,” In Procedia Computer Science, 2013.

ABSTRACT

Hazardous scenarios involving explosives are difficult to experimentally study and simulation is often the only viable approach to study highly reactive phenomena. Explosive simulations are computationally expensive, requiring supercomputing resources for continued scientific discovery in the field. Here an idealized mesoscale simulation of explosive grains under mechanical insult by a high-speed projectile with reaction represented by a novel kinetic model is designed to test the scalability of the Uintah software on petascale supercomputers. Good scalability is found up to 49K processors. Timing breakdown of computational tasks are determined with relocation of Lagrangian particles and interpolation of those particles to the grid identified as the most expensive operation and ideal for optimization. Potential optimization strategies are identified. Realistic model simulations rather than toy model simulations are found to better represent scalability of a science code on a supercomputer. Estimations for total supercomputer hours necessary to complete the kinetic model validation study are reported.

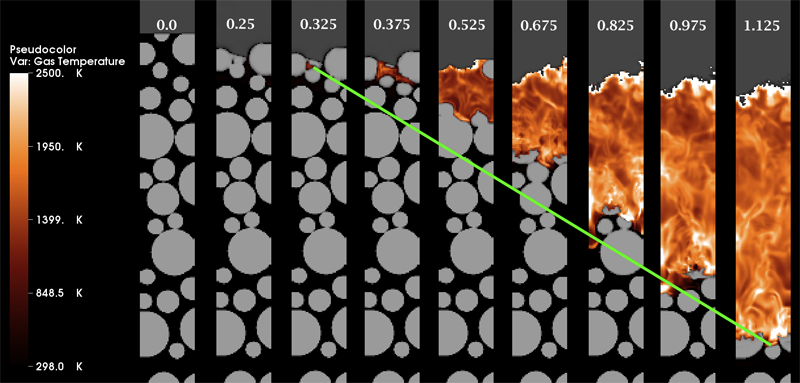
Keywords: Energetic Material Hazards, Uintah, MPM, ICE, MPMICE, Scalable Parallelism, C-SAFE


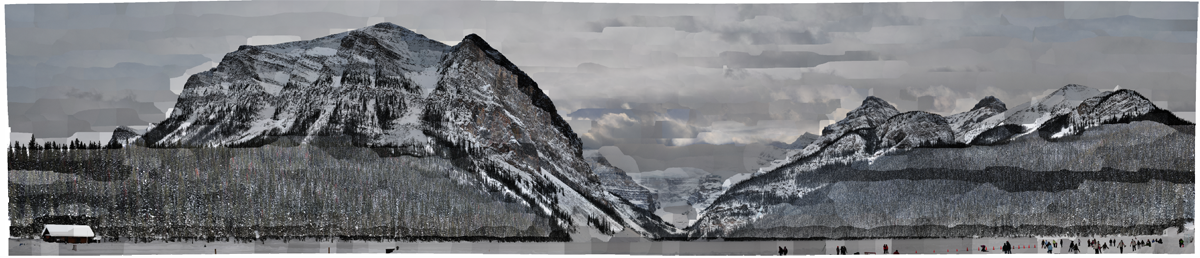
S. Philip, B. Summa, J. Tierny, P.-T. Bremer, V. Pascucci. “Scalable Seams for Gigapixel Panoramas,” In Proceedings of the 2013 Eurographics Symposium on Parallel Graphics and Visualization, Note: Awarded Best Paper!, pp. 25--32. 2013.
DOI: 10.2312/EGPGV/EGPGV13/025-032

ABSTRACT

Gigapixel panoramas are an increasingly popular digital image application. They are often created as a mosaic of smaller images composited into a larger single image. The mosaic acquisition can occur over many hours causing the individual images to differ in exposure and lighting conditions. Therefore, to give the appearance of a single seamless image a blending operation is necessary. The quality of this blending depends on the magnitude of discontinuity along the boundaries between the images. Often image boundaries, or seams, are first computed to minimize this transition. Current techniques based on the multi-labeling Graph Cuts method are too slow and memory intensive for panoramas many gigapixels in size. In this paper we present a multithreaded out-of-core seam computing technique that is fast, has a small memory footprint, and gives near perfect scaling up to the number of physical cores of our test system. With this method the time required to compute image boundaries for gigapixel imagery improves from many hours (or even days) to just a few minutes on commodity hardware while still producing boundaries with energy that is on-par, if not better, than Graph Cuts.


K. Potter, S. Gerber, E.W. Anderson. “Visualization of Uncertainty without a Mean,” In IEEE Computer Graphics and Applications, Visualization Viewpoints, Vol. 33, No. 1, pp. 75--79. 2013.

ABSTRACT

As dataset size and complexity steadily increase, uncertainty is becoming an important data aspect. So, today's visualizations need to incorporate indications of uncertainty. However, characterizing uncertainty for visualization isn't always straightforward. Entropy, in the information-theoretic sense, can be a measure for uncertainty in categorical datasets. The authors discuss the mathematical formulation, interpretation, and use of entropy in visualizations. This research aims to demonstrate entropy as a metric and expand the vocabulary of uncertainty measures for visualization.


N. Ramesh, T. Tasdizen. “Three-dimensional alignment and merging of confocal microscopy stacks,” In 2013 IEEE International Conference on Image Processing, IEEE, September, 2013.
DOI: 10.1109/icip.2013.6738297

ABSTRACT

We describe an efficient, robust, automated method for image alignment and merging of translated, rotated and flipped con-focal microscopy stacks. The samples are captured in both directions (top and bottom) to increase the SNR of the individual slices. We identify the overlapping region of the two stacks by using a variable depth Maximum Intensity Projection (MIP) in the z dimension. For each depth tested, the MIP images gives an estimate of the angle of rotation between the stacks and the shifts in the x and y directions using the Fourier Shift property in 2D. We use the estimated rotation angle, shifts in the x and y direction and align the images in the z direction. A linear blending technique based on a sigmoidal function is used to maximize the information from the stacks and combine them. We get maximum information gain as we combine stacks obtained from both directions.


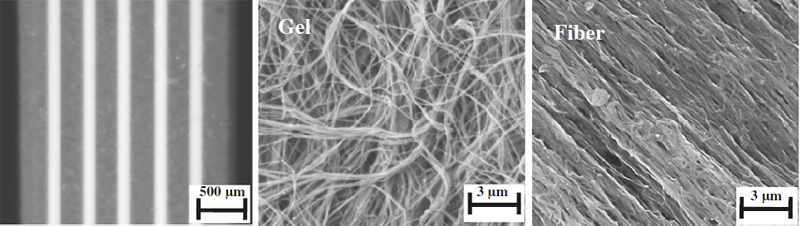
S.P. Reese, C.J. Underwood, J.A. Weiss. “Effects of decorin proteoglycan on fibrillogenesis, ultrastructure, and mechanics of type I collagen gels,” In Matrix Biology, pp. (in press). 2013.
DOI: 10.1016/j.matbio.2013.04.004

ABSTRACT

The proteoglycan decorin is known to affect both the fibrillogenesis and the resulting ultrastructure of in vitro polymerized collagen gels. However, little is known about its effects on mechanical properties. In this study, 3D collagen gels were polymerized into tensile test specimens in the presence of decorin proteoglycan, decorin core protein, or dermatan sulfate (DS). Collagen fibrillogenesis, ultrastructure, and mechanical properties were then quantified using a turbidity assay, 2 forms of microscopy (SEM and confocal), and tensile testing. The presence of decorin proteoglycan or core protein decreased the rate and ultimate turbidity during fibrillogenesis and decreased the number of fibril aggregates (fibers) compared to control gels. The addition of decorin and core protein increased the linear modulus by a factor of 2 compared to controls, while the addition of DS reduced the linear modulus by a factor of 3. Adding decorin after fibrillogenesis had no effect, suggesting that decorin must be present during fibrillogenesis to increase the mechanical properties of the resulting gels. These results show that the inclusion of decorin proteoglycan during fibrillogenesis of type I collagen increases the modulus and tensile strength of resulting collagen gels. The increase in mechanical properties when polymerization occurs in the presence of the decorin proteoglycan is due to a reduction in the aggregation of fibrils into larger order structures such as fibers and fiber bundles.


S.P. Reese, B.J. Ellis, J.A. Weiss. “Micromechanical model of a surrogate for collagenous soft tissues: development, validation, and analysis of mesoscale size effects,” In Biomechanics and Modeling in Mechanobiology, pp. (in press). 2013.
DOI: 10.1007/s10237-013-0475-2

ABSTRACT

Aligned, collagenous tissues such as tendons and ligaments are composed primarily of water and type I collagen, organized hierarchically into nanoscale fibrils, microscale fibers and mesoscale fascicles. Force transfer across scales is complex and poorly understood. Since innervation, the vasculature, damage mechanisms and mechanotransduction occur at the microscale and mesoscale, understanding multiscale interactions is of high importance. This study used a physical model in combination with a computational model to isolate and examine the mechanisms of force transfer between scales. A collagen-based surrogate served as the physical model. The surrogate consisted of extruded collagen fibers embedded within a collagen gel matrix. A micromechanical finite element model of the surrogate was validated using tensile test data that were recorded using a custom tensile testing device mounted on a confocal microscope. Results demonstrated that the experimentally measured macroscale strain was not representative of the microscale strain, which was highly inhomogeneous. The micromechanical model, in combination with a macroscopic continuum model, revealed that the microscale inhomogeneity resulted from size effects in the presence of a constrained boundary. A sensitivity study indicated that significant scale effects would be present over a range of physiologically relevant inter-fiber spacing values and matrix material properties. The results indicate that the traditional continuum assumption is not valid for describing the macroscale behavior of the surrogate and that boundary-induced size effects are present.


P. Rosen, B. Burton, K. Potter, C.R. Johnson. “Visualization for understanding uncertainty in the simulation of myocardial ischemia,” In Proceedings of the 2013 Workshop on Visualization in Medicine and Life Sciences, 2013.

ABSTRACT

We have created the Myocardial Uncertainty Viewer (muView) tool for exploring data stemming from the forward simulation of cardiac ischemia. The simulation uses a collection of conductivity values to understand how ischemic regions effect the undamaged anisotropic heart tissue. The data resulting from the simulation is multivalued and volumetric and thus, for every data point, we have a collection of samples describing cardiac electrical properties. muView combines a suite of visual analysis methods to explore the area surrounding the ischemic zone and identify how perturbations of variables changes the propagation of their effects.


P. Rosen. “A Visual Approach to Investigating Shared and Global Memory Behavior of CUDA Kernels,” In Computer Graphics Forum, Vol. 32, No. 3, Wiley-Blackwell, pp. 161--170. June, 2013.
DOI: 10.1111/cgf.12103

ABSTRACT

We present an approach to investigate the memory behavior of a parallel kernel executing on thousands of threads simultaneously within the CUDA architecture. Our top-down approach allows for quickly identifying any significant differences between the execution of the many blocks and warps. As interesting warps are identified, we allow further investigation of memory behavior by visualizing the shared memory bank conflicts and global memory coalescence, first with an overview of a single warp with many operations and, subsequently, with a detailed view of a single warp and a single operation. We demonstrate the strength of our approach in the context of a parallel matrix transpose kernel and a parallel 1D Haar Wavelet transform kernel.


A. Rungta, B. Summa, D. Demir, P.-T. Bremer, V. Pascucci. “ManyVis: Multiple Applications in an Integrated Visualization Environment,” In IEEE Transactions on Visualization and Computer Graphics (TVCG), Vol. 19, No. 12, pp. 2878--2885. December, 2013.

ABSTRACT

As the visualization field matures, an increasing number of general toolkits are developed to cover a broad range of applications. However, no general tool can incorporate the latest capabilities for all possible applications, nor can the user interfaces and workflows be easily adjusted to accommodate all user communities. As a result, users will often chose either substandard solutions presented in familiar, customized tools or assemble a patchwork of individual applications glued through ad-hoc scripts and extensive, manual intervention. Instead, we need the ability to easily and rapidly assemble the best-in-task tools into custom interfaces and workflows to optimally serve any given application community. Unfortunately, creating such meta-applications at the API or SDK level is difficult, time consuming, and often infeasible due to the sheer variety of data models, design philosophies, limits in functionality, and the use of closed commercial systems. In this paper, we present the ManyVis framework which enables custom solutions to be built both rapidly and simply by allowing coordination and communication across existing unrelated applications. ManyVis allows users to combine software tools with complementary characteristics into one virtual application driven by a single, custom-designed interface.


N. Sadeghi, M.W. Prastawa, P.T. Fletcher, C. Vachet, Bo Wang, J.H. Gilmore, G. Gerig. “Multivariate Modeling of Longitudinal MRI in Early Brain Development with Confidence Measures,” In Proceedings of the 2013 IEEE 10th International Symposium on Biomedical Imaging (ISBI), pp. 1400--1403. 2013.
DOI: 10.1109/ISBI.2013.6556795

ABSTRACT

The human brain undergoes rapid organization and structuring early in life. Longitudinal imaging enables the study of these changes over a developmental period within individuals through estimation of population growth trajectory and its variability. In this paper, we focus on maturation of white and gray matter as is depicted in structural and diffusion MRI of healthy subjects with repeated scans. We provide a framework for joint analysis of both structural MRI and DTI (Diffusion Tensor Imaging) using multivariate nonlinear mixed effect modeling of temporal changes. Our framework constructs normative growth models for all the modalities that take into account the correlation among the modalities and individuals, along with estimation of the variability of the population trends. We apply our method to study early brain development, and to our knowledge this is the first multimodel longitudinal modeling of diffusion and signal intensity changes for this growth stage. Results show the potential of our framework to study growth trajectories, as well as neurodevelopmental disorders through comparison against the constructed normative models of multimodal 4D MRI.


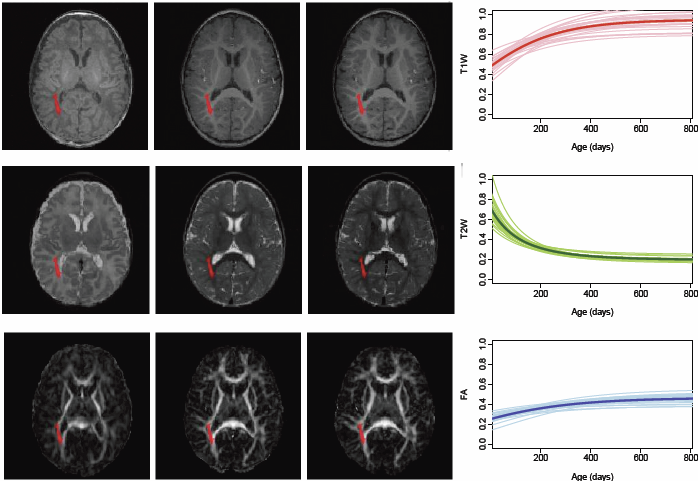
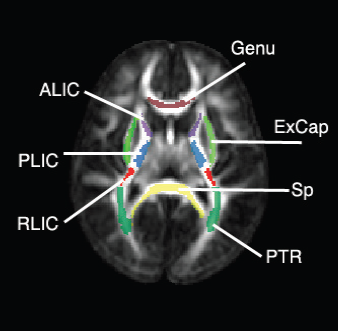
N. Sadeghi, M.W. Prastawa, P.T. Fletcher, J. Wolff, J.H. Gilmore, G. Gerig. “Regional characterization of longitudinal DT-MRI to study white matter maturation of the early developing brain,” In NeuroImage, Vol. 68, pp. 236--247. March, 2013.
DOI: 10.1016/j.neuroimage.2012.11.040
PubMed ID: 23235270

ABSTRACT

The human brain undergoes rapid and dynamic development early in life. Assessment of brain growth patterns relevant to neurological disorders and disease requires a normative population model of growth and variability in order to evaluate deviation from typical development. In this paper, we focus on maturation of brain white matter as shown in diffusion tensor MRI (DT-MRI), measured by fractional anisotropy (FA), mean diffusivity (MD), as well as axial and radial diffusivities (AD, RD). We present a novel methodology to model temporal changes of white matter diffusion from longitudinal DT-MRI data taken at discrete time points. Our proposed framework combines nonlinear modeling of trajectories of individual subjects, population analysis, and testing for regional differences in growth pattern. We first perform deformable mapping of longitudinal DT-MRI of healthy infants imaged at birth, 1 year, and 2 years of age, into a common unbiased atlas. An existing template of labeled white matter regions is registered to this atlas to define anatomical regions of interest. Diffusivity properties of these regions, presented over time, serve as input to the longitudinal characterization of changes. We use non-linear mixed effect (NLME) modeling where temporal change is described by the Gompertz function. The Gompertz growth function uses intuitive parameters related to delay, rate of change, and expected asymptotic value; all descriptive measures which can answer clinical questions related to quantitative analysis of growth patterns. Results suggest that our proposed framework provides descriptive and quantitative information on growth trajectories that can be interpreted by clinicians using natural language terms that describe growth. Statistical analysis of regional differences between anatomical regions which are known to mature differently demonstrates the potential of the proposed method for quantitative assessment of brain growth and differences thereof. This will eventually lead to a prediction of white matter diffusion properties and associated cognitive development at later stages given imaging data at early stages.


N. Sadeghi, C. Vachet, M. Prastawa, J. Korenberg, G. Gerig. “Analysis of Diffusion Tensor Imaging for Subjects with Down Syndrome,” In Proceedings of the 19th Annual Meeting of the Organization for Human Brain Mapping OHBM, pp. (in print). 2013.

ABSTRACT

Down syndrome (DS) is the most common chromosome abnormality in humans. It is typically associated with delayed cognitive development and physical growth. DS is also associated with Alzheimer-like dementia [1]. In this study we analyze the white matter integrity of individuals with DS compared to control as is reflected in the diffusion parameters derived from Diffusion Tensor Imaging. DTI provides relevant information about the underlying tissue, which correlates with cognitive function [2]. We present a cross-sectional analysis of white matter tracts of subjects with DS compared to control.


N. Sadeghi. “Modeling and Analysis of Longitudinal Multimodal Magnetic Resonance Imaging: Application to Early Brain Development,” Note: Ph.D. Thesis, Department of Bioengineering, University of Utah, December, 2013.

ABSTRACT

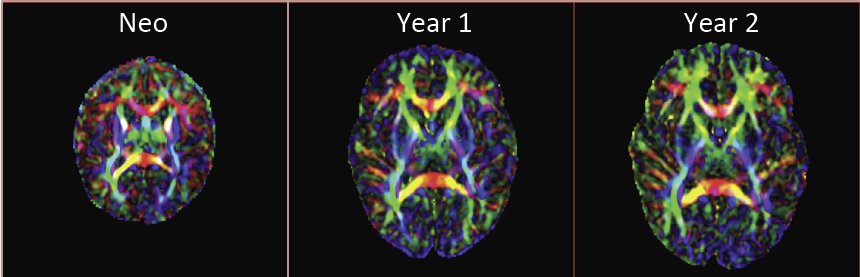
Many mental illnesses are thought to have their origins in early stages of development, encouraging increased research efforts related to early neurodevelopment. Magnetic resonance imaging (MRI) has provided us with an unprecedented view of the brain in vivo. More recently, diffusion tensor imaging (DTI/DT-MRI), a magnetic resonance imaging technique, has enabled the characterization of the microstrucutral organization of tissue in vivo. As the brain develops, the water content in the brain decreases while protein and fat content increases due to processes such as myelination and axonal organization. Changes of signal intensity in structural MRI and diffusion parameters of DTI reflect these underlying biological changes.

Longitudinal neuroimaging studies provide a unique opportunity for understanding brain maturation by taking repeated scans over a time course within individuals. Despite the availability of detailed images of the brain, there has been little progress in accurate modeling of brain development or creating predictive models of structure that could help identify early signs of illness. We have developed methodologies for the nonlinear parametric modeling of longitudinal structural MRI and DTI changes over the neurodevelopmental period to address this gap. This research provides a normative model of early brain growth trajectory as is represented in structural MRI and DTI data, which will be crucial to understanding the timing and potential mechanisms of atypical development. Growth trajectories are described via intuitive parameters related to delay, rate of growth and expected asymptotic values, all descriptive measures that can answer clinical questions related to quantitative analysis of growth patterns. We demonstrate the potential of the framework on two clinical studies: healthy controls (singletons and twins) and children at risk of autism. Our framework is designed not only to provide qualitative comparisons, but also to give researchers and clinicians quantitative parameters and a statistical testing scheme. Moreover, the method includes modeling of growth trajectories of individuals, resulting in personalized profiles. The statistical framework also allows for prediction and prediction intervals for subject-specific growth trajectories, which will be crucial for efforts to improve diagnosis for individuals and personalized treatment.

Keywords: autism, brain development, image analysis


Nazmus Saquib. “Visualizing Intrinsic Isosurface Variation due to Uncertainty Through Heat Kernel Signatures,” Note: Master of Science Thesis, Computational Engineering and Science (CES) Program, University of Utah School of Computing, 2013.

ABSTRACT

It is common to extract isosurfaces from simulation field data to visualize and gain understanding of the underlying physical phenomenon being simulated. As the input parameters of the simulation change, the resulting isosurface varies, and there has been increased interest in quantifying and visualization of these variations as part of the larger interest in uncertainty quantification. In this thesis, we propose an analysis and visualization pipeline for examining the intrinsic variation in isosurfaces caused by simulation parameter perturbation. Drawing inspiration from the shape modeling community, we incorporate the use of heat-kernel signatures (HKS) with a simple finite-difference approach for quantifying the degree to which a region (or even a point) on an isosurface has undergone intrinsic change. Coupled with a clustering technique and the use of color maps, our pipeline allows the user to select the level of fidelity with which they wish to evaluate and visualize the amount of intrinsic change. The pipeline is described with a simple example to walk the reader through the different steps, and experimental validation of parameter choices in the pipeline is provided to justify our design. Then we present canonical and simulation examples to demonstrate the pipeline's use in different applications.


M. Schott, T. Martin, A.V.P. Grosset, S.T. Smith, C.D. Hansen. “Ambient Occlusion Effects for Combined Volumes and Tubular Geometry,” In IEEE Transactions on Visualization and Computer Graphics (TVCG), Vol. 19, No. 6, Note: Selected as Spotlight paper for June 2013 issue, pp. 913--926. 2013.
DOI: 10.1109/TVCG.2012.306

ABSTRACT

This paper details a method for interactive direct volume rendering that computes ambient occlusion effects for visualizations that combine both volumetric and geometric primitives, specifically tube shaped geometric objects representing streamlines, magnetic field lines or DTI fiber tracts. The algorithm extends the recently presented Directional Occlusion Shading model to allow the rendering of those geometric shapes in combination with a context providing 3D volume, considering mutual occlusion between structures represented by a volume or geometry. Stream tube geometries are computed using an effective spline based interpolation and approximation scheme that avoids self intersection and maintains coherent orientation of the stream tube segments to avoid surface deforming twists. Furthermore, strategies to reduce the geometric and specular aliasing of the stream tubes are discussed.

Keywords: Volume rendering, ambient occlusion, stream tubes


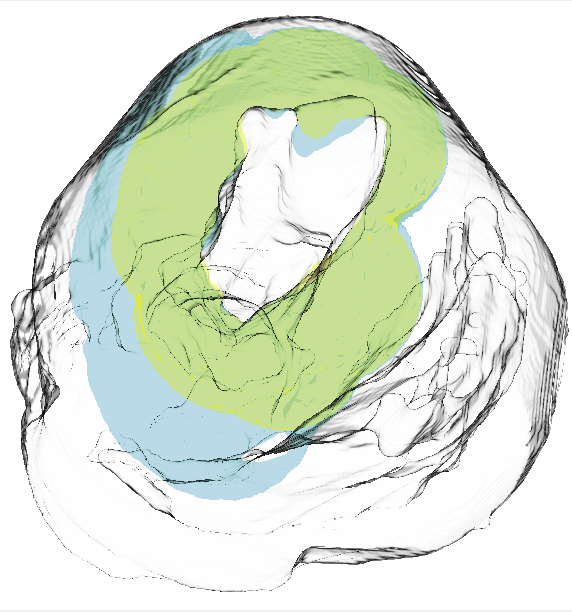
P.T. Scheffel, H.B. Henninger, R.T. Burks. “Relationship of the intercondylar roof and the tibial footprint of the ACL: implications for ACL reconstruction,” In American Journal of Sports Medicine, Vol. 41, No. 2, pp. 396--401. 2013.
DOI: 10.1177/0363546512467955

ABSTRACT

Background: Debate exists on the proper relation of the anterior cruciate ligament (ACL) footprint with the intercondylar notch in anatomic ACL reconstructions. Patient-specific graft placement based on the inclination of the intercondylar roof has been proposed. The relationship between the intercondylar roof and native ACL footprint on the tibia has not previously been quantified.

Hypothesis: No statistical relationship exists between the intercondylar roof angle and the location of the native footprint of the ACL on the tibia.

Study Design: Case series; Level of evidence, 4.

Methods: Knees from 138 patients with both lateral radiographs and MRI, without a history of ligamentous injury or fracture, were reviewed to measure the intercondylar roof angle of the femur. Roof angles were measured on lateral radiographs. The MRI data of the same knees were analyzed to measure the position of the central tibial footprint of the ACL (cACL). The roof angle and tibial footprint were evaluated to determine if statistical relationships existed.

Results: Patients had a mean ± SD age of 40 ± 16 years. Average roof angle was 34.7° ± 5.2° (range, 23°-48°; 95% CI, 33.9°-35.5°), and it differed by sex but not by side (right/left). The cACL was 44.1% ± 3.4% (range, 36.1%-51.9%; 95% CI, 43.2%-45.0%) of the anteroposterior length of the tibia. There was only a weak correlation between the intercondylar roof angle and the cACL (R = 0.106). No significant differences arose between subpopulations of sex or side.

Conclusion: The tibial footprint of the ACL is located in a position on the tibia that is consistent and does not vary according to intercondylar roof angle. The cACL is consistently located between 43.2% and 45.0% of the anteroposterior length of the tibia. Intercondylar roof–based guidance may not predictably place a tibial tunnel in the native ACL footprint. Use of a generic ACL footprint to place a tibial tunnel during ACL reconstruction may be reliable in up to 95% of patients.