


SCI Publications
2012


A. Barg, G.I. Pagenstert, A.G. Leumann, A.M. Müller, H.B. Henninger, V. Valderrabano.
“Treatment of the Arthritic Valgus Ankle,” In Foot and Ankle Clinics, Vol. 17, No. 4, pp. 647--663. 2012.
DOI: 10.1016/j.fcl.2012.08.007
A. Barg, M.D. Harris, H.B. Henninger, R.L. Amendola, C.L. Saltzman, B. Hintermann, A.E. Anderson.
“Medial distal tibial angle: comparison between weightbearing mortise view and hindfoot alignment view,” In Foot & Ankle International, Vol. 33, No. 8, pp. 655--661. 2012.
DOI: 10.3113/FAI.2012.0655
Background: The medial distal tibial angle (MDTA) is used to determine ankle alignment. The mortise view is the standard to measure MDTA, but the hindfoot alignment view (HAV) has become popular. The MDTA may vary between views, influencing the choice of surgery.
Methods: The MDTA was compared between the mortise and HAV in 146 ankles. MDTA was correlated to age and sagittal tibial tilt for each view. Differences in MDTA by gender and ethnicity were assessed. Diagnostic agreement (varus, valgus, normal) between views was calculated. Clinical assessment of alignment was determined and percent agreement between clinical and radiographic alignment was quantified.
Results: The MDTA measured from the mortise view and HAV radiographs was 89.0 (range, 81 to 96 degrees; SD = 2.8) degrees and 86.0 (range, 73 to 95 degrees; SD = 3.5) degrees, respectively. The MDTA was comparable for both genders for mortise (p = 0.356) and HAV (p = 0.621). The MDTA was comparable in all ethnic groups for mortise view (p = 0.616) and HAV (p = 0.916). Correlation between the measured MDTA and age was not statistically significant for both the mortise (r = 0.118; p = 0.158) and HAV (r = 0.148; p = 0.074). In only 47.3% of all ankles was the radiographic diagnosis of alignment the same between views. Agreement between clinical and radiographic classifications was 60.3% for the mortise view and 52.8% for the HAV.
Conclusion: Substantial disagreement in primary alignment was found between the mortise and HAV as quantified by the MDTA. Agreement between clinical and radiographic alignment was also poor. Clinical Relevance: Advanced imaging such as CT or MRI may better describe ankle alignment.
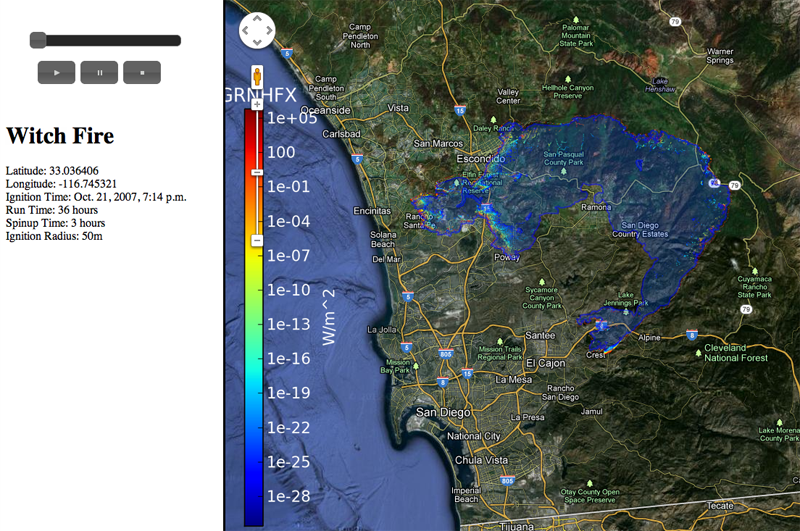
J. Beezley, M. Martin, P. Rosen, J. Mandel, A. Kochanski.
“Data management and analysis with WRF and SFIRE,” In Proceedings of the IEEE International Geoscience and Remote Sensing Symposium, Note: UCD CCM Report 312, 2012.
J.C. Bennett, H. Abbasi, P. Bremer, R.W. Grout, A. Gyulassy, T. Jin, S. Klasky, H. Kolla, M. Parashar, V. Pascucci, P. Pbay, D. Thompson, H. Yu, F. Zhang, J. Chen.
“Combining In-Situ and In-Transit Processing to Enable Extreme-Scale Scientific Analysis,” In ACM/IEEE International Conference for High Performance Computing, Networking, Storage, and Analysis (SC), Salt Lake City, Utah, U.S.A., November, 2012.
M. Berzins.
“Status of Release of the Uintah Computational Framework,” SCI Technical Report, No. UUSCI-2012-001, SCI Institute, University of Utah, 2012.
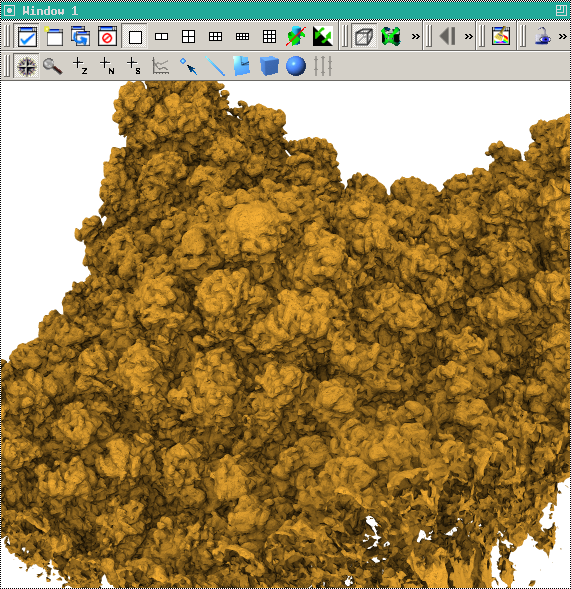
This report provides a summary of the status of the Uintah Computation Framework (UCF) software. Uintah is uniquely equipped to tackle large-scale multi-physics science and engineering problems on disparate length and time scales. The Uintah framework makes it possible to run adaptive computations on modern HPC architectures with tens and now hundreds of thousands of cores with complex communication/memory hierarchies. Uintah was orignally developed in the University of Utah Center for Simulation of Accidental Fires and Explosions (C-SAFE), a DOE-funded academic alliance project and then extended to the broader NSF snd DOE science and engineering communities. As Uintah is applicable to a wide range of engineering problems that involve fl uid-structure interactions with highly deformable structures it is used for a number of NSF-funded and DOE engineering projects. In this report the Uintah framework software is outlined and typical applications are illustrated. Uintah is open-source software that is available through the MIT open-source license at http://www.uintah.utah.edu/.
M. Berzins, Q. Meng, J. Schmidt, J.C. Sutherland.
“DAG-Based Software Frameworks for PDEs,” In Proceedings of Euro-Par 2011 Workshops, Part I, Lecture Notes in Computer Science (LNCS) 7155, Springer-Verlag Berlin Heidelberg, pp. 324--333. August, 2012.
The task-based approach to software and parallelism is well-known and has been proposed as a potential candidate, named the silver model, for exascale software. This approach is not yet widely used in the large-scale multi-core parallel computing of complex systems of partial differential equations. After surveying task-based approaches we investigate how well the Uintah software and an extension named Wasatch fit in the task-based paradigm and how well they perform on large scale parallel computers. The conclusion is that these approaches show great promise for petascale but that considerable algorithmic challenges remain.
Keywords: DOD, Uintah, CSAFE
A. Bhatele, T. Gamblin, S.H. Langer, P.-T. Bremer, E.W. Draeger, B. Hamann, K.E. Isaacs, A.G. Landge, J.A. Levine, V. Pascucci, M. Schulz, C.H. Still.
“Mapping applications with collectives over sub-communicators on torus networks,” In Proceedings of Supercomputing 2012, pp. 1--11. 2012.
DOI: 10.1109/SC.2012.75
The placement of tasks in a parallel application on specific nodes of a supercomputer can significantly impact performance. Traditionally, this task mapping has focused on reducing the distance between communicating tasks on the physical network. This minimizes the number of hops that point-to-point messages travel and thus reduces link sharing between messages and contention. However, for applications that use collectives over sub-communicators, this heuristic may not be optimal. Many collectives can benefit from an increase in bandwidth even at the cost of an increase in hop count, especially when sending large messages. For example, placing communicating tasks in a cube configuration rather than a plane or a line on a torus network increases the number of possible paths messages might take. This increases the available bandwidth which can lead to significant performance gains.
We have developed Rubik, a tool that provides a simple and intuitive interface to create a wide variety of mappings for structured communication patterns. Rubik supports a number of elementary operations such as splits, tilts, or shifts, that can be combined into a large number of unique patterns. Each operation can be applied to disjoint groups of processes involved in collectives to increase the effective bandwidth. We demonstrate the use of Rubik for improving performance of two parallel codes, pF3D and Qbox, which use collectives over sub-communicators.
C. Brownlee, T. Fogal, C.D. Hansen.
“GLuRay: Ray Tracing in Scientific Visualization Applications using OpenGL Interception,” In Proceedings of the Eurographics Symposium on Parallel Graphics and Visualization (2012), Edited by H. Childs and T. Kuhlen and F. Marton, pp. 41--50. 2012.
DOI: 10.2312/EGPGV/EGPGV12/041-050

Keywords: kaust, scidac
C. Brownlee, J. Patchett, L.-T. Lo, D. DeMarle, C. Mitchell, J. Ahrens, C.D. Hansen.
“A Study of Ray Tracing Large-scale Scientific Data in Parallel Visualization Applications,” In Proceedings of the Eurographics Symposium on Parallel Graphics and Visualization (2012), Edited by H. Childs and T. Kuhlen and F. Marton, pp. 51--60. 2012.
Keywords: kaust, scidac
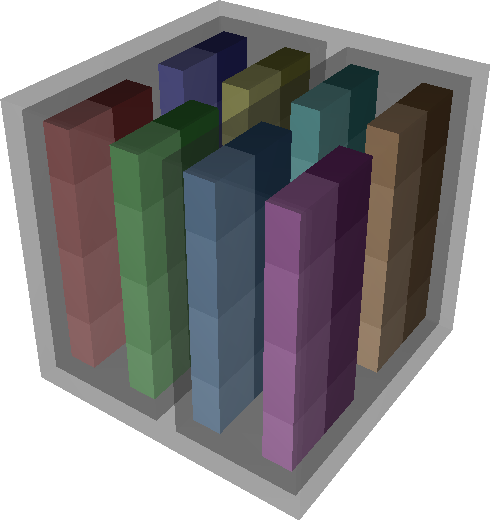
J.R. Bronson, J.A. Levine, R.T. Whitaker.
“Lattice Cleaving: Conforming Tetrahedral Meshes of Multimaterial Domains with Bounded Quality,” In Proceedings of the 21st International Meshing Roundtable, pp. 191--209. 2012.

J.R. Bronson, J.A. Levine, R.T. Whitaker.
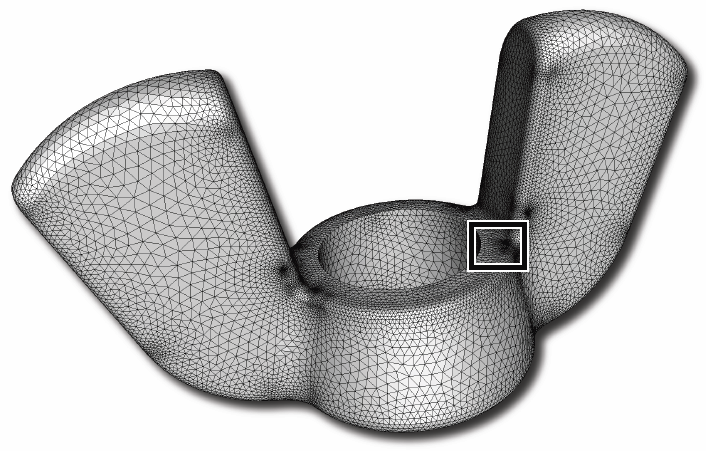
“Particle Systems for Adaptive, Isotropic Meshing of CAD Models,” In Engineering with Computers, Vol. 28, No. 4, pp. 331--344. 2012.
PubMed ID: 23162181
PubMed Central ID: PMC3499137
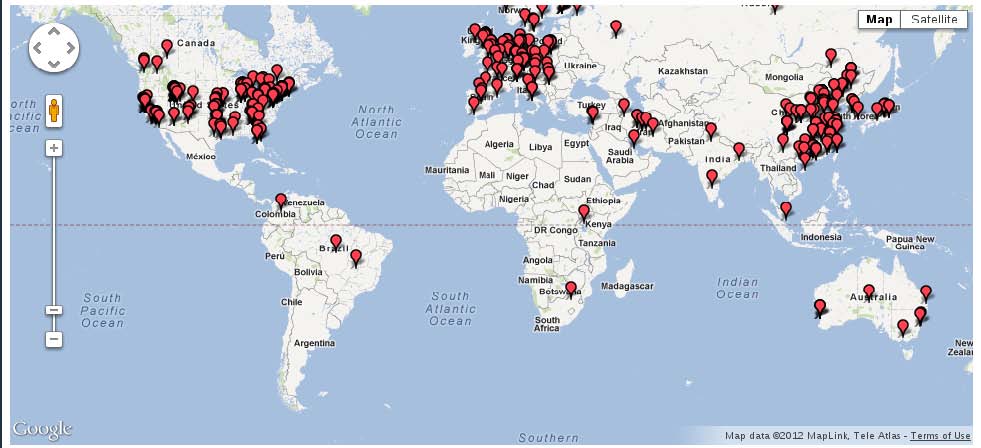
C. Butson, G. Tamm, S. Jain, T. Fogal, J. Krüger.
“Evaluation of Interactive Visualization on Mobile Computing Platforms for Selection of Deep Brain Stimulation Parameters,” In IEEE Transactions on Visualization and Computer Graphics, pp. (accepted). 2012.
ISSN: 1077-2626
DOI: 10.1109/TVCG.2012.92
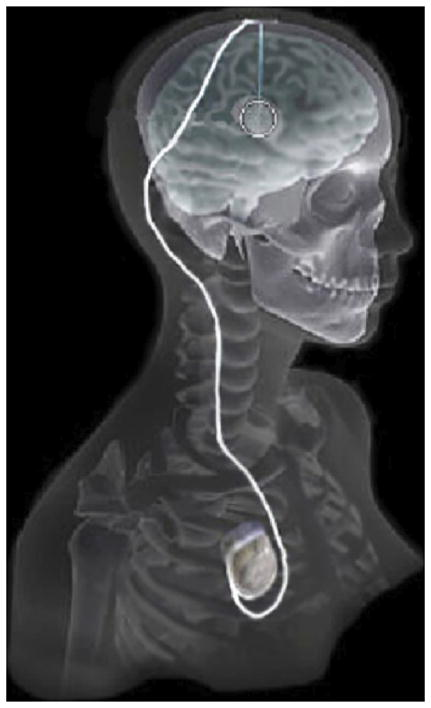
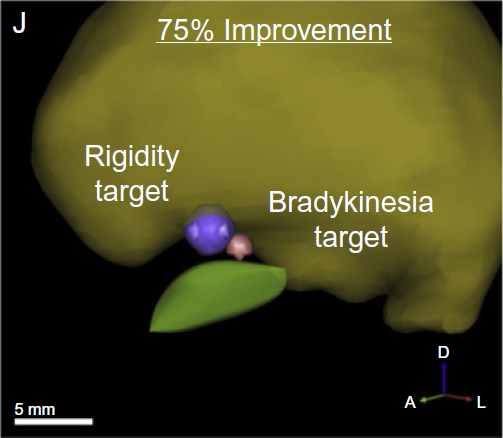
In recent years there has been significant growth in the use of patient-specific models to predict the effects of deep brain stimulation (DBS). However, translating these models from a research environment to the everyday clinical workflow has been a challenge. In this paper, we deploy the interactive visualization system ImageVis3D Mobile in an evaluation environment to visualize models of Parkinson’s disease patients who received DBS therapy. We used ImageVis3D Mobile to provide models to movement disorders clinicians and asked them to use the software to determine: 1) which of the four DBS electrode contacts they would select for therapy; and 2) what stimulation settings they would choose. We compared the stimulation protocol chosen from the software versus the stimulation protocol that was chosen via clinical practice (independently of the study). Lastly, we compared the amount of time required to reach these settings using the software versus the time required through standard practice. We found that the stimulation settings chosen using ImageVis3D Mobile were similar to those used in standard of care, but were selected in drastically less time. We show how our visualization system can be used to guide clinical decision making for selection of DBS settings.
Keywords: scidac, dbs
C.R. Butson.
“Computational Models of Neuromodulation,” In Emerging Horizons in Neuromodulation, Edited by Elena Moro and Clement Hamani, Academic Press, pp. 5--22. 2012.
ISBN: 978012404706
C. Cascio, M.J. Gribbin, S. Gouttard, R.G. Smith, M. Jomier, S.H. Field, M. Graves, H.C. Hazlett, K. Muller, G. Gerig, J. Piven.
“Fractional Anisotropy Distributions in 2-6 Year-Old Children with Autism,” In Journal of Intellectual Disability Research (JIDR), pp. (in print). 2012.
Background: Increasing evidence suggests that autism is a disorder of distributed neural networks that may exhibit abnormal developmental trajectories. Characterization of white matter early in the developmental course of the disorder is critical to understanding these aberrant trajectories.
Methods: A cross-sectional study of 2-6 year old children with autism was conducted using diffusion tensor imaging combined with a novel statistical approach employing fractional anisotropy distributions. 58 children aged 18-79 months were imaged: 33 were diagnosed with autism, 8 with general developmental delay (DD), and 17 were typically developing (TD). Fractional anisotropy values within global white matter, cortical lobes, and the cerebellum were measured and transformed to random F distributions for each subject. Each distribution of values for a region was summarized by estimating delta, the estimated mean and standard deviation of the approximating F for each distribution.
Results: The estimated delta parameter, delta-hat, was significantly decreased in individuals with autism compared to the combined control group. This was true in all cortical lobes, as well as in the cerebellum, but differences were strongest in the temporal lobe. Predicted developmental trajectories of delta-hat across the age range in the sample showed patterns that partially distinguished the groups. Exploratory analyses suggested that the variability, rather than the central tendency, component of delta-hat was the driving force behind these results. Conclusions: White matter in young children with autism appears to be abnormally homogeneous, which may reflect poorly organized or differentiated pathways, particularly in the temporal lobe, which is important for social and emotional cognition.
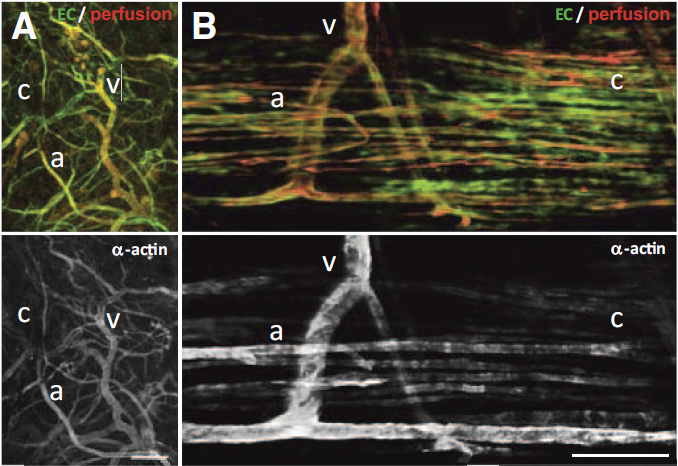
C.C. Chang, L. Krishnan, S.S. Nunes, K.H. Church, L.T. Edgar, E.D. Boland, J.A. Weiss, S.K. Williams, J.B. Hoying.
“Determinants of microvascular network topology in implanted neovasculatures,” In Arteriosclerosis, Thrombosis, and Vascular Biology, Vol. 32, No. 1, pp. 5--14. 2012.
DOI: 10.1161/ATVBAHA.111.238725
Objective
During neovascularization, the end result is a new functional microcirculation composed of a network of mature microvessels with specific topologies. Although much is known concerning the mechanisms underlying the initiation of angiogenesis, it remains unclear how the final architecture of microcirculatory beds is regulated. To begin to address this, we determined the impact of angiogenic neovessel prepatterning on the final microvascular network topology using a model of implant neovascularization.
Methods and Results
We used 3D direct-write bioprinting or physical constraints in a manner permitting postangiogenesis vascular remodeling and adaptation to pattern angiogenic microvascular precursors (neovessels formed from isolated microvessel segments) in 3D collagen gels before implantation and subsequent network formation. Neovasculatures prepatterned into parallel arrays formed functional networks after 4 weeks postimplantation but lost the prepatterned architecture. However, maintenance of uniaxial physical constraints during postangiogenesis remodeling of the implanted neovasculatures produced networks with aligned microvessels, as well as an altered proportional distribution of arterioles, capillaries, and venules.
Conclusion
Here we show that network topology resulting from implanted microvessel precursors is independent from prepatterning of precursors but can be influenced by a patterning stimulus involving tissue deformation during postangiogenesis remodeling and maturation.
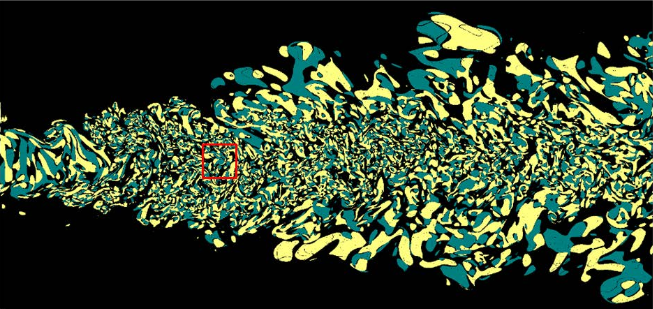
F. Chen, H. Obermaier, H. Hagen, B. Hamann, J. Tierny, V. Pascucci..
“Topology Analysis of Time-Dependent Multi-Fluid Data Using the Reeb Graph,” In Computer Aided Geometric Design, Note: Published online Apr 24., Elsevier, 2012.
DOI: 10.1016/j.cagd.2012.03.019
G. Chen, V. Kwatra, L.-Y. Wei, C.D. Hansen, E. Zhang.
“Design of 2D Time-Varying Vector Fields,” In IEEE Transactions on Visualization and Computer Graphics TVCG, Vol. 18, No. 10, pp. 1717--1730. 2012.
DOI: 10.1109/TVCG.2011.290
C.-S. Chiang, C. Hoffmann, P. Rosen.
“A Generalized Malfatti Problem,” In Computational Geometry: Theory and Applications, Vol. 45, No. 8, pp. 425--435. 2012.
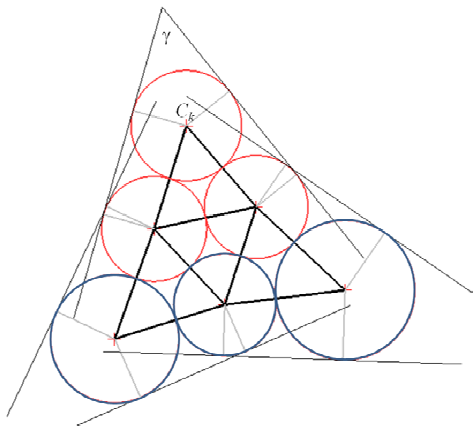
Keywords: Malfatti's problem, circle packing, geometric constraint solving, GPU programming
A.N.M. Imroz Choudhury, Bei Wang, P. Rosen, V. Pascucci.
“Topological Analysis and Visualization of Cyclical Behavior in Memory Reference Traces,” In Proceedings of the IEEE Pacific Visualization Symposium (PacificVis 2012), pp. 9--16. 2012.
DOI: 10.1109/PacificVis.2012.6183557
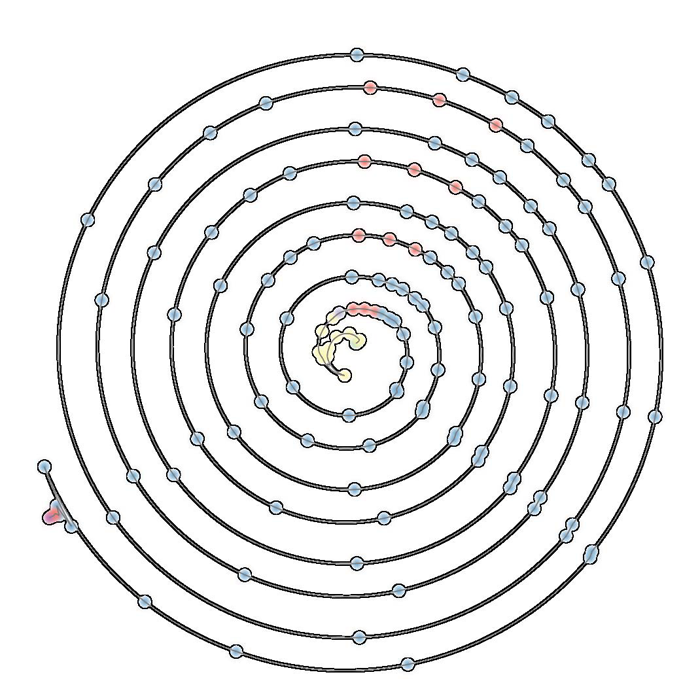
Keywords: scidac
M. Dannhauer, D.H. Brooks, D. Tucker, R.S. MacLeod.
“A pipeline for the simulation of transcranial direct current stimulation for realistic human head models using SCIRun/BioMesh3D,” In Proceedings of the 2012 IEEE Int. Conf. Engineering and Biology Society (EMBC), pp. 5486--5489. 2012.
DOI: 10.1109/EMBC.2012.6347236
PubMed ID: 23367171
PubMed Central ID: PMC3651514
