


Visualization
Visualization, sometimes referred to as visual data analysis, uses the graphical representation of data as a means of gaining understanding and insight into the data. Visualization research at SCI has focused on applications spanning computational fluid dynamics, medical imaging and analysis, biomedical data analysis, healthcare data analysis, weather data analysis, poetry, network and graph analysis, financial data analysis, etc.Research involves novel algorithm and technique development to building tools and systems that assist in the comprehension of massive amounts of (scientific) data. We also research the process of creating successful visualizations.
We strongly believe in the role of interactivity in visual data analysis. Therefore, much of our research is concerned with creating visualizations that are intuitive to interact with and also render at interactive rates.
Visualization at SCI includes the academic subfields of Scientific Visualization, Information Visualization and Visual Analytics.


Mike Kirby
Uncertainty Visualization

Alex Lex
Information Visualization
Centers and Labs:
- Visualization Design Lab (VDL)
- CEDMAV
- POWDER Display Wall
- Modeling, Display, and Understanding Uncertainty in Simulations for Policy Decision Making
- Topological Data Analysis for Large Network Visualization
Funded Research Projects:
Publications in Visualization:
|
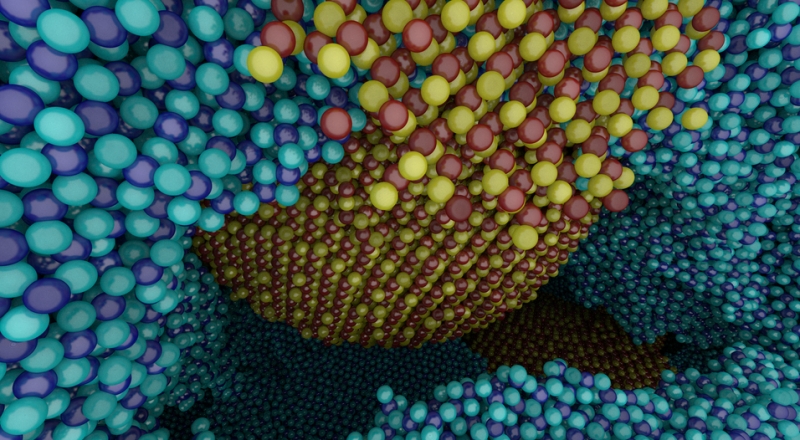
  CPU Ray Tracing Large Particle Data with Balanced P-k-d Trees I. Wald, A. Knoll, G. P. Johnson, W. Usher, V. Pascucci, M. E. Papka. In 2015 IEEE Scientific Visualization Conference, IEEE, Oct, 2015. DOI: 10.1109/scivis.2015.7429492 We present a novel approach to rendering large particle data sets from molecular dynamics, astrophysics and other sources. We employ a new data structure adapted from the original balanced k-d tree, which allows for representation of data with trivial or no overhead. In the OSPRay visualization framework, we have developed an efficient CPU algorithm for traversing, classifying and ray tracing these data. Our approach is able to render up to billions of particles on a typical workstation, purely on the CPU, without any approximations or level-of-detail techniques, and optionally with attribute-based color mapping, dynamic range query, and advanced lighting models such as ambient occlusion and path tracing. |
| Data Science: What Is It and How Is It Taught?, H. De Sterck, C.R. Johnson. In SIAM News, SIAM, July, 2015. |
Visualization C.R. Johnson, K. Potter. In The Princeton Companion to Applied Mathematics, Edited by Nicholas J. Higham, Princeton University Press, pp. 843-846. September, 2015. ISBN: 9780691150390 |
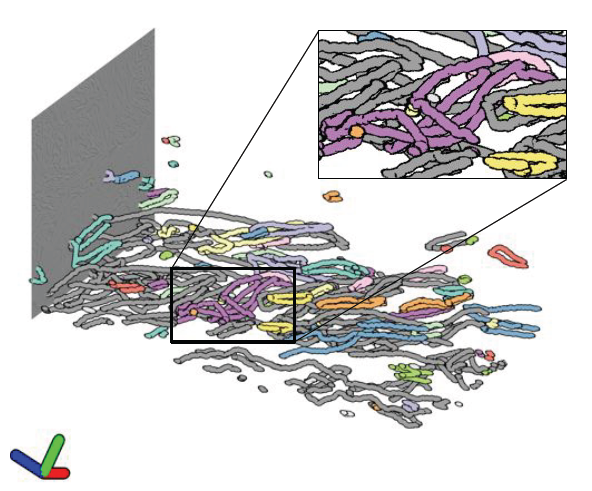
Morse-Smale Analysis of Ion Diffusion for DFT Battery Materials Simulations, A. Gyulassy, A. Knoll, K. C. Lau, Bei Wang, P. T. Bremer, M. E. Papka, L. A. Curtiss, V. Pascucci. In Topology-Based Methods in Visualization (TopoInVis), 2015. Ab initio molecular dynamics (AIMD) simulations are increasingly useful in modeling, optimizing and synthesizing materials in energy sciences. In solving Schrodinger's equation, they generate the electronic structure of the simulated atoms as a scalar field. However, methods for analyzing these volume data are not yet common in molecular visualization. The Morse-Smale complex is a proven, versatile tool for topological analysis of scalar fields. In this paper, we apply the discrete Morse-Smale complex to analysis of first-principles battery materials simulations. We consider a carbon nanosphere structure used in battery materials research, and employ Morse-Smale decomposition to determine the possible lithium ion diffusion paths within that structure. Our approach is novel in that it uses the wavefunction itself as opposed distance fields, and that we analyze the 1-skeleton of the Morse-Smale complex to reconstruct our diffusion paths. Furthermore, it is the first application where specific motifs in the graph structure of the complete 1-skeleton define features, namely carbon rings with specific valence. We compare our analysis of DFT data with that of a distance field approximation, and discuss implications on larger classical molecular dynamics simulations. |
|
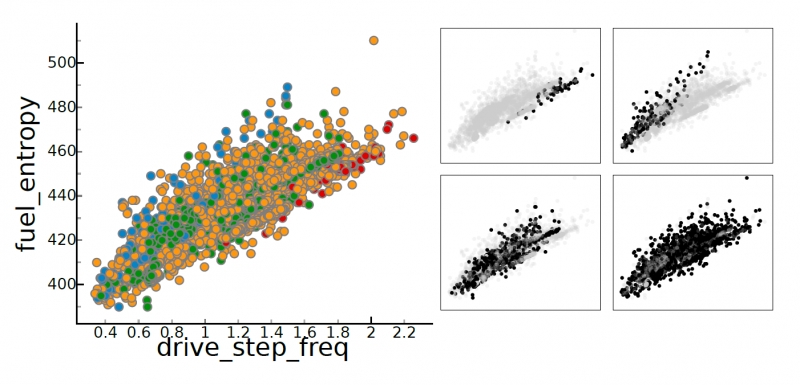
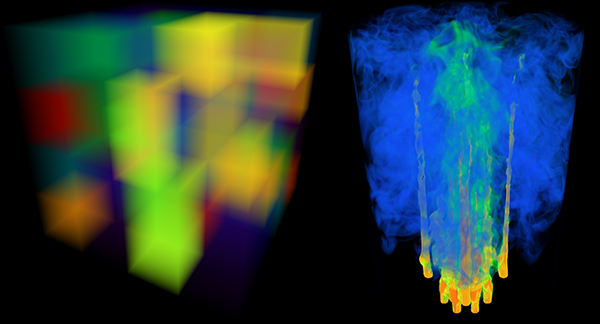
ND2AV: N-Dimensional Data Analysis and Visualization -- Analysis for the National Ignition Campaign P. T. Bremer, D. Maljovec, A. Saha, Bei Wang, J. Gaffney, B. K. Spears, V. Pascucci. In Computing and Visualization in Science, 2015. One of the biggest challenges in high-energy physics is to analyze a complex mix of experimental and simulation data to gain new insights into the underlying physics. Currently, this analysis relies primarily on the intuition of trained experts often using nothing more sophisticated than default scatter plots. Many advanced analysis techniques are not easily accessible to scientists and not flexible enough to explore the potentially interesting hypotheses in an intuitive manner. Furthermore, results from individual techniques are often difficult to integrate, leading to a confusing patchwork of analysis snippets too cumbersome for data exploration. This paper presents a case study on how a combination of techniques from statistics, machine learning, topology, and visualization can have a significant impact in the field of inertial confinement fusion. We present the ND2AV: N-Dimensional Data Analysis and Visualization framework, a user-friendly tool aimed at exploiting the intuition and current work flow of the target users. The system integrates traditional analysis approaches such as dimension reduction and clustering with state-of-the-art techniques such as neighborhood graphs and topological analysis, and custom capabilities such as defining combined metrics on the fly. All components are linked into an interactive environment that enables an intuitive exploration of a wide variety of hypotheses while relating the results to concepts familiar to the users, such as scatter plots. ND2AV uses a modular design providing easy extensibility and customization for different applications. ND2AV is being actively used in the National Ignition Campaign and has already led to a number of unexpected discoveries. |
|
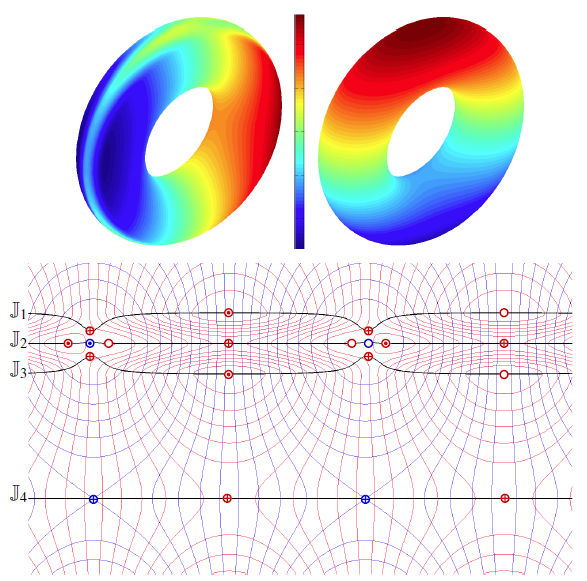
Local, Smooth, and Consistent Jacobi Set Simplification H. Bhatia, Bei Wang, G. Norgard, V. Pascucci, P. T. Bremer. In Computational Geometry, Vol. 48, No. 4, Elsevier, pp. 311-332. May, 2015. DOI: 10.1016/j.comgeo.2014.10.009 The relation between two Morse functions defined on a smooth, compact, and orientable 2-manifold can be studied in terms of their Jacobi set. The Jacobi set contains points in the domain where the gradients of the two functions are aligned. Both the Jacobi set itself as well as the segmentation of the domain it induces, have shown to be useful in various applications. In practice, unfortunately, functions often contain noise and discretization artifacts, causing their Jacobi set to become unmanageably large and complex. Although there exist techniques to simplify Jacobi sets, they are unsuitable for most applications as they lack fine-grained control over the process, and heavily restrict the type of simplifications possible. |

|
Visual Exploration of High-Dimensional Data through Subspace Analysis and Dynamic Projections S. Liu, Bei Wang, J. J. Thiagarajan, P. T. Bremer, V. Pascucci. In Computer Graphics Forum, Vol. 34, No. 3, Wiley-Blackwell, pp. 271--280. June, 2015. DOI: 10.1111/cgf.12639 We introduce a novel interactive framework for visualizing and exploring high-dimensional datasets based on subspace analysis and dynamic projections. We assume the high-dimensional dataset can be represented by a mixture of low-dimensional linear subspaces with mixed dimensions, and provide a method to reliably estimate the intrinsic dimension and linear basis of each subspace extracted from the subspace clustering. Subsequently, we use these bases to define unique 2D linear projections as viewpoints from which to visualize the data. To understand the relationships among the different projections and to discover hidden patterns, we connect these projections through dynamic projections that create smooth animated transitions between pairs of projections. We introduce the view transition graph, which provides flexible navigation among these projections to facilitate an intuitive exploration. Finally, we provide detailed comparisons with related systems, and use real-world examples to demonstrate the novelty and usability of our proposed framework. |

|
Visualizing High-Dimensional Data: Advances in the Past Decade S. Liu, D. Maljovec, Bei Wang, P. T. Bremer, V. Pascucci. In State of The Art Report, Eurographics Conference on Visualization (EuroVis), 2015. Massive simulations and arrays of sensing devices, in combination with increasing computing resources, have generated large, complex, high-dimensional datasets used to study phenomena across numerous fields of study. Visualization plays an important role in exploring such datasets. We provide a comprehensive survey of advances in high-dimensional data visualization over the past 15 years. We aim at providing actionable guidance for data practitioners to navigate through a modular view of the recent advances, allowing the creation of new visualizations along the enriched information visualization pipeline and identifying future opportunities for visualization research. |
|
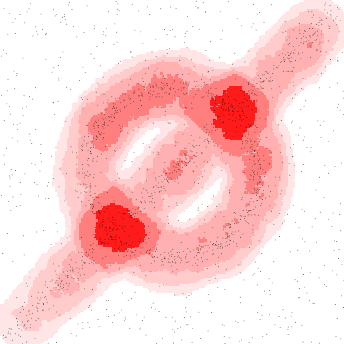
Geometric Inference on Kernel Density Estimates J. M. Phillips, Bei Wang, Y. Zheng. In CoRR, Vol. abs/1307.7760, 2015. We show that geometric inference of a point cloud can be calculated by examining its kernel density estimate with a Gaussian kernel. This allows one to consider kernel density estimates, which are robust to spatial noise, subsampling, and approximate computation in comparison to raw point sets. This is achieved by examining the sublevel sets of the kernel distance, which isomorphically map to superlevel sets of the kernel density estimate. We prove new properties about the kernel distance, demonstrating stability results and allowing it to inherit reconstruction results from recent advances in distance-based topological reconstruction. Moreover, we provide an algorithm to estimate its topology using weighted Vietoris-Rips complexes. |
|
Robustness-Based Simplification of 2D Steady and Unsteady Vector Fields P. Skraba, Bei Wang, G. Chen, P. Rosen. In IEEE Transactions on Visualization and Computer Graphics (to appear), 2015. Vector field simplification aims to reduce the complexity of the flow by removing features in order of their relevance and importance, to reveal prominent behavior and obtain a compact representation for interpretation. Most existing simplification techniques based on the topological skeleton successively remove pairs of critical points connected by separatrices, using distance or area-based relevance measures. These methods rely on the stable extraction of the topological skeleton, which can be difficult due to instability in numerical integration, especially when processing highly rotational flows. In this paper, we propose a novel simplification scheme derived from the recently introduced topological notion of robustness which enables the pruning of sets of critical points according to a quantitative measure of their stability, that is, the minimum amount of vector field perturbation required to remove them. This leads to a hierarchical simplification scheme that encodes flow magnitude in its perturbation metric. Our novel simplification algorithm is based on degree theory and has minimal boundary restrictions. Finally, we provide an implementation under the piecewise-linear setting and apply it to both synthetic and real-world datasets. We show local and complete hierarchical simplifications for steady as well as unsteady vector fields. |
|
TOD-Tree: Task-Overlapped Direct send Tree Image Compositing for Hybrid MPI Parallelism A. V. P. Grosset, M. Prasad, C. Christensen, A. Knoll, C. Hansen. In Eurographics Symposium on Parallel Graphics and Visualization (2015), Edited by C. Dachsbacher, P. Navrátil, 2015. Modern supercomputers have very powerful multi-core CPUs. The programming model on these supercomputer is switching from pure MPI to MPI for inter-node communication, and shared memory and threads for intra-node communication. Consequently the bottleneck in most systems is no longer computation but communication between nodes. In this paper, we present a new compositing algorithm for hybrid MPI parallelism that focuses on communication avoidance and overlapping communication with computation at the expense of evenly balancing the workload. The algorithm has three stages: a direct send stage where nodes are arranged in groups and exchange regions of an image, followed by a tree compositing stage and a gather stage. We compare our algorithm with radix-k and binary-swap from the IceT library in a hybrid OpenMP/MPI setting, show strong scaling results and explain how we generally achieve better performance than these two algorithms. |
|
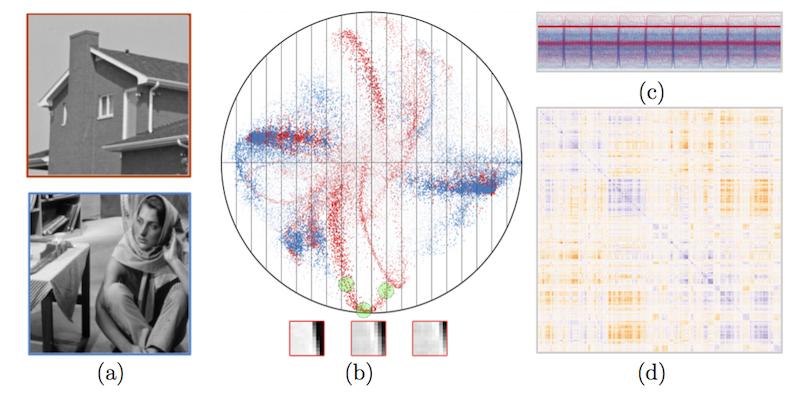
s-CorrPlot: An Interactive Scatterplot for Exploring Correlation, S. McKenna, M. Meyer, C. Gregg, S. Gerber. In Journal of Computational and Graphical Statistics, 2015. DOI: 10.1080/10618600.2015.1021926 The degree of correlation between variables is used in many data analysis applications as a key measure of interdependence. The most common techniques for exploratory analysis of pairwise correlation in multivariate datasets, like scatterplot matrices and clustered heatmaps, however, do not scale well to large datasets, either computationally or visually. We present a new visualization that is capable of encoding pairwise correlation between hundreds of thousands variables, called the s-CorrPlot. The s-CorrPlot encodes correlation spatially between variables as points on scatterplot using the geometric structure underlying Pearson's correlation. Furthermore, we extend the s-CorrPlot with interactive techniques that enable animation of the scatterplot to new projections of the correlation space, as illustrated in the companion video in Supplemental Materials. We provide the s-CorrPlot as an open-source R-package and validate its effectiveness through a variety of methods including a case study with a biology collaborator. |
|
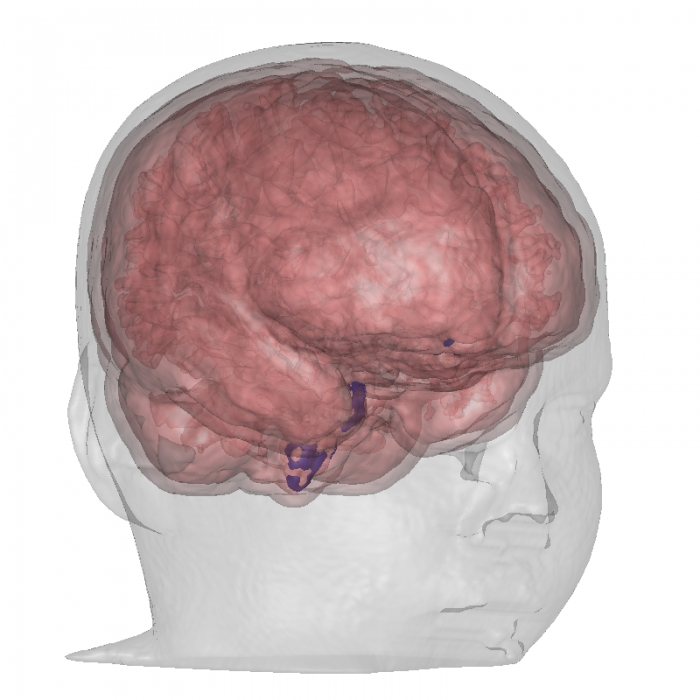
GPU Surface Extraction with the Closest Point Embedding M. Kim, C.D. Hansen. In Proceedings of IS&T/SPIE Visualization and Data Analysis, 2015, February, 2015. Isosurface extraction is a fundamental technique used for both surface reconstruction and mesh generation. One method to extract well-formed isosurfaces is a particle system; unfortunately, particle systems can be slow. In this paper, we introduce an enhanced parallel particle system that uses the closest point embedding as the surface representation to speedup the particle system for isosurface extraction. The closest point embedding is used in the Closest Point Method (CPM), a technique that uses a standard three dimensional numerical PDE solver on two dimensional embedded surfaces. To fully take advantage of the closest point embedding, it is coupled with a Barnes-Hut tree code on the GPU. This new technique produces well-formed, conformal unstructured triangular and tetrahedral meshes from labeled multi-material volume datasets. Further, this new parallel implementation of the particle system is faster than any known methods for conformal multi-material mesh extraction. The resulting speed-ups gained in this implementation can reduce the time from labeled data to mesh from hours to minutes and benefits users, such as bioengineers, who employ triangular and tetrahedral meshes. Keywords: scalar field methods, GPGPU, curvature based, scientific visualization |
|
Surface Flow Visualization using the Closest Point Embedding M. Kim, C.D. Hansen. In 2015 IEEE Pacific Visualization Symposium, April, 2015. In this paper, we introduce a novel flow visualization technique for arbitrary surfaces. This new technique utilizes the closest point embedding to represent the surface, which allows for accurate particle advection on the surface as well as supports the unsteady flow line integral convolution (UFLIC) technique on the surface. This global approach is faster than previous parameterization techniques and prevents the visual artifacts associated with image-based approaches. Keywords: vector field, flow visualization |
Topological and Statistical Methods for Complex Data, Subtitled “Tackling Large-Scale, High-Dimensional, and Multivariate Data Spaces,” J. Bennett, F. Vivodtzev, V. Pascucci (Eds.). Mathematics and Visualization, Springer Berlin Heidelberg, 2015. ISBN: 978-3-662-44899-1 This book contains papers presented at the Workshop on the Analysis of Large-scale, |
| Guided visual exploration of genomic stratifications in cancer M. Streit, A. Lex, S. Gratzl, C. Partl, D. Schmalstieg, H. Pfister, P. J. Park,, N. Gehlenborg. In Nature Methods, Vol. 11, No. 9, pp. 884--885. Sep, 2014. ISSN: 1548-7091 DOI: 10.1038/nmeth.3088 |
| UpSet: Visualization of Intersecting Sets A. Lex, N. Gehlenborg, H. Strobelt, R. Vuillemot,, H. Pfister. In IEEE Transactions on Visualization and Computer Graphics (InfoVis '14), Vol. 20, No. 12, pp. 1983--1992. 2014. ISSN: 1077-2626 Understanding relationships between sets is an important analysis task that has received widespread attention in the visualization community. The major challenge in this context is the combinatorial explosion of the number of set intersections if the number of sets exceeds a trivial threshold. In this paper we introduce UpSet, a novel visualization technique for the quantitative analysis of sets, their intersections, and aggregates of intersections. UpSet is focused on creating task-driven aggregates, communicating the size and properties of aggregates and intersections, and a duality between the visualization of the elements in a dataset and their set membership. UpSet visualizes set intersections in a matrix layout and introduces aggregates based on groupings and queries. The matrix layout enables the effective representation of associated data, such as the number of elements in the aggregates and intersections, as well as additional summary statistics derived from subset or element attributes. Sorting according to various measures enables a task-driven analysis of relevant intersections and aggregates. The elements represented in the sets and their associated attributes are visualized in a separate view. Queries based on containment in specific intersections, aggregates or driven by attribute filters are propagated between both views. We also introduce several advanced visual encodings and interaction methods to overcome the problems of varying scales and to address scalability. UpSet is web-based and open source. We demonstrate its general utility in multiple use cases from various domains. |
| ConTour: Data-Driven Exploration of Multi-Relational Datasets for Drug Discovery Christian Partl, Alexander Lex, Marc Streit, Hendrik Strobelt, Anne-Mai Wasserman, Hanspeter Pfister,, Dieter Schmalstieg. In IEEE Transactions on Visualization and Computer Graphics (VAST '14), Vol. 20, No. 12, pp. 1883--1892. 2014. ISSN: 1077-2626 DOI: 10.1109/TVCG.2014.2346752 Large scale data analysis is nowadays a crucial part of drug discovery. Biologists and chemists need to quickly explore and evaluate potentially effective yet safe compounds based on many datasets that are in relationship with each other. However, there is a lack of tools that support them in these processes. To remedy this, we developed ConTour, an interactive visual analytics technique that enables the exploration of these complex, multi-relational datasets. At its core ConTour lists all items of each dataset in a column. Relationships between the columns are revealed through interaction: selecting one or multiple items in one column highlights and re-sorts the items in other columns. Filters based on relationships enable drilling down into the large data space. To identify interesting items in the first place, ConTour employs advanced sorting strategies, including strategies based on connectivity strength and uniqueness, as well as sorting based on item attributes. ConTour also introduces interactive nesting of columns, a powerful method to show the related items of a child column for each item in the parent column. Within the columns, ConTour shows rich attribute data about the items as well as information about the connection strengths to other datasets. Finally, ConTour provides a number of detail views, which can show items from multiple datasets and their associated data at the same time. We demonstrate the utility of our system in case studies conducted with a team of chemical biologists, who investigate the effects of chemical compounds on cells and need to understand the underlying mechanisms. |
| Domino: Extracting, Comparing, and Manipulating Subsets across Multiple Tabular Datasets S. Gratzl, N. Gehlenborg, A. Lex, H. Pfister, M. Streit. In IEEE Transactions on Visualization and Computer Graphics (InfoVis '14), Vol. 20, No. 12, pp. 2023--2032. 2014. ISSN: 1077-2626 DOI: 10.1109/TVCG.2014.2346260 Answering questions about complex issues often requires analysts to take into account information contained in multiple interconnected datasets. A common strategy in analyzing and visualizing large and heterogeneous data is dividing it into meaningful subsets. Interesting subsets can then be selected and the associated data and the relationships between the subsets visualized. However, neither the extraction and manipulation nor the comparison of subsets is well supported by state-of-the-art techniques. In this paper we present Domino, a novel multiform visualization technique for effectively representing subsets and the relationships between them. By providing comprehensive tools to arrange, combine, and extract subsets, Domino allows users to create both common visualization techniques and advanced visualizations tailored to specific use cases. In addition to the novel technique, we present an implementation that enables analysts to manage the wide range of options that our approach offers. Innovative interactive features such as placeholders and live previews support rapid creation of complex analysis setups. We introduce the technique and the implementation using a simple example and demonstrate scalability and effectiveness in a use case from the field of cancer genomics. |
| Show me the Invisible: Visualizing Hidden Content T. Geymayer, M. Steinberger, A. Lex, M. Streit,, D. Schmalstieg. In Proceedings of the ACM SIGCHI Conference on Human Factors in Computing Systems (CHI '14), CHI '14, ACM, pp. 3705--3714. 2014. ISBN: 978-1-4503-2473-1 DOI: 10.1145/2556288.2557032 Content on computer screens is often inaccessible to users because it is hidden, e.g., occluded by other windows, outside the viewport, or overlooked. In search tasks, the efficient retrieval of sought content is important. Current software, however, only provides limited support to visualize hidden occurrences and rarely supports search synchronization crossing application boundaries. To remedy this situation, we introduce two novel visualization methods to guide users to hidden content. Our first method generates awareness for occluded or out-of-viewport content using see-through visualization. For content that is either outside the screen's viewport or for data sources not opened at all, our second method shows off-screen indicators and an on-demand smart preview. To reduce the chances of overlooking content, we use visual links, i.e., visible edges, to connect the visible content or the visible representations of the hidden content. We show the validity of our methods in a user study, which demonstrates that our technique enables a faster localization of hidden content compared to traditional search functionality and thereby assists users in information retrieval tasks. |