Visualization
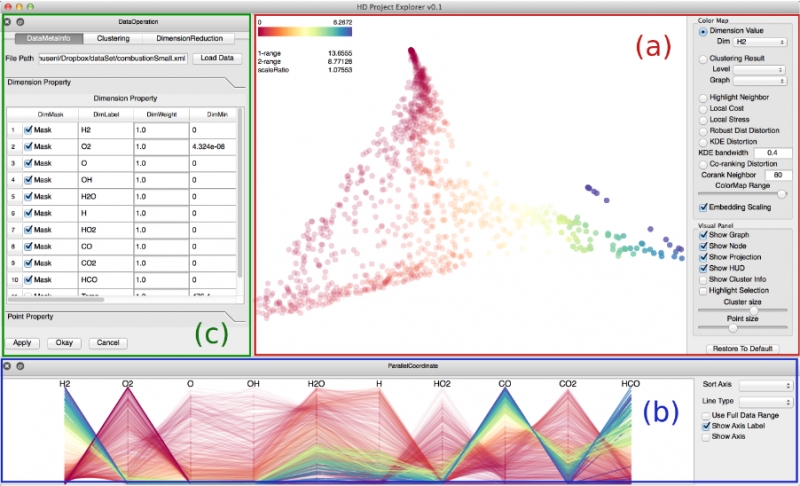
Visualization, sometimes referred to as visual data analysis, uses the graphical representation of data as a means of gaining understanding and insight into the data. Visualization research at SCI has focused on applications spanning computational fluid dynamics, medical imaging and analysis, biomedical data analysis, healthcare data analysis, weather data analysis, poetry, network and graph analysis, financial data analysis, etc.Research involves novel algorithm and technique development to building tools and systems that assist in the comprehension of massive amounts of (scientific) data. We also research the process of creating successful visualizations.
We strongly believe in the role of interactivity in visual data analysis. Therefore, much of our research is concerned with creating visualizations that are intuitive to interact with and also render at interactive rates.
Visualization at SCI includes the academic subfields of Scientific Visualization, Information Visualization and Visual Analytics.

Mike Kirby
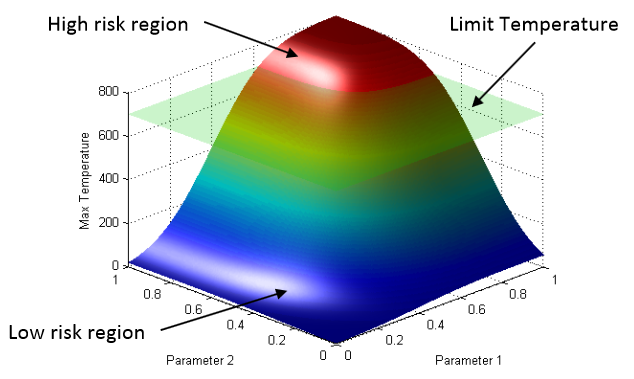
Uncertainty Visualization
Alex Lex
Information VisualizationCenters and Labs:
- Visualization Design Lab (VDL)
- CEDMAV
- POWDER Display Wall
- Modeling, Display, and Understanding Uncertainty in Simulations for Policy Decision Making
- Topological Data Analysis for Large Network Visualization
Funded Research Projects:
Publications in Visualization:
 Topological Methods in Data Analysis and Visualization III Edited by Peer-Timo Bremer and Ingrid Hotz and Valerio Pascucci and Ronald Peikert, Springer International Publishing, 2014. ISBN: 978-3-319-04099-8 |
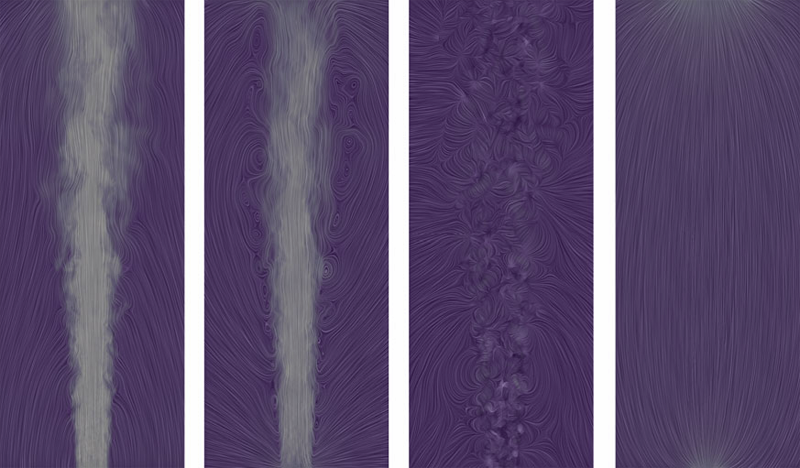
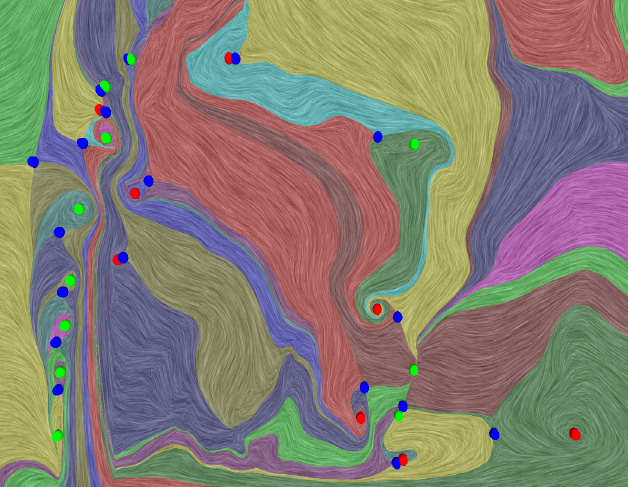
  The Natural Helmholtz-Hodge Decomposition For Open-Boundary Flow Analysis H. Bhatia, V. Pascucci, P.-T. Bremer. In IEEE Transactions on Visualization and Computer Graphics (TVCG), Vol. 99, pp. 1566--1578. 2014. DOI: 10.1109/TVCG.2014.2312012 The Helmholtz-Hodge decomposition (HHD) describes a flow as the sum of an incompressible, an irrotational, and a harmonic flow, and is a fundamental tool for simulation and analysis. Unfortunately, for bounded domains, the HHD is not uniquely defined, and traditionally, boundary conditions are imposed to obtain a unique solution. However, in general, the boundary conditions used during the simulation may not be known and many simulations use open boundary conditions. In these cases, the flow imposed by traditional boundary conditions may not be compatible with the given data, which leads to sometimes drastic artifacts and distortions in all three components, hence producing unphysical results. Instead, this paper proposes the natural HHD, which is defined by separating the flow into internal and external components. Using a completely data-driven approach, the proposed technique obtains uniqueness without assuming boundary conditions a priori. As a result, it enables a reliable and artifact-free analysis for flows with open boundaries or unknown boundary conditions. Furthermore, our approach computes the HHD on a point-wise basis in contrast to the existing global techniques, and thus supports computing inexpensive local approximations for any subset of the domain. Finally, the technique is easy to implement for a variety of spatial discretizations and interpolated fields in both two and three dimensions. |
  Extracting Features from Time-Dependent Vector Fields Using Internal Reference Frames H. Bhatia, V. Pascucci, R.M. Kirby, P.-T. Bremer. In Computer Graphics Forum, Vol. 33, No. 3, pp. 21--30. June, 2014. DOI: 10.1111/cgf.12358 Extracting features from complex, time-dependent flow fields remains a significant challenge despite substantial research efforts, especially because most flow features of interest are defined with respect to a given reference frame. Pathline-based techniques, such as the FTLE field, are complex to implement and resource intensive, whereas scalar transforms, such as λ2, often produce artifacts and require somewhat arbitrary thresholds. Both approaches aim to analyze the flow in a more suitable frame, yet neither technique explicitly constructs one. |
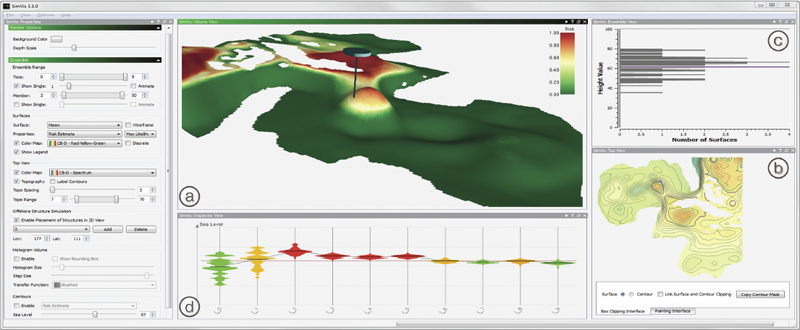
  Ovis: A Framework for Visual Analysis of Ocean Forecast Ensembles T. Hollt, A. Magdy, P. Zhan, G. Chen, G. Gopalakrishnan, I. Hoteit, C.D. Hansen, M. Hadwiger. In IEEE Transactions on Visualization and Computer Graphics (TVCG), Vol. PP, No. 99, pp. 1. 2014. DOI: 10.1109/TVCG.2014.2307892 We present a novel integrated visualization system that enables interactive visual analysis of ensemble simulations of the sea surface height that is used in ocean forecasting. The position of eddies can be derived directly from the sea surface height and our visualization approach enables their interactive exploration and analysis. The behavior of eddies is important in different application settings of which we present two in this paper. First, we show an application for interactive planning of placement as well as operation of off-shore structures using real-world ensemble simulation data of the Gulf of Mexico. Off-shore structures, such as those used for oil exploration, are vulnerable to hazards caused by eddies, and the oil and gas industry relies on ocean forecasts for efficient operations. We enable analysis of the spatial domain, as well as the temporal evolution, for planning the placement and operation of structures. Eddies are also important for marine life. They transport water over large distances and with it also heat and other physical properties as well as biological organisms. In the second application we present the usefulness of our tool, which could be used for planning the paths of autonomous underwater vehicles, so called gliders, for marine scientists to study simulation data of the largely unexplored Red Sea. Keywords: Ensemble Visualization, Ocean Visualization, Ocean Forecast, Risk Estimation |
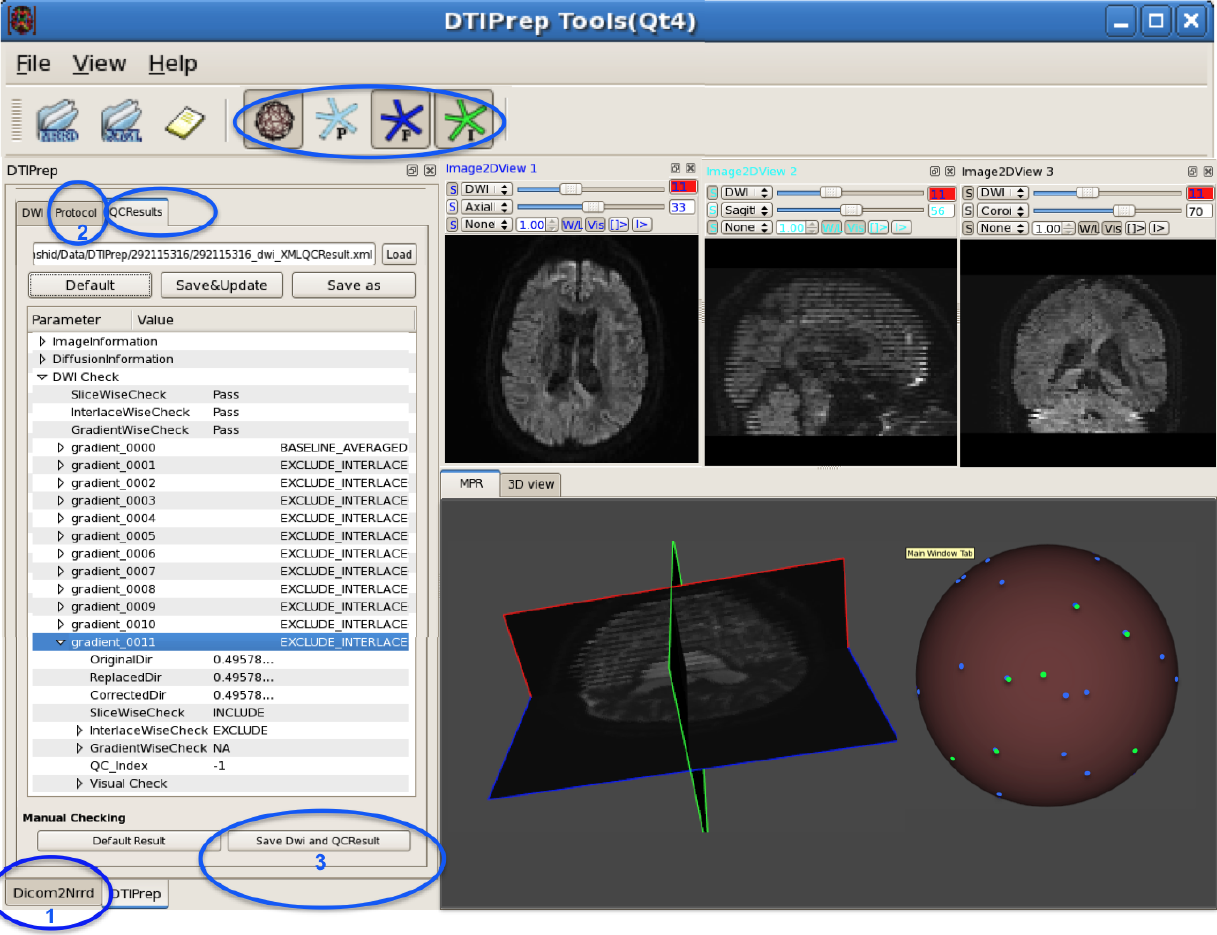
  DTIPrep: Quality Control of Diffusion-Weighted Images I. Oguz, M. Farzinfar, J. Matsui, F. Budin, Z. Liu, G. Gerig, H.J. Johnson, M.A. Styner. In Frontiers in Neuroinformatics, Vol. 8, No. 4, 2014. DOI: 10.3389/fninf.2014.00004 In the last decade, diffusion MRI (dMRI) studies of the human and animal brain have been used to investigate a multitude of pathologies and drug-related effects in neuroscience research. Study after study identifies white matter (WM) degeneration as a crucial biomarker for all these diseases. The tool of choice for studying WM is dMRI. However, dMRI has inherently low signal-to-noise ratio and its acquisition requires a relatively long scan time; in fact, the high loads required occasionally stress scanner hardware past the point of physical failure. As a result, many types of artifacts implicate the quality of diffusion imagery. Using these complex scans containing artifacts without quality control (QC) can result in considerable error and bias in the subsequent analysis, negatively affecting the results of research studies using them. However, dMRI QC remains an under-recognized issue in the dMRI community as there are no user-friendly tools commonly available to comprehensively address the issue of dMRI QC. As a result, current dMRI studies often perform a poor job at dMRI QC. Thorough QC of diffusion MRI will reduce measurement noise and improve reproducibility, and sensitivity in neuroimaging studies; this will allow researchers to more fully exploit the power of the dMRI technique and will ultimately advance neuroscience. Therefore, in this manuscript, we present our open-source software, DTIPrep, as a unified, user friendly platform for thorough quality control of dMRI data. These include artifacts caused by eddy-currents, head motion, bed vibration and pulsation, venetian blind artifacts, as well as slice-wise and gradient-wise intensity inconsistencies. This paper summarizes a basic set of features of DTIPrep described earlier and focuses on newly added capabilities related to directional artifacts and bias analysis. Keywords: diffusion MRI, Diffusion Tensor Imaging, Quality control, Software, open-source, preprocessing |
  Entourage: Visualizing Relationships between Biological Pathways using Contextual Subsets A. Lex, C. Partl, D. Kalkofen, M. Streit, A. Wasserman, S. Gratzl, D. Schmalstieg, H. Pfister. In IEEE Transactions on Visualization and Computer Graphics (InfoVis '13), Vol. 19, No. 12, pp. 2536--2545. 2013. ISSN: 1077-2626 DOI: 10.1109/TVCG.2013.154 Biological pathway maps are highly relevant tools for many tasks in molecular biology. They reduce the complexity of the overall biological network by partitioning it into smaller manageable parts. While this reduction of complexity is their biggest strength, it is, at the same time, their biggest weakness. By removing what is deemed not important for the primary function of the pathway, biologists lose the ability to follow and understand cross-talks between pathways. Considering these cross-talks is, however, critical in many analysis scenarios, such as, judging effects of drugs. |
  LineUp: Visual Analysis of Multi-Attribute Rankings S. Gratzl, A. Lex, N. Gehlenborg, H. Pfister,, M. Streit. In IEEE Transactions on Visualization and Computer Graphics (InfoVis '13), Vol. 19, No. 12, pp. 2277--2286. 2013. ISSN: 1077-2626 DOI: 10.1109/TVCG.2013.173 Rankings are a popular and universal approach to structure otherwise unorganized collections of items by computing a rank for each item based on the value of one or more of its attributes. This allows us, for example, to prioritize tasks or to evaluate the performance of products relative to each other. While the visualization of a ranking itself is straightforward, its interpretation is not because the rank of an item represents only a summary of a potentially complicated relationship between its attributes and those of the other items. It is also common that alternative rankings exist that need to be compared and analyzed to gain insight into how multiple heterogeneous attributes affect the rankings. Advanced visual exploration tools are needed to make this process efficient. |
  enRoute: Dynamic Path Extraction from Biological Pathway Maps for Exploring Heterogeneous Experimental Datasets C. Partl, A. Lex, M. Streit, D. Kalkofen, K. Kashofer, D. Schmalstieg. In BMC Bioinformatics, Vol. 14, No. Suppl 19, Nov, 2013. ISSN: 1471-2105 DOI: 10.1186/1471-2105-14-S19-S3 Jointly analyzing biological pathway maps and experimental data is critical for understanding how biological processes work in different conditions and why different samples exhibit certain characteristics. This joint analysis, however, poses a significant challenge for visualization. Current techniques are either well suited to visualize large amounts of pathway node attributes, or to represent the topology of the pathway well, but do not accomplish both at the same time. To address this we introduce enRoute, a technique that enables analysts to specify a path of interest in a pathway, extract this path into a separate, linked view, and show detailed experimental data associated with the nodes of this extracted path right next to it. This juxtaposition of the extracted path and the experimental data allows analysts to simultaneously investigate large amounts of potentially heterogeneous data, thereby solving the problem of joint analysis of topology and node attributes. As this approach does not modify the layout of pathway maps, it is compatible with arbitrary graph layouts, including those of hand-crafted, image-based pathway maps. We demonstrate the technique in context of pathways from the KEGG and the Wikipathways databases. We apply experimental data from two public databases, the Cancer Cell Line Encyclopedia (CCLE) and The Cancer Genome Atlas (TCGA) that both contain a wide variety of genomic datasets for a large number of samples. In addition, we make use of a smaller dataset of hepatocellular carcinoma and common xenograft models. To verify the utility of enRoute, domain experts conducted two case studies where they explore data from the CCLE and the hepatocellular carcinoma datasets in the context of relevant pathways. |
 International Journal for Uncertainty Quantification, Subtitled “Special Issue on Working with Uncertainty: Representation, Quantification, Propagation, Visualization, and Communication of Uncertainty,” C.R. Johnson, A. Pang (Eds.). In Int. J. Uncertainty Quantification, Vol. 3, No. 3, Begell House, Inc., 2013. ISSN: 2152-5080 DOI: 10.1615/Int.J.UncertaintyQuantification.v3.i3 |
 International Journal for Uncertainty Quantification, Subtitled “Special Issue on Working with Uncertainty: Representation, Quantification, Propagation, Visualization, and Communication of Uncertainty,” C.R. Johnson, A. Pang (Eds.). In Int. J. Uncertainty Quantification, Vol. 3, No. 2, Begell House, Inc., pp. vii--viii. 2013. ISSN: 2152-5080 DOI: 10.1615/Int.J.UncertaintyQuantification.v3.i2 |
  The impact of display bezels on stereoscopic vision for tiled displays J. Grüninger, J. Krüger. In Proceedings of the 19th ACM Symposium on Virtual Reality Software and Technology (VRST), pp. 241--250. 2013. DOI: 10.1145/2503713.2503717 In recent years high-resolution tiled display systems have gained significant attention in scientific and information visualization of large-scale data. Modern tiled display setups are based on either video projectors or LCD screens. While LCD screens are the preferred solution for monoscopic setups, stereoscopic displays almost exclusively consist of some kind of video projection. This is because projections can significantly reduce gaps between tiles, while LCD screens require a bezel around the panel. Projection setups, however, suffer from a number of maintenance issues that are avoided by LCD screens. For example, projector alignment is a very time-consuming task that needs to be repeated at intervals, and different aging states of lamps and filters cause color inconsistencies. The growing availability of inexpensive stereoscopic LCDs for television and gaming allows one to build high-resolution stereoscopic tiled display walls with the same dimensions and resolution as projection systems at a fraction of the cost, while avoiding the aforementioned issues. The only drawback is the increased gap size between tiles. |


