


Visualization
Visualization, sometimes referred to as visual data analysis, uses the graphical representation of data as a means of gaining understanding and insight into the data. Visualization research at SCI has focused on applications spanning computational fluid dynamics, medical imaging and analysis, biomedical data analysis, healthcare data analysis, weather data analysis, poetry, network and graph analysis, financial data analysis, etc.Research involves novel algorithm and technique development to building tools and systems that assist in the comprehension of massive amounts of (scientific) data. We also research the process of creating successful visualizations.
We strongly believe in the role of interactivity in visual data analysis. Therefore, much of our research is concerned with creating visualizations that are intuitive to interact with and also render at interactive rates.
Visualization at SCI includes the academic subfields of Scientific Visualization, Information Visualization and Visual Analytics.


Mike Kirby
Uncertainty Visualization

Alex Lex
Information Visualization
Centers and Labs:
- Visualization Design Lab (VDL)
- CEDMAV
- POWDER Display Wall
- Modeling, Display, and Understanding Uncertainty in Simulations for Policy Decision Making
- Topological Data Analysis for Large Network Visualization
Funded Research Projects:
Publications in Visualization:

|
  A User Study of Visualization Effectiveness Using EEG and Cognitive Load E.W. Anderson, K.C. Potter, L.E. Matzen, J.F. Shepherd, G.A. Preston, C.T. Silva. In Computer Graphics Forum, Vol. 30, No. 3, Note: Awarded 2nd Best Paper!, Edited by H. Hauser and H. Pfister and J.J. van Wijk, pp. 791--800. June, 2011. DOI: 10.1111/j.1467-8659.2011.01928.x Effectively evaluating visualization techniques is a difficult task often assessed through feedback from user studies and expert evaluations. This work presents an alternative approach to visualization evaluation in which brain activity is passively recorded using electroencephalography (EEG). These measurements are used to compare different visualization techniques in terms of the burden they place on a viewer's cognitive resources. In this paper, EEG signals and response times are recorded while users interpret different representations of data distributions. This information is processed to provide insight into the cognitive load imposed on the viewer. This paper describes the design of the user study performed, the extraction of cognitive load measures from EEG data, and how those measures are used to quantitatively evaluate the effectiveness of visualizations. |
| Branching and Circular Features in High Dimensional Data SCI Technical Report, Bei Wang, B. Summa, V. Pascucci, M. Vejdemo-Johansson. No. UUSCI-2011-005, SCI Institute, University of Utah, 2011. |
Topological Methods in Data Analysis and Visualization: Theory, Algorithms, and Applications (Mathematics and Visualization), Valerio Pascucci, Xavier Tricoche, Hans Hagen, Julien Tierny. Springer, 2011. ISBN: 978-3642150135 |
| An End-to-End Framework for Evaluating Surface Reconstruction SCI Technical Report, M. Berger, J.A. Levine, L.G. Nonato, G. Taubin, C.T. Silva. No. UUSCI-2011-001, SCI Institute, University of Utah, 2011. |
| Non-Pinhole Approximations for Interactive Rendering P. Rosen, V. Popescu, K. Hayward, C. Wyman. In IEEE Computer Graphics and Applications, Vol. 99, 2011. |
| Edge Maps: Representing Flow with Bounded Error H. Bhatia, S. Jadhav, P.-T. Bremer, G. Chen, J.A. Levine, L.G. Nonato, V. Pascucci. In Proceedings of IEEE Pacific Visualization Symposium 2011, Hong Kong, China, Note: Won Best Paper Award!, pp. 75--82. March, 2011. DOI: 10.1109/PACIFICVIS.2011.5742375 |
| Comparative Analysis of Multidimensional, Quantitative Data A. Lex, M. Streit, C. Partl, K. Kashofer, D. Schmalstieg. In IEEE Transactions on Visualization and Computer Graphics, Vol. 16, No. 6, pp. 1027--1035. 2010. When analyzing multidimensional, quantitative data, the comparison of two or more groups of dimensions is a common task. Typical sources of such data are experiments in biology, physics or engineering, which are conducted in different configurations and use replicates to ensure statistically significant results. One common way to analyze this data is to filter it using statistical methods and then run clustering algorithms to group similar values. The clustering results can be visualized using heat maps, which show differences between groups as changes in color. However, in cases where groups of dimensions have an a priori meaning, it is not desirable to cluster all dimensions combined, since a clustering algorithm can fragment continuous blocks of records. Furthermore, identifying relevant elements in heat maps becomes more difficult as the number of dimensions increases. To aid in such situations, we have developed Matchmaker, a visualization technique that allows researchers to arbitrarily arrange and compare multiple groups of dimensions at the same time. We create separate groups of dimensions which can be clustered individually, and place them in an arrangement of heat maps reminiscent of parallel coordinates. To identify relations, we render bundled curves and ribbons between related records in different groups. We then allow interactive drill-downs using enlarged detail views of the data, which enable in-depth comparisons of clusters between groups. To reduce visual clutter, we minimize crossings between the views. This paper concludes with two case studies. The first demonstrates the value of our technique for the comparison of clustering algorithms. In the second, biologists use our system to investigate why certain strains of mice develop liver disease while others remain healthy, informally showing the efficacy of our system when analyzing multidimensional data containing distinct groups of dimensions. |
| Visual Links across Applications M. Waldner, W. Puff, A. Lex, M. Streit, D. Schmalstieg. In Proceedings of the Conference on Graphics Interface (GI '10), Canadian Human-Computer Communications Society, pp. 129--136. 2010. ISBN: 1568817125 The tasks carried out by modern information workers become increasingly complex and time-consuming. They often require to evaluate, interpret, and compare information from different sources presented in multiple application windows. With large, high resolution displays, multiple application windows can be arranged in a way so that a large amount of information is visible simultaneously. However, individual application windows' contents and visual representations are isolated and relations between information items contained in these windows are not explicit. Thus, relating and comparing information across applications has to be executed manually by the user, which is a tedious and error-prone task. |
| Caleydo: Design and Evaluation of a Visual Analysis Framework for Gene Expression Data in its Biological Context A. Lex, M. Streit, E. Kruijff, D. Schmalstieg. In Proceeding of the IEEE Symposium on Pacific Visualization (PacificVis '10), pp. 57--64. 2010. ISBN: 424466856 DOI: 10.1109/PACIFICVIS.2010.5429609 The goal of our work is to support experts in the process of hypotheses generation concerning the roles of genes in diseases. For a deeper understanding of the complex interdependencies between genes, it is important to bring gene expressions (measurements) into context with pathways. Pathways, which are models of biological processes, are available in online databases. In these databases, large networks are decomposed into small sub-graphs for better manageability. This simplification results in a loss of context, as pathways are interconnected and genes can occur in multiple instances scattered over the network. Our main goal is therefore to present all relevant information, i.e., gene expressions, the relations between expression and pathways and between multiple pathways in a simple, yet effective way. To achieve this we employ two different multiple-view approaches. Traditional multiple views are used for large datasets or highly interactive visualizations, while a 2.5D technique is employed to support a seamless navigation of multiple pathways which simultaneously links to the expression of the contained genes. This approach facilitates the understanding of the interconnection of pathways, and enables a non-distracting relation to gene expression data. We evaluated Caleydo with a group of users from the life science community. Users were asked to perform three tasks: pathway exploration, gene expression analysis and information comparison with and without visual links, which had to be conducted in four different conditions. Evaluation results show that the system can improve the process of understanding the complex network of pathways and the individual effects of gene expression regulation considerably. Especially the quality of the available contextual information and the spatial organization was rated good for the presented 2.5D setup. |
|
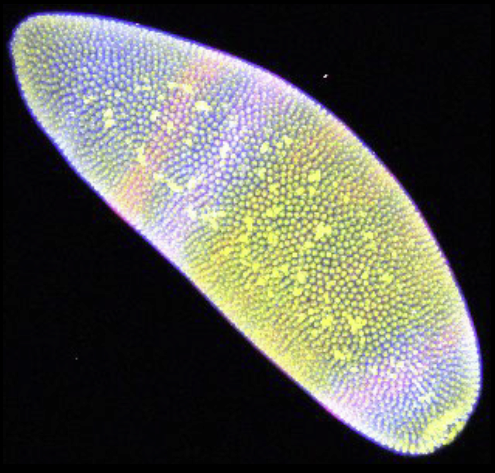
MulteeSum: A Tool for Comparative Spatial and Temporal Gene Expression Data M.D. Meyer, T. Munzner, A. DePace, H. Pfister. In IEEE Transactions on Visualization and Computer Graphics (Proceedings of InfoVis 2010), Vol. 16, No. 6, pp. 908--917. 2010. Cells in an organism share the same genetic information in their DNA, but have very different forms and behavior because of the selective expression of subsets of their genes. The widely used approach of measuring gene expression over time from a tissue sample using techniques such as microarrays or sequencing do not provide information about the spatial position within the tissue where these genes are expressed. In contrast, we are working with biologists who use techniques that measure gene expression in every individual cell of entire fruitfly embryos over an hour of their development, and do so for multiple closely-related subspecies of Drosophila. These scientists are faced with the challenge of integrating temporal gene expression data with the spatial location of cells and, moreover, comparing this data across multiple related species. We have worked with these biologists over the past two years to develop MulteeSum, a visualization system that supports inspection and curation of data sets showing gene expression over time, in conjunction with the spatial location of the cells where the genes are expressed — it is the first tool to support comparisons across multiple such data sets. MulteeSum is part of a general and flexible framework we developed with our collaborators that is built around multiple summaries for each cell, allowing the biologists to explore the results of computations that mix spatial information, gene expression measurements over time, and data from multiple related species or organisms. We justify our design decisions based on specific descriptions of the analysis needs of our collaborators, and provide anecdotal evidence of the efficacy of MulteeSum through a series of case studies. |
| Pathline: A Tool for Comparative Functional Genomics M.D. Meyer, B. Wong, M. Styczynski, T. Munzner, H. Pfister. In Computer Graphics Forum, Vol. 29, No. 3, Wiley-Blackwell, pp. 1043--1052. Aug, 2010. DOI: 10.1111/j.1467-8659.2009.01710.x Biologists pioneering the new field of comparative functional genomics attempt to infer the mechanisms of gene regulation by looking for similarities and differences of gene activity over time across multiple species. They use three kinds of data: functional data such as gene activity measurements, pathway data that represent a series of reactions within a cellular process, and phylogenetic relationship data that describe the relatedness of species. No existing visualization tool can visually encode the biologically interesting relationships between multiple pathways, multiple genes, and multiple species. We tackle the challenge of visualizing all aspects of this comparative functional genomics dataset with a new interactive tool called Pathline. In addition to the overall characterization of the problem and design of Pathline, our contributions include two new visual encoding techniques. One is a new method for linearizing metabolic pathways that provides appropriate topological information and supports the comparison of quantitative data along the pathway. The second is the curvemap view, a depiction of time series data for comparison of gene activity and metabolite levels across multiple species. Pathline was developed in close collaboration with a team of genomic scientists. We validate our approach with case studies of the biologists' use of Pathline and report on how they use the tool to confirm existing findings and to discover new scientific insights. |
|
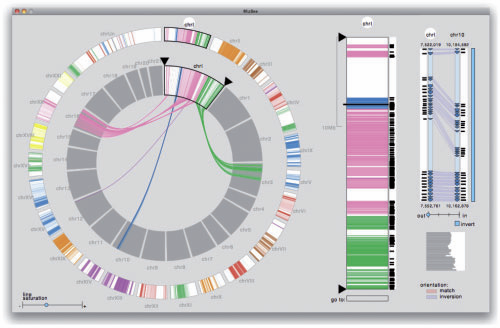
Genome-wide synteny through highly sensitive sequence alignment: Satsuma M. Grabherr, P. Russell, M.D. Meyer, E. Mauceli, J. Alföldi, F. Di Palma, K. Lindblad-Toh. In Bioinformatics, Vol. 26, No. 9, pp. 1145--1151. 2010. Motivation: Comparative genomics heavily relies on alignments of large and often complex DNA sequences. From an engineering perspective, the problem here is to provide maximum sensitivity (to find all there is to find), specificity (to only find real homology) and speed (to accommodate the billions of base pairs of vertebrate genomes). Results: Satsuma addresses all three issues through novel strategies: (i) cross-correlation, implemented via fast Fourier transform; (ii) a match scoring scheme that eliminates almost all false hits; and (iii) an asynchronous 'battleship'-like search that allows for aligning two entire fish genomes (470 and 217 Mb) in 120 CPU hours using 15 processors on a single machine. Availability: Satsuma is part of the Spines software package, implemented in C++ on Linux. The latest version of Spines can be freely downloaded under the LGPL license from http://www.broadinstitute.org/science/programs/genome-biology/spines/ Contact: grabherr@broadinstitute.org |
| Metrics for Uncertainty Analysis and Visualization of Diffusion Tensor Images F. Jiao, J.M. Phillips, J.G. Stinstra, J. Kueger, R. Varma, E. Hsu, J. Korenberg, C.R. Johnson. In Proceedings of the 5th international conference on Medical imaging and augmented reality (MIAR), Beijing, China, Springer-Verlag, Berlin, Heidelberg pp. 179--190. September, 2010. |
| Visual Exploration of High Dimensional Scalar Functions S. Gerber, P.-T. Bremer, V. Pascucci, R.T. Whitaker. In IEEE Transactions on Visualization and Computer Graphics, IEEE Transactions on Visualization and Computer Graphics, Vol. 16, No. 6, IEEE, pp. 1271--1280. Nov, 2010. DOI: 10.1109/TVCG.2010.213 PubMed ID: 20975167 PubMed Central ID: PMC3099238 |
| Topology Verification for Isosurface Extraction SCI Technical Report, T. Etiene, L.G. Nonato, C.E. Scheidegger, J. Tierny, T.J. Peters, V. Pascucci, R.M. Kirby, C.T. Silva. No. UUSCI-2010-003, SCI Institute, University of Utah, 2010. |
| Analysis of Recurrent Patterns in Toroidal Magnetic Fields A.R. Sanderson, G. Chen, X. Tricoche, D. Pugmire, S. Kruger, J. Breslau. In IEEE Transactions on Visualization and Computer Graphics, Vol. 16, No. 6, IEEE, pp. 1431-1440. Nov, 2010. DOI: 10.1109/tvcg.2010.133 |
| Visualizing Summary Statistics and Uncertainty K. Potter, J.M. Kniss, R. Riesenfeld, C.R. Johnson. In Computer Graphics Forum, Vol. 29, No. 3, Wiley-Blackwell, pp. 823--831. Aug, 2010. |
| Caleydo: Connecting Pathways with Gene Expression M. Streit, A. Lex, M. Kalkusch, K. Zatloukal, D. Schmalstieg. In Bioinformatics, Vol. 25, No. 20, pp. 2760--2761. 2009. Understanding the relationships between pathways and the altered expression of their components in disease conditions can be addressed in a visual data analysis process. Caleydo uses novel visualization techniques to support life science experts in their analysis of gene expression data in the context of pathways and functions of individual genes. Pathways and gene expression visualizations are placed in a 3D scene where selected entities (i.e. genes) are visually connected. This allows Caleydo to seamlessly integrate interactive gene expression visualization with cross-database pathway exploration. |
| Connecting Genes with Diseases H Müller, R Reihs, S Sauer, K Zatloukal, M Streit, A Lex, B Schlegl, D Schmalstieg. In Information Visualisation, 2009 13th International Conference, pp. 323--330. July, 2009. DOI: 10.1109/IV.2009.86 This paper presents a visual data mining approach using the combination of clinical data, pathways and gene-expression data. The visual exploration of medical data using pathways to navigate and filter the data allows a more systematic and efficient investigation of problems in modern life science. A multiplicity of hypothesis can be evaluated in the same period of time, enabling a much better exploitation of the data. We present a system for data preprocessing and automatic classification, a set of visualization views and finally the integration in the Caleydo visualization framework, which enables the "coupling" of genetic and a broad spectrum of clinical data. With the help of the Caleydo framework the medical expert can identify connections between genetic parameters, patient subgroups, and drug responses. |
| Gaze-Based Focus Adaption in an Information Visualization System M. Streit, A. Lex, H. Müller, D. Schmalstieg. In Proceedings of the Conference on Computer Graphics and Visualization and Image Processing (CGVCVIP '09), 2009. As the complexity and amount of real world data continuously grows, modern visualization systems are changing. Traditional information visualization techniques are often not sufficient to allow an in-depth visual data exploration process. Multiple view systems combined with linking & brushing are only one building block of a successful InfoVis system. In this paper we propose the incorporation of cheap and simple gaze-based interaction. We employ the tracking information not for selecting data (i.e. mouse interaction) but for an intelligent adaption of 2D and 3D visualizations. Derived from the focus+context paradigm, we call this gaze-focus. The proposed methods are demonstrated by means of three different visualizations. |